
Terrific margins, plenty of cash, a reliable dividend and a modest rating could make Ashmore a decent QARP stock. Maynard Paton studies the fund manager and discovers how lower charges have limited past growth.
Shares offering ‘Quality At a Reasonable Price’ have been hard to find during the last few years. But recent market conditions might be presenting a few fresh opportunities.
Specialist fund manager Ashmore could meet some QARP-type criteria. At present this £2 billion mid-cap offers:
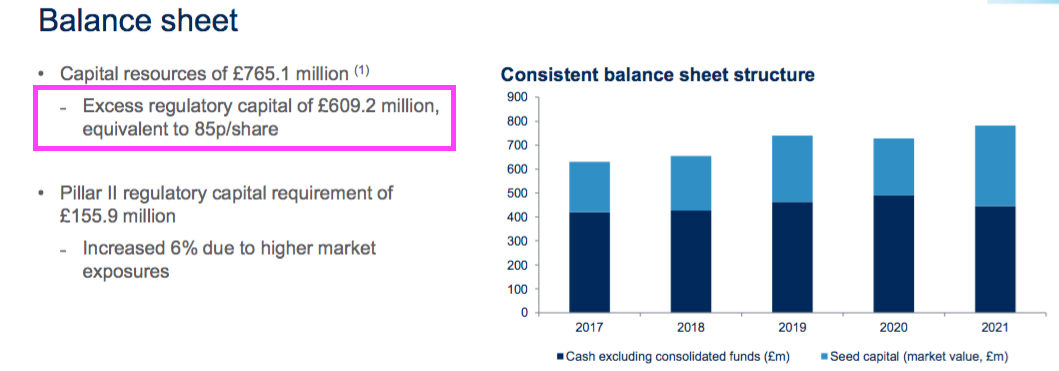
- Impressive financials, including a majestic 66% margin and ‘surplus’ capital of more than £600 million;
- A reliable dividend history, with the payout never being cut during the banking crash and pandemic, and;
- A reasonable P/E of 12-13 alongside a dividend yield of 5%-plus.
Let’s take a closer look.
QARP filter results
I found Ashmore after applying Phil Oakley’s QARP screen, which can be installed through the SharePad home page…

… and employs the following filters:
- A minimum 15% return on capital employed adjusted for goodwill (latest and ten-year average);
- A minimum 20% operating margin (latest and ten-year average);
- A P/E of less than 25;
- Two-year forecast sales growth of at least 5%, and;
- A market cap of at least £300 million.
Phil explained his liking for return on capital employed (ROCE) and operating margin within this article. Note that he adjusts ROCE for goodwill to arrive at ‘ROOCE’:
“Lots of goodwill can depress ROCE and mask a very profitable business that is underneath. To avoid missing these businesses you can calculate the return on operating capital employed or ROOCE for short. To do this in SharePad, just select the ROCE excluding goodwill option when selecting a data field.
These days, ROOCE is my go-to measure for identifying potential investment ideas when just looking at numbers.”
Adjusting ROCE for goodwill is a debatable point. For what it is worth, I never adjust ROCE (or similar ratios) for acquired goodwill because I prefer my calculations to include the cost/contribution impact from acquisitions.
Phil’s QARP screen returned 16 matches:
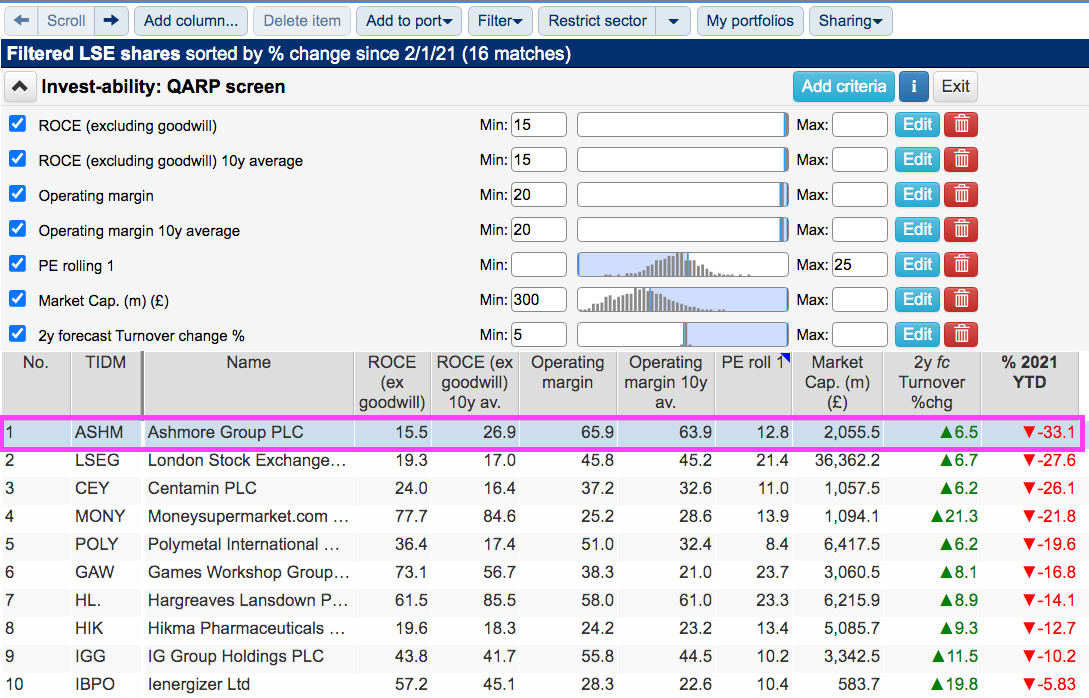
I don’t think the goodwill adjusting made that much difference, as the 16 names were mostly familiar. Companies on the list that I had already studied for SharePad included Games Workshop, Hargreaves Lansdown, Hikma Pharmaceuticals, IG Group and Polar Capital.
I selected Ashmore as its share price had dropped the most of the 16 this year (down 33%). The company’s margin was also a staggering 66% while the shares did indeed look reasonably priced on a P/E of less than 13.
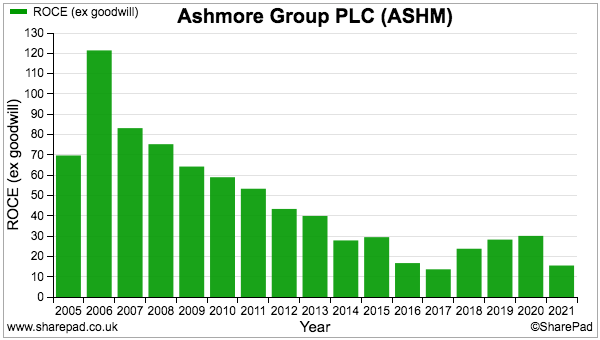
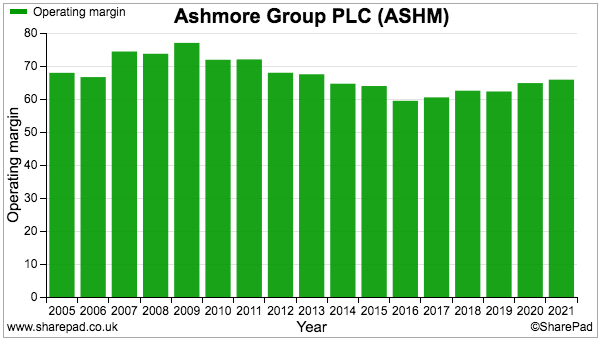
SharePad shows Ashmore’s goodwill-adjusted ROCE has trended lower over time…
…but also confirms the group has regularly sported terrific 60%-plus margins:
The history of Ashmore
Ashmore was established during 1992 as part of the Australia and New Zealand Banking Group and today handles investments worth $91 billion on behalf of global institutional investors.
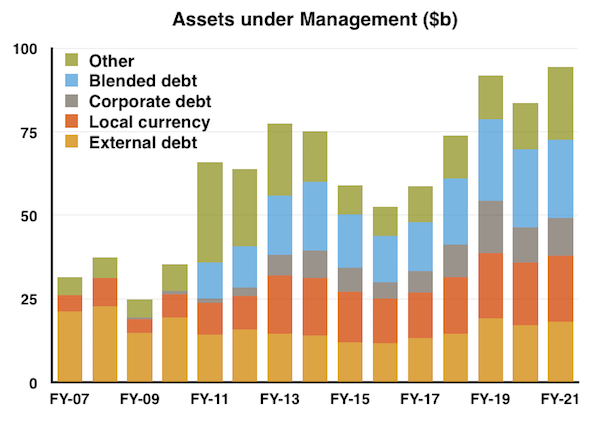
Ashmore’s funds are all actively managed and approximately 80% of client money is invested in four themes centred upon emerging-market bonds:
- External debt: emerging-market government bonds denominated mostly in US dollars;
- Local debt: emerging-market government bonds denominated in their local currency (thereby giving investors added currency exposure);
- Corporate debt: a mix of emerging-market public/private company bonds denominated in US dollars and local currencies, and;
- Blended debt: a mix of External, Local and Corporate holdings.
The other 20% of client money is invested in a range of emerging-market equities and alternative investments.
The business was subject to a management buyout during 1999 and joined the stock market during 2006. Assets under management have since expanded approximately three-fold:
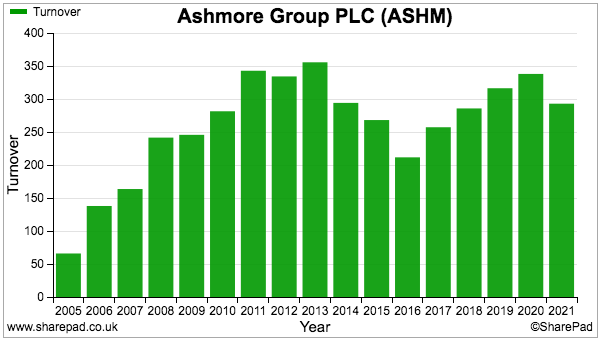
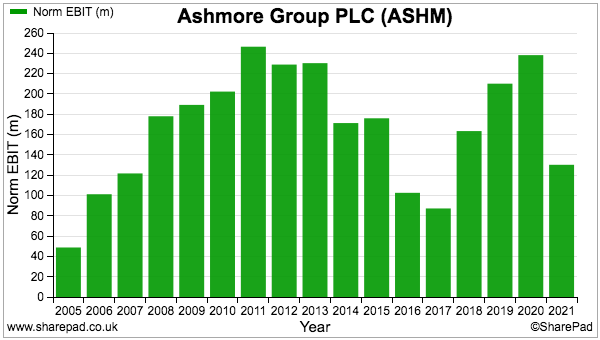
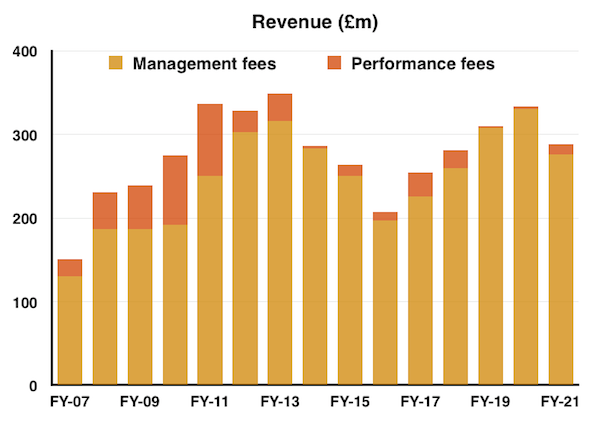
However, revenue and profit have not advanced at the same pace:
This year’s 33% price slump leaves the 290p shares at a level first achieved during 2007:
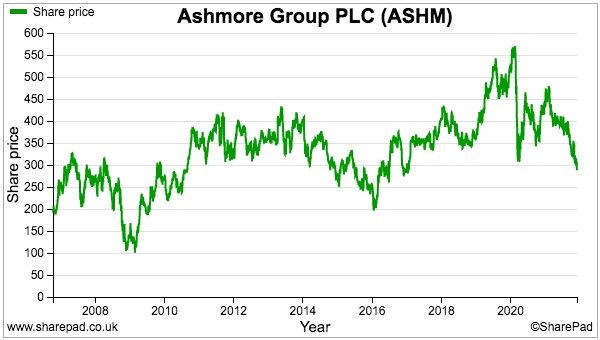
The shares have not really delivered from the initial 170p flotation price of 15 years ago, and a check on Ashmore’s fees explains the somewhat disappointing long-term performance.
Fund fees and client returns
Ashmore’s revenue is largely a function of assets under management multiplied by a percentage management fee…
… and the percentage management fee paid by clients has collapsed over time.
The chart below is probably the most important of this article: 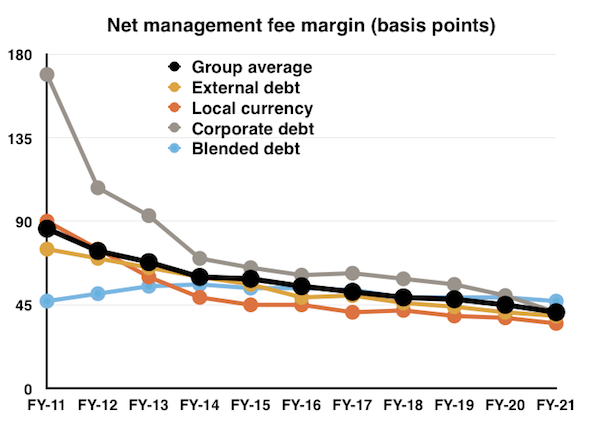
Ten years ago Ashmore collected a group average 86 basis-point margin (black line), or 0.86%, from its then assets under management.
That rate has since more than halved to 41 basis points.
Ashmore’s corporate-debt fees (grey line) have been a particular casualty. The group was once able to charge clients 1.69% a year on their corporate-debt investments, but that rate has since been chopped to 0.41%.
The all-round fee-rate collapse has been caused by the lower returns delivered to clients, and the fees having to be adjusted accordingly.
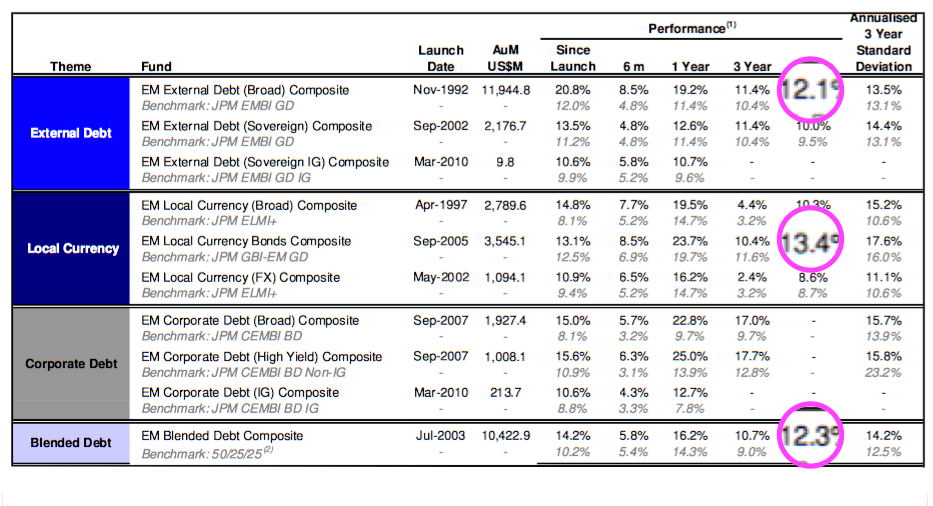
Back in 2011 Ashmore was trumpeting double-digit five-year compound returns from its flagship debt strategies:
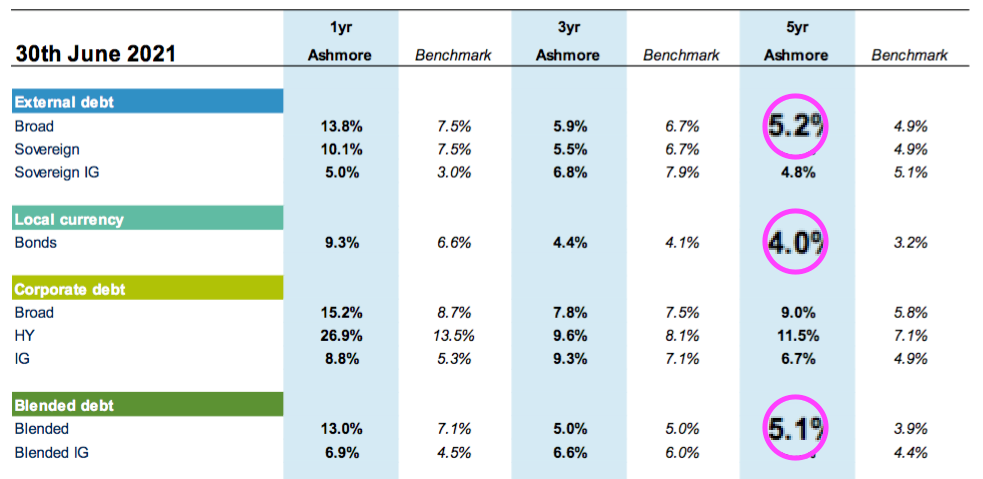
But today the debt strategies have typically delivered 5% per annum:
Not helping matters are dwindling performance-related fees. Such income was once adding approximately 30% to annual management fees, but during the last decade has added less than 6% on average:
SharePad contains information on seven of Ashmore’s institutional funds:
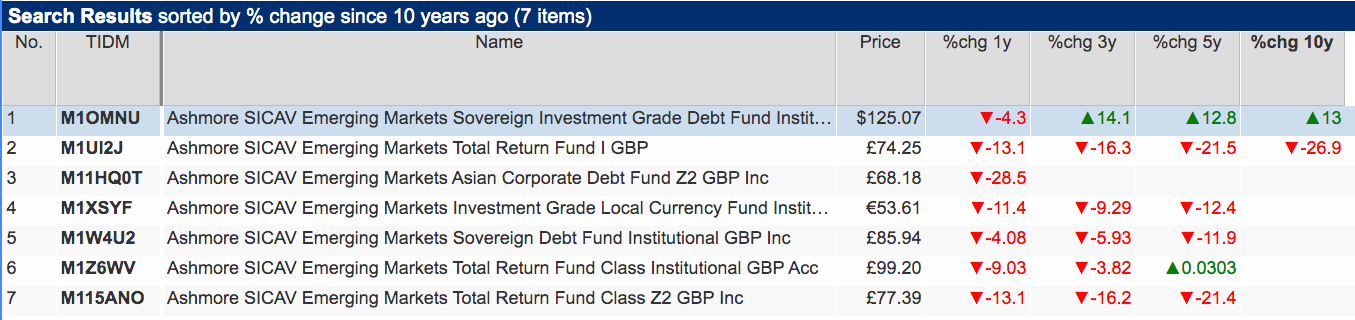
Those investment performances do not look too appealing to me.
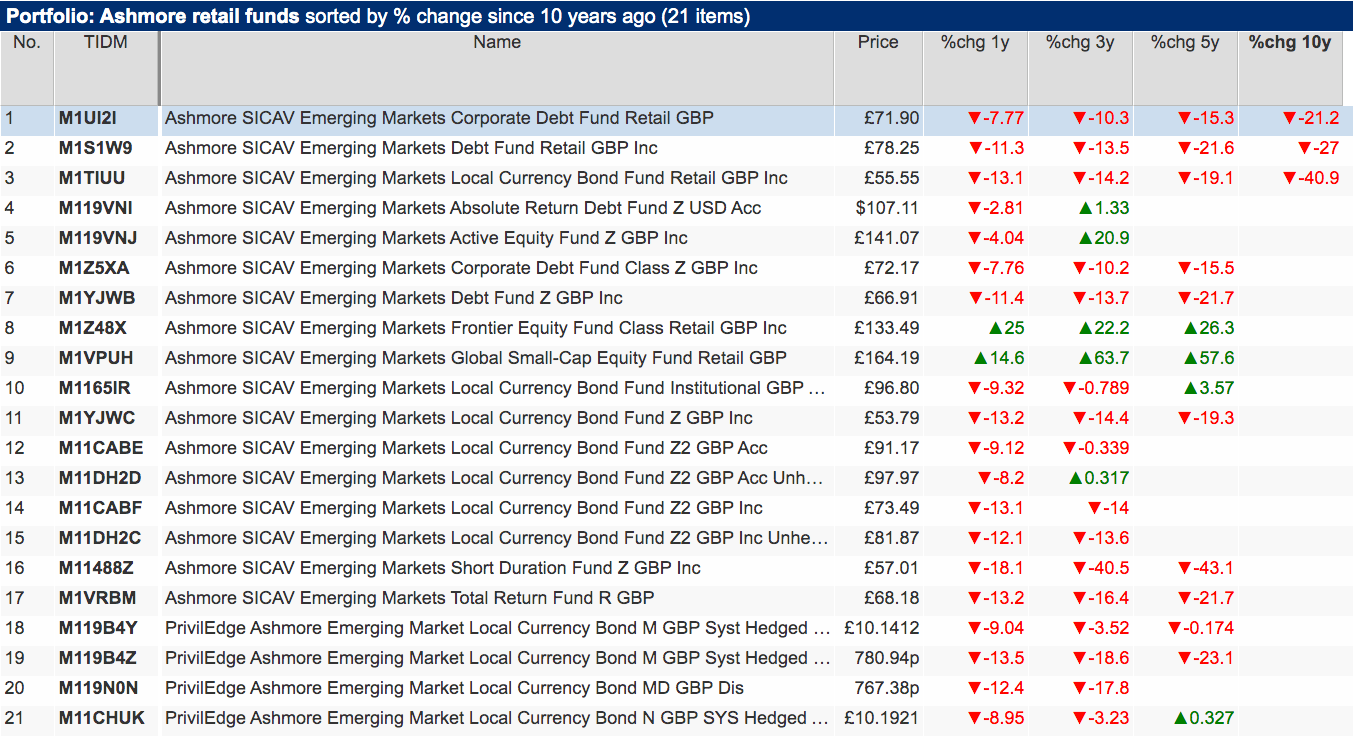
The performances of Ashmore retail funds are no better:
Mind you, Ashmore claims 79% of its funds have outperformed their respective benchmarks (before fees) over the last five years…
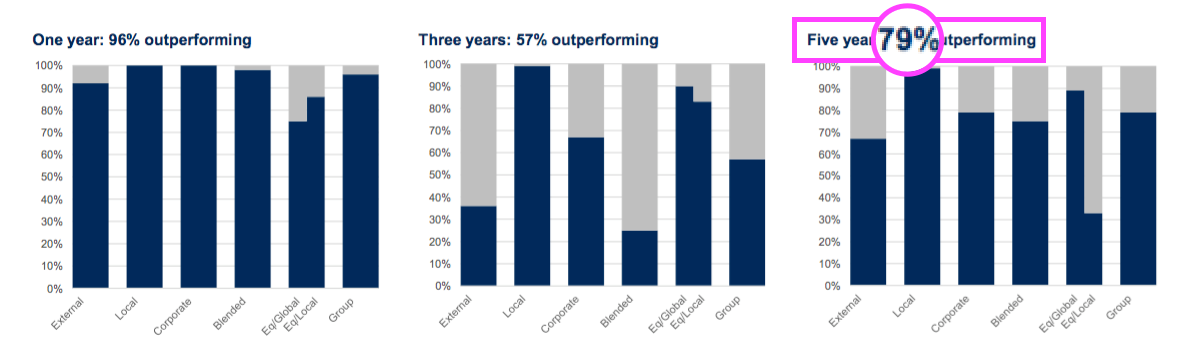
…so perhaps the SharePad snapshots are not representative of the full client offering.
Margins and employees
The aforementioned 66% operating margin is certainly worth further investigation.
SharePad shows a standardised operating profit of £130.5 million…
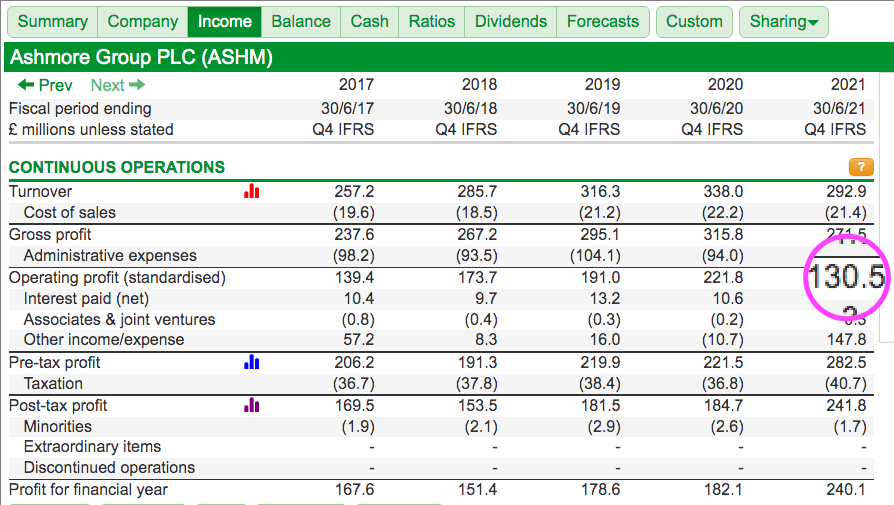
… which leads to a 45% margin. But there’s also a company-adjusted £192.9 million operating profit…
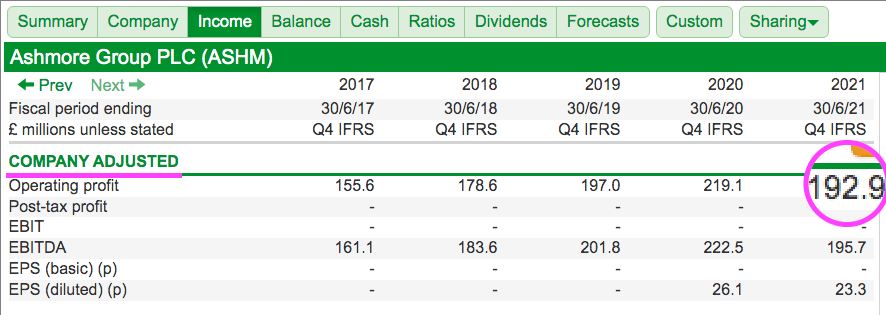
… which gives us that 66% margin.
The annual report is required to explain the profit difference of £62.4 million, and the relevant note is shown below:
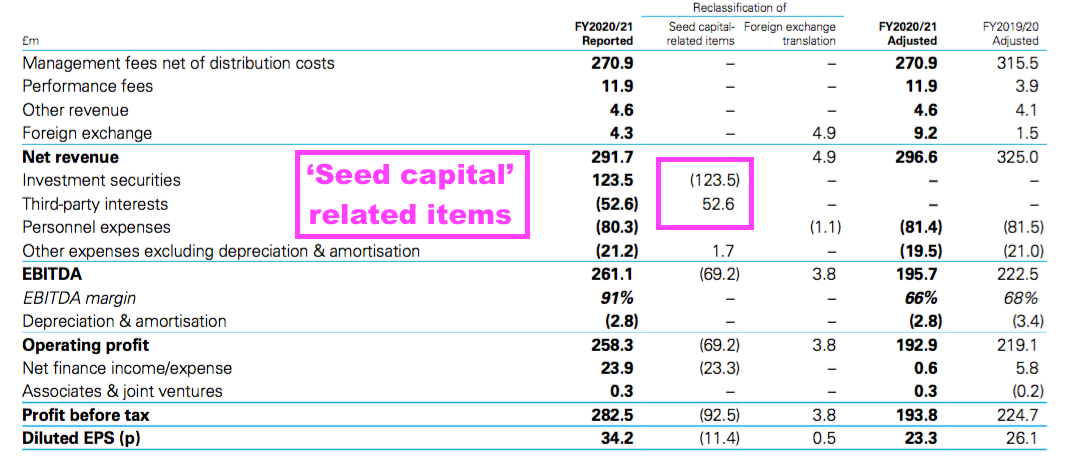
The difference relates mostly to the profit Ashmore made on its own ‘seed capital’ investments (£123.5 million), and the losses clients suffered within certain group-controlled funds (£52.6 million). Both adjustments are legitimate and I will touch upon the investment gains in a second.
But going back to the annual report, see how employee costs stayed at £81 million despite management fees falling 14%:
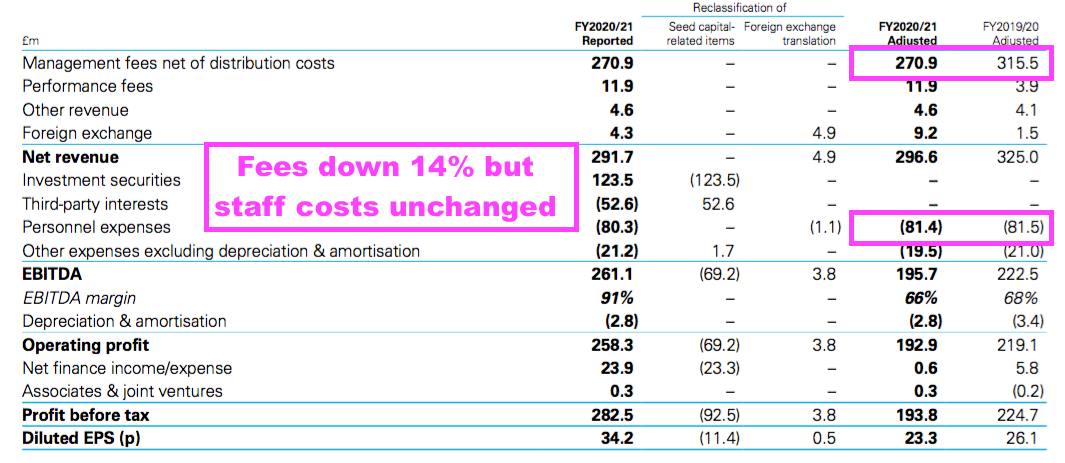
Employee costs can be a problem at fund managers; regardless of whether client portfolios — and the fees clients pay — go up or down, the staff always seem to enjoy greater pay and bonuses.
Interestingly enough, performance-related pay (red boxes) has totalled £107m during the last five years…
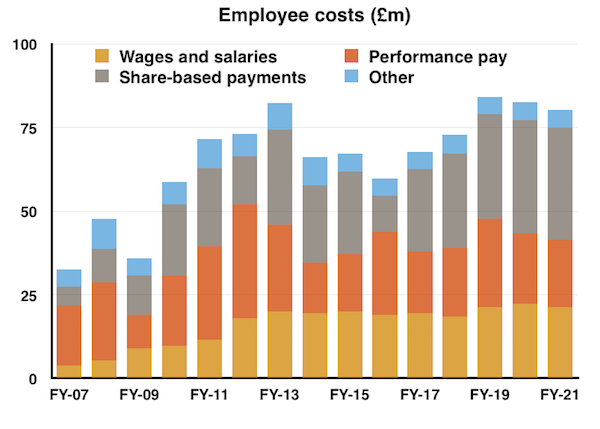
… and yet during the same time clients have paid performance-related fees of only £69 million. I am not quite sure why the staff receive performance bonuses that are not covered entirely by the extra performance fees paid by clients.
No surprise, then, to see total employee costs as a proportion of management and performance fees steadily climb from 20% to almost 30% since the flotation:
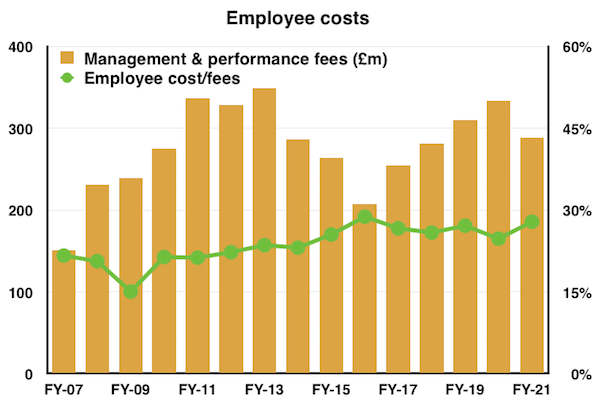
While Ashmore’s employees are paid very handsomely (£80 million shared by almost 300 workers is £270k each), they do seem to be among the most productive within the industry.
Revenue per employee is £1 million and towards the top of the sector:
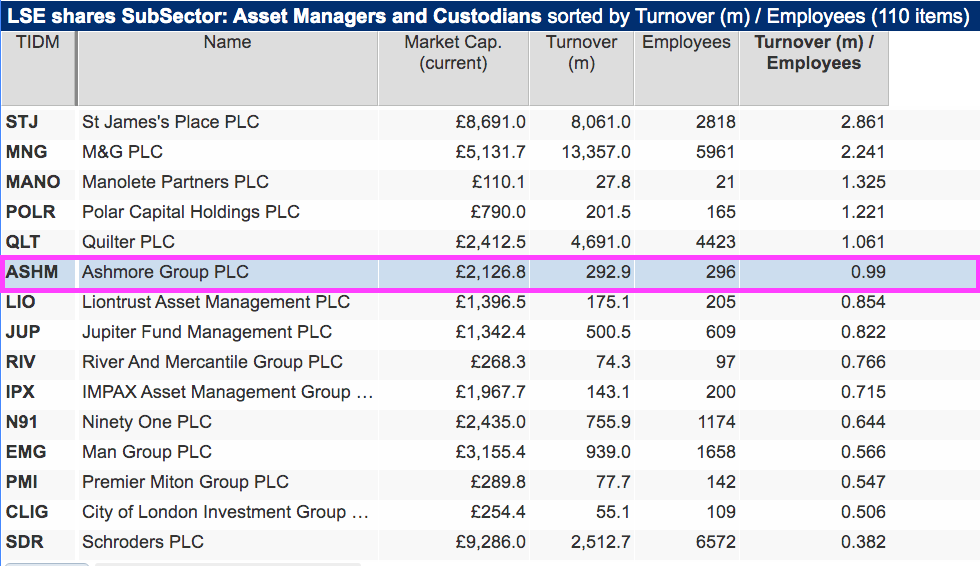
Client assets per employee is approximately £240 million, too, versus less than £200 million at conventional UK equity managers Impax Asset Management, Jupiter Fund Management and Polar Capital.
Cash and investments
Ashmore’s bumper margins are accompanied by a bumper financial position.
SharePad shows cash and investments have accumulated to more than £800m with no bank debt:
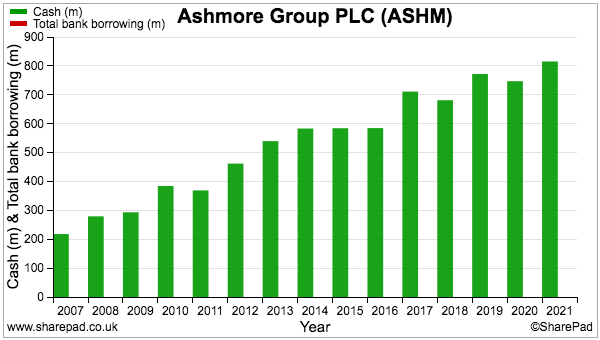
The rising cash hoard goes a long way to explain the declining ROCE in that earlier chart; Ashmore’s capital base is dominated by cash that contributes nothing to profit.
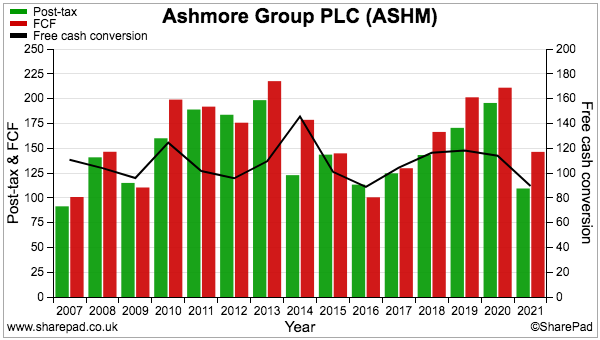
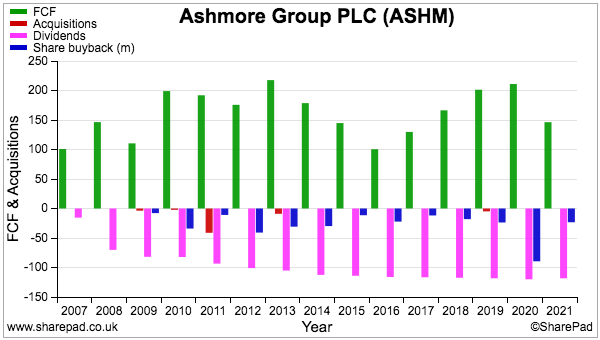
The cash position has in part been supported by an average 100% or so of earnings converting into free cash:
Ashmore’s balance sheet is complicated somewhat by client-owned investments and regulatory-required capital, but the group implies ‘surplus’ capital is £609 million or 85p per share:
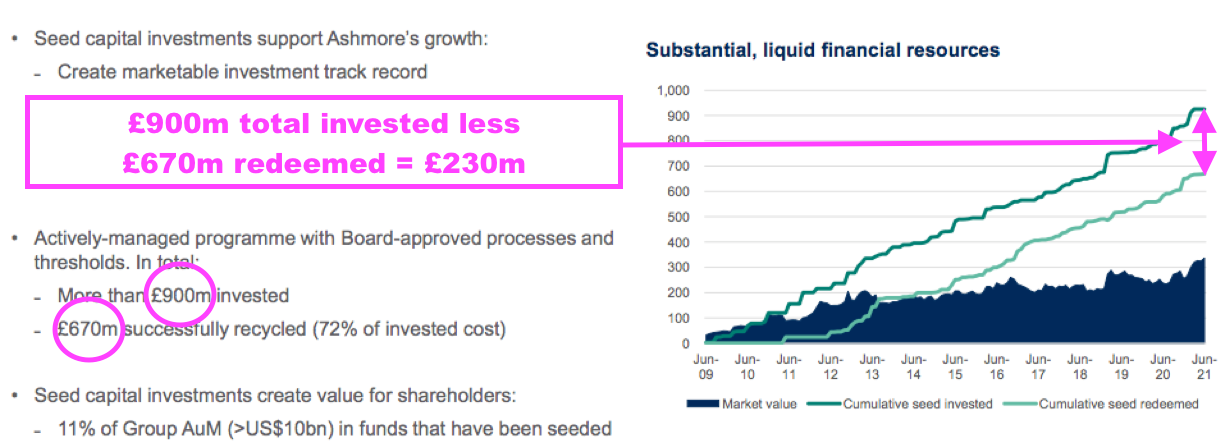
Ashmore has £337 million invested as ‘seed capital’ within its own funds, which offers the opportunity for investment gains and eventually reinvestment into fresh start-up funds.
The group implies the present £337 million was created from a net initial investment of £230 million, and the resultant ‘seed’ gains occasionally complement regular profits:
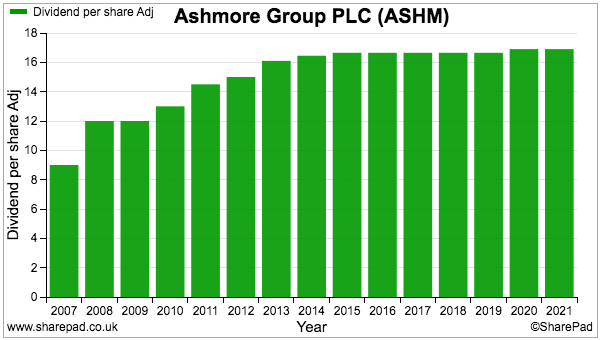
The super cash generation has funded mostly share buybacks to settle employee share schemes alongside some hefty dividends…
…although be aware that the dividend has barely moved since 2014:
Forecasts, management and valuation
Current forecasts do not suggest the dividend will improve rapidly during the next few years:
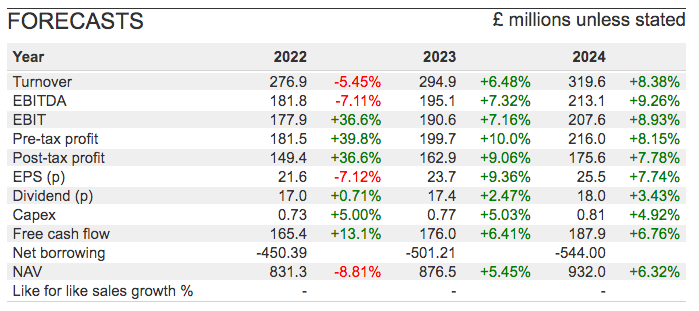
Note the 30%-plus profit increases shown for 2022 are due to a mismatch between how SharePad and City brokers compile their figures. The projections essentially expect adjusted profits to drop approximately 7% for 2022 and then rebound back to 2021 levels for 2023.
The single-digit growth rate chimes with the boardroom’s LTIP, which pays out in part if assets under management expand by at least 5% per annum during the next five years.
Client money under management has in fact compounded at 12% per annum during the last five years, but contracted by 4% per annum for the five years before that.
One possible issue could be whether Ashmore’s chief executive remains keen to grow the business further. Mark Coombs led the 1999 management buyout and retains a 31%/£640 million shareholding:
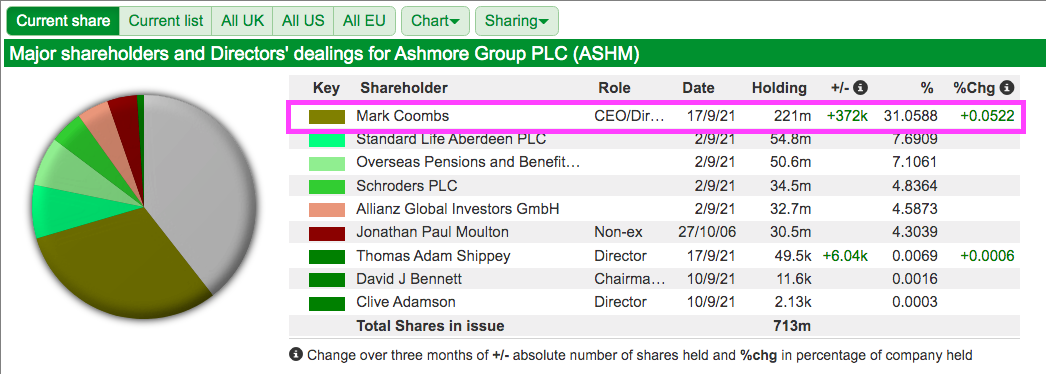
Mr Coombs presently collects a £37 million annual dividend and has received total dividends of approximately £630 million since Ashmore’s flotation.
Throw in aggregate pay and bonuses of close to £40 million since the flotation, and you could question whether lifting client money by 5% a year to meet an LTIP target — or indeed lifting the dividend — is really a major concern for the billionaire chief exec.
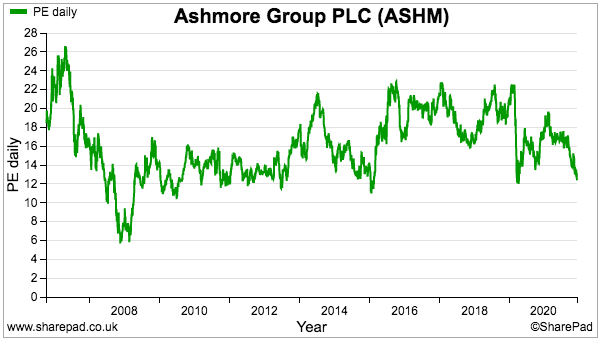
The modest growth projections are reflected by a modest valuation. The trailing P/E of 12…
… and yield of 5%-plus…
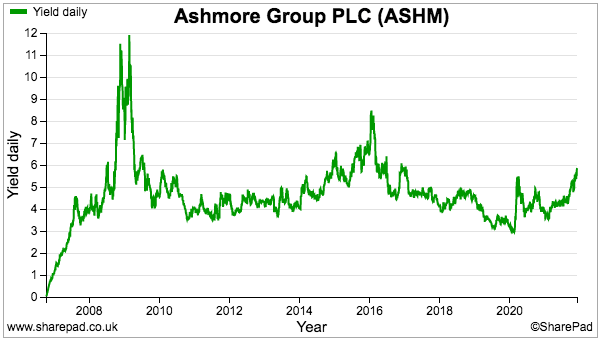
…are hardly expensive but not entirely out of keeping with the company’s past rating. That said, up to 30% of the market cap could be supported by the aforementioned ‘surplus’ capital of £609 million, and that surplus has been somewhat less before now.
All told, Ashmore feels like a reasonably attractive (if slow-growing) business and I would venture its high yield could make it very suitable for a diversified FTSE 350 income portfolio.
True, superb capital gains may be hard to come by unless significant inflows of new client money appear. Last year new client money represented just 1% of assets under management; sector 20-bagger Impax Asset Management in contrast reported 29%.
Fund-management earnings are of course very susceptible to market gyrations and Ashmore’s emerging-market bonds may never be the safest of havens.
But the cash-flush balance sheet ought to shore up the payout during any trouble, and major downturns such as the banking crash and the Covid panic have not upset the dividend to date.
Until next time, I wish you safe and healthy investing with SharePad.
Maynard Paton
Maynard writes about his portfolio at maynardpaton.com and hosts an investment discussion forum at quidisq.com. He does not own shares in Ashmore.
This article is for educational purposes only. It is not a recommendation to buy or sell shares or other investments. Do your own research before buying or selling any investment or seek professional financial advice.


fund performance vs peers is awful despite what they say. i would expect them to lose market share.
Hi Maynard,
I would love to hear your considerations about how inflation, interest rates, tapering and the strengthening dollar affects a business like Ashmore. Is there a relationship between the US tapering in 2013 and the declining turnover/EBIT of Ashmore?
Hi Niels
Sadly I can’t offer any useful considerations on the macro side of things. All I can say is the returns delivered by ASHM’s funds have reduced over time and whether that is due to US tapering, poor bond selections or something else is hard to say. The reductions to revenue/profit are due to clients paying less (or leaving), which will be linked to long-term fund performance. Even if US tapering was to blame for poor fund performance and ASHM could do nothing about it, I doubt the clients would care and would simply move on.
Maynard
Hi Maynard, excellent review as always.
My main problem with Ashmore is that it’s an asset manager, and asset management is a very tough business to be in. Sustaining good returns over long periods is very hard, and star fund managers have a nasty habit of being lured away by higher wages elsewhere, or by setting up their own boutique.
I do own a few fund management-related businesses, but they tend to super-established giants that can attract and retain talent and have sufficient economies of scale to thrive in a world of passive investments and low fees (e.g. Schroders or L&G).
Interesting comment re the bonus of £270k paid to each member of staff. This is not true.
The majority of the “back office” staff will have been paid a fraction of this – £40 – £50K at most with the vast majority going to “front office” traders and senior management. Mr C took £850k of that bonus pool.
From the annual report “One key element of Ashmore’s remuneration structure is that it has
been designed to apply to all Ashmore Group employees, not just the Executive Directors” Given that the ED’s ( under the guidance of one man ) determine the allocation of the pie you can guess where most of it ends up.
From the AR – “On an annual basis the bonus pool is derived solely from profits made in the year and has been capped at 25% of earnings before variable compensation, interest and tax,
ensuring predictability of overall outcomes. Up to 77% of variable remuneration is delivered in Ashmore Group plc shares, restricted and deferred for five years.”
You can see that the company awards a big chunk of the bonus as a share allocation in Ashmore Group, which is then locked up for 5 years. In the event of an employee leaving ALL accrued bonus is lost. See Page 100 of the AR for full details. This policy has the effect that there are no “star traders” to be seen.
Ashmore has been having issues about its remuneration policy – see page 85 – 115 of the AR for a whole slew of information about remuneration. The idea is that having a low staff fixed cost base allows the company to weather downturns and retain staff rather than “hiring and firing” as the economic cycle changes.
Mr Coombs is focused on the company performing as well as it possibly can and growing the AUM in a safe, steady secure manner. Hitting an LTIP trigger point will be of secondary concern.