

Today I have revisited a share screen that applies two ratios favoured by ‘quality’ investors — operating margin and return on equity (ROE).
The exact criteria I re-used were:
1) An operating margin (latest and 10-year average) of 20% or more, and;
2) An ROE (latest and 10-year average) of 20% or more.
Any business with a margin and ROE above 20% is often quite special.
I employed the screen a couple of months ago to identify Victrex. This time I have pinpointed Jupiter Fund Management, a £1.7 billion FTSE 250 fund manager:

(You can run this screen for yourself by selecting the “Maynard Paton 25/04/19: Victrex” filter within SharePad’s magnificent Filter Library. My instructions show you how.)
Margins, ROE and the wider sector
Let’s first check Jupiter’s margin history:

The operating margin has almost always exceeded 20% and during recent years has topped 40%. Jupiter’s funds are clearly extremely lucrative — at least for Jupiter.
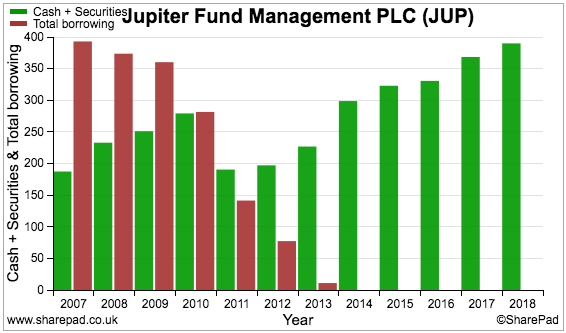
Jupiter’s ROE has generally hovered above the 20% mark:

Ignoring the 2007 and 2008 figures — they are aberrations due to Jupiter’s then debt financing — the ROE record suggests the company can operate with only modest levels of capital.
I should add that the fund-management industry is ripe with high-margin, high-ROE businesses.
SharePad reveals at least another eight constituents with 20%-plus margins and ROEs recorded during the last year:

I am not surprised by the industry’s superior ratios.
In theory at least, managing a fund should lead to significant ‘economies of scale’ — the cost of running a £10 billion fund ought to be similar to the cost of running a £5 billion fund, although the former could bring in double the fees of the latter!
The history of Jupiter
Jupiter Fund Management was established during 1985 and currently handles investments worth £44 billion on behalf of both individual and institutional investors.
Jupiter’s funds are all ‘actively managed’, invest predominantly in equities and bonds, and cover a broad range of investing themes and geographies.
Approximately half of Jupiter’s funds are owned by the public through IFAs, online ‘platforms’, banks and stock brokers. The other half are held mostly by other fund managers and institutions.

The group’s progress has been driven partly by ‘star’ fund managers trouncing their benchmarks and attracting new clients.
Notable Jupiter stock-pickers of the past include Anthony Nutt, who favoured ‘old economy’ dividend stocks during the early-Noughties tech slump, and Philip Gibbs, who placed 80% of his Jupiter fund into cash ahead of the 2008 banking crash.
Lead names within Jupiter at present include Alexander Darwall, Ben Whitmore and John Chatfeild-Roberts.
Mr Darwall has managed Jupiter’s European funds well. He is ranked second out of 77 similar fund managers by Citywire on a five-year basis:

Mr Whitmore is ranked 22nd out of 81 with his Income fund:

Mr Chatfeild-Roberts is ranked 272nd out of 373 within the Global Equity sector:

Jupiter is currently enjoying its second stint on the stock market. The business floated initially in 1991 and was sold to Commerzbank in 1995. A management buy-out occurred during 2007 and the business rejoined the market three years later.
Jupiter’s assets under management (AUM) increased by £24 billion between 2007 and 2018:

Of that £24 billion, a net £11 billion was received from clients and £13 billion was generated by rising markets:

The rising AUM has converted into greater management fees, which in turn have converted into higher revenue, profit and ordinary dividends:


The shares have doubled since the 165p flotation:

However, the current price is 43% below the 632p set at the start of 2018.
Let’s now check on Jupiter’s funds.
Fund performances and fees
Jupiter’s ten largest funds represent 62% of the group’s AUM:

The presentation slide above shows nine of those ten funds delivering first- or second-quartile performances during the last three years.
My chart below shows most of Jupiter’s AUM consistently boasting three- and five-year records of outperformance:

However, I am always wary of these statistics — the fund-management industry has an irritating habit of fudging the numbers by closing or merging under-performing funds!
My research suggests Jupiter’s larger equity funds have performed relatively well over five years, but less so over three:


(Note: Returns cover the three and five years to 30 April 2019. iShares FTSE 100 ETF added for comparison)
Mr Darwall’s European portfolio certainly appears to be the best performer.
Jupiter’s net fee margin — that, is the rate of management fees earned from managed funds after IFA, platform and other ‘distribution’ costs — is on a notable downward trend:

A mix of regulatory, client and competitive pressures have sliced Jupiter’s net management fee from 121 basis points to 90 basis points of AUM.
(In other words, Jupiter used to earn a net 1.21% from a typical managed fund but now earns a net 0.90%.)
Similar to others in the sector, Jupiter expects its fee rates to keep falling:

Jupiter’s SharePad summary
Jupiter’s SharePad Summary is shown below:

I see three points of interest:
1) Revenue, profit and EPS are all expected to decline during 2019 (second row);
2) Earnings have converted very well into free cash (third row);
3) The forecast dividend is expected to increase significantly and supply an attractive yield (fourth row).
Let’s start with the revenue and profit projections.
Forecasts and recent AUM movements
SharePad provides these forecasts:

Falling AUM explains the red numbers for 2019.
AUM dropped 12% to £42.7 billion during the second half of 2018, which caused second-half profit to fall 17% to £83m. Doubling up that figure gets us close to the projected 2019 profit forecasts shown by SharePad.
A first-quarter statement issued in April revealed AUM rebounding 3% to £44.1 billion:

However, ‘net flows’ — that is, new fund subscriptions less fund redemptions — was negative for the fifth consecutive quarter. This 15-month run of outflows is Jupiter’s worst since its 2010 flotation.
Some clients are obviously voting with their feet. In particular, approximately £4 billion was withdrawn from Jupiter’s Dynamic Bond portfolio last year.
Jupiter claimed those redemptions were “principally a result of short-term relative performance in the fund, allied to an industry-wide withdrawal from global fixed-income products.”
Jupiter’s worst period for outflows before 2018 was a nine-month spell during 2011/2012.
A policy to at least maintain the ordinary dividend
Jupiter’s predicted 37% dividend jump for 2019 seems odd given the forecasts for lower profits.
The company’s 2018 results explain what is going on — Jupiter likes to pay special dividends:
“Jupiter has a progressive ordinary dividend policy: our intention is for the ordinary dividend pay-out ratio to be 50% of underlying earnings across the cycle.
In the event that current year profits are lower than in previous years, the Group maintains the ordinary dividend at the previous high water mark pence per share level.
The Board expects to retain up to 10% of earnings for capital and growth, with the remaining balance, after taking account of any specific events, returned to shareholders.
In current market conditions, shareholders have indicated that their preferred method of capital return is a special dividend.”
So: the 23.4p per share forecast dividend within SharePad includes a predicted special payout, but is compared to the 2018 ordinary payout of 17.1p per share to give that expected 37% jump.
Given Jupiter’s EPS is expected to fall during 2019, the group’s ordinary dividend should be held at the previous 17.1p per share ‘high water mark’.
Then in order to retain 10% — or 2.68p per share — of the predicted 26.8p EPS, the special payout for 2019 could therefore be 7.02p per share.
A potential 7.02p per share special payout compares with an 11.4p per share special declared for 2018 and a 15.5p per share special declared for 2017.
SharePad’s Dividends tab confirms Jupiter’s welcome special-dividend habit:

Jupiter’s commendable dividend policy explains those appealing ROE figures. The business can sustain relatively high profits by retaining only 10% (or less) of earnings each year.
Cash flow and options
Jupiter’s SharePad Summary showed a super 116% of earnings converting into free cash.
Sure enough, the company has regularly converted more than 100% of post-tax profit into cash flow following the flotation:

SharePad’s Cash tab reveals modest working-capital movements, and small differences between depreciation/amortisation and capital expenditure:

Those items are therefore not really bolstering free cash. Instead, what SharePad calls ‘Other (operating)’ appears to be significantly assisting Jupiter’s cash flow:

The 2018 annual report reveals ‘Other (operating)’ to be mostly share-based payments:

Share-based payments are a charge against earnings and represent the theoretical accounting cost of a company’s option schemes.
(The actual cash cost of the option scheme may be completely different — the figure could be zero if the company is happy to let options convert into extra shares and ‘dilute’ existing shareholders.)
Further down the cash flow statement is an entry called ‘Purchase of shares by EBT’:

EBT stands for Employee Benefit Trust, which is a company-administered trust that buys shares in order to satisfy future option awards.
During the last five years, Jupiter has injected £115m into its EBT — and this £115m is a true cash cost for shareholders.
To summarise a complicated story about option accounting, Jupiter’s free cash flow should really be calculated after these EBT purchases.
In Jupiter’s case, the (non-cash) share-based charges are counterbalanced by the (cash) EBT expenditure, and so — with modest capex and working-capital movements to boot — earnings still appear underpinned by cash flow.
Note that the substantial size of Jupiter’s EBT contributions indicate the business is generous with its option plans.
This next chart confirms the EBT has done its job by keeping the share count unchanged:

Meanwhile, this chart shows Jupiter spending its free cash only on those EBT purchases and dividends:

And this chart shows Jupiter’s post-flotation debt being cleared with cash and investments then piling higher:
At the end of 2018, cash was £178m and investments — mostly in Jupiter’s own funds — came to £212m.
Note that £64m of the cash position represents Jupiter’s estimated regulatory capital and is therefore not ‘surplus to requirements’. In addition, £74m of Jupiter’s investments are actually owned by clients or carry a matching hedging liability.
As such, Jupiter arguably holds net cash and investments of £252m — approximately 15% of the current market cap.
Employees and pay
I am impressed with the level of revenue generated by Jupiter’s employees. The chart below shows each staff member producing average sales of almost £900k:
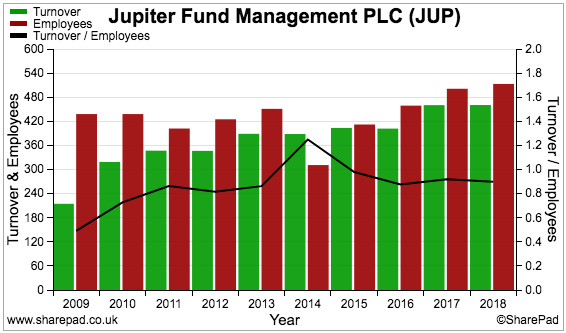
SharePad rates Jupiter third in the sector on revenue per employee:

The downside to the impressive employee productivity is the associated expense. Each staff member costs a mighty £251k average a year.
I reckon employee costs as a proportion of all costs have risen from 40% to 50% since the flotation:

My chart below shows the remuneration of Jupiter’s chief executive:

The boss enjoys a £1 million-plus annual bonus every year, regardless of whether earnings rise or fall.
At least Jupiter’s vice chairman — who led the management buyout — ought to fight for shareholders within the boardroom. He holds shares worth £36m:

I should add the vice chairman works only a three-day week.
Valuation and summary
Jupiter has been refreshingly straightforward to analyse.
The accounts are free of complications while the operating margin, ROE and other ratios are signalling investment ‘quality’. The regular special dividends are very positive, too.
Mind you, fee rates have declined and employment costs have risen. I see both trends continuing, which one day may permanently squeeze Jupiter’s immense profitability.
Those 15 months of outflows are concerning, too. From what I can tell, Jupiter’s largest funds do not collectively boast a sensational investment performance. Some customers have already decided better returns lie elsewhere.
A lot therefore rests on the talents of Mr Darwall, Mr Whitmore, Mr Chatfeild-Roberts and Jupiter’s other managers. A good run of form from the large funds should attract new money, generate extra fees and alleviate any growth worries.
In the meantime, Jupiter’s shares trade at a near-low P/E and a near-high yield:


Assuming a huge bear market is not imminent, Jupiter’s useful dividend looks safe to me. I could understand if fans of the fund-management sector — or indeed fans of Jupiter’s funds — wanted to look closer at the company.
Until next time, I wish you happy and profitable investing with SharePad.
Maynard Paton
Disclosure: Maynard does not own shares in Jupiter Fund Management.
This article is for educational purposes only. It is not a recommendation to buy or sell shares or other investments. Do your own research before buying or selling any investment or seek professional financial advice.


