

I am not a great fan of the fund-management industry.
I cannot think of another sector where the employees collect enormous salaries while the customers pay hefty fees and sometimes get nothing in return.
Quite often us amateur investors are better off with simple index trackers rather than falling for the industry’s persuasive advisers and glossy brochures.
Yet here I am about to study Polar Capital — a fund manager that might actually exhibit ‘pandemic proof’ qualities given its investment bias towards technology and healthcare.
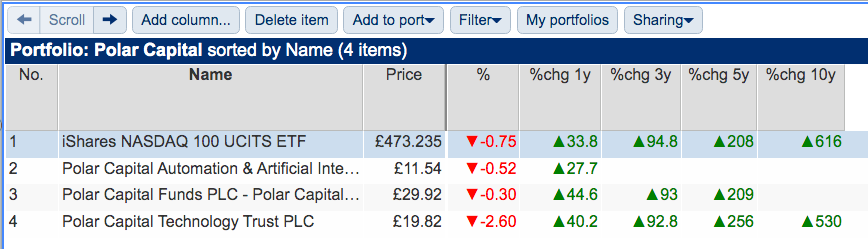
For some time now, Polar has featured on the SharePad screens I employed to identify Ramsdens, Somero Enterprises and Victrex:
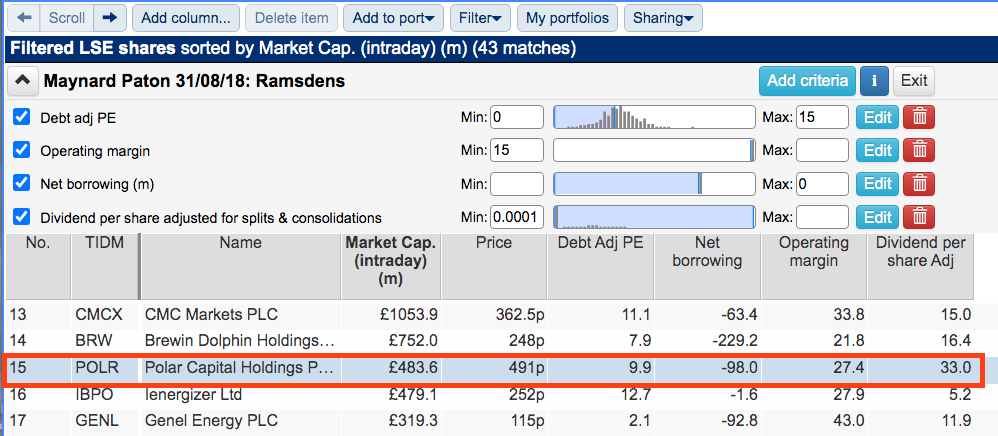
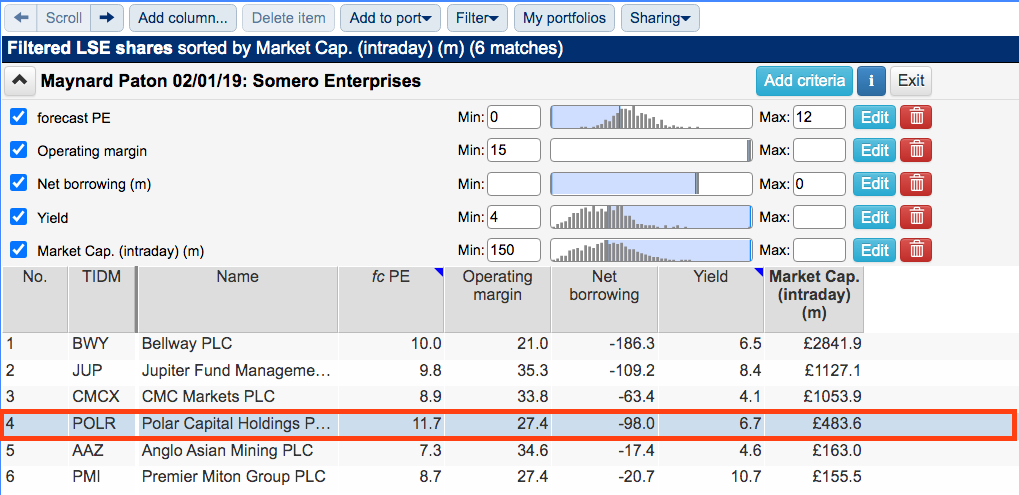
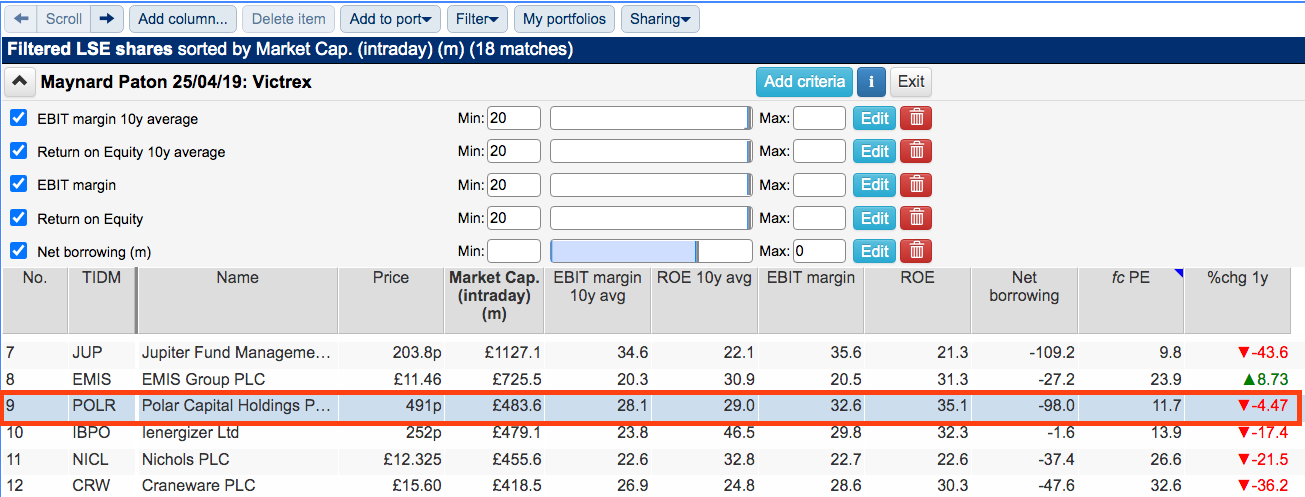
(You can run these screens for yourself by selecting the “Maynard Paton Somero Enterprises: 02/01/19”, “Maynard Paton 25/04/19: Victrex” and “Maynard Paton: 31/08/18 Ramdens” filters within SharePad’s incredible Filter Library. My instructions show you how.)
Polar’s high margins, healthy cash position, decent returns on equity, modest P/E and generous yield are an unusual combination in a market presently bereft of obvious quality bargains.
I will (try to) put my prejudices to one side and take a closer look.
The history of Polar Capital
Polar Capital was established during 2001 and presently manages funds worth £15 billion on behalf of investment trusts, banks, private wealth managers and ordinary investors.
Polar’s funds invest predominantly in equities and cover a broad range of investing themes and geographies.
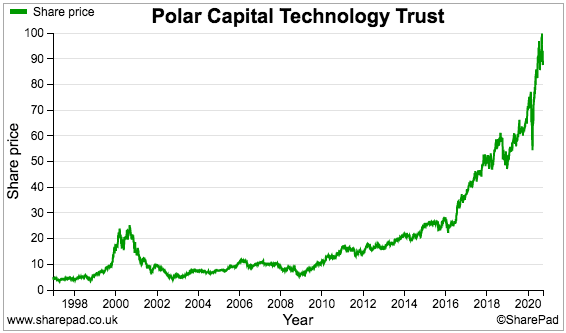
The group is probably best known for its Polar Capital Technology Trust (PCT), an investment trust with a £3 billion portfolio headed by the likes of Apple, Microsoft, Alphabet (Google), Facebook and Alibaba.
Fund manager Ben Rogoff has co-run PCT since 2006 and loyal investors have since seen the trust’s shares rise ten-fold:
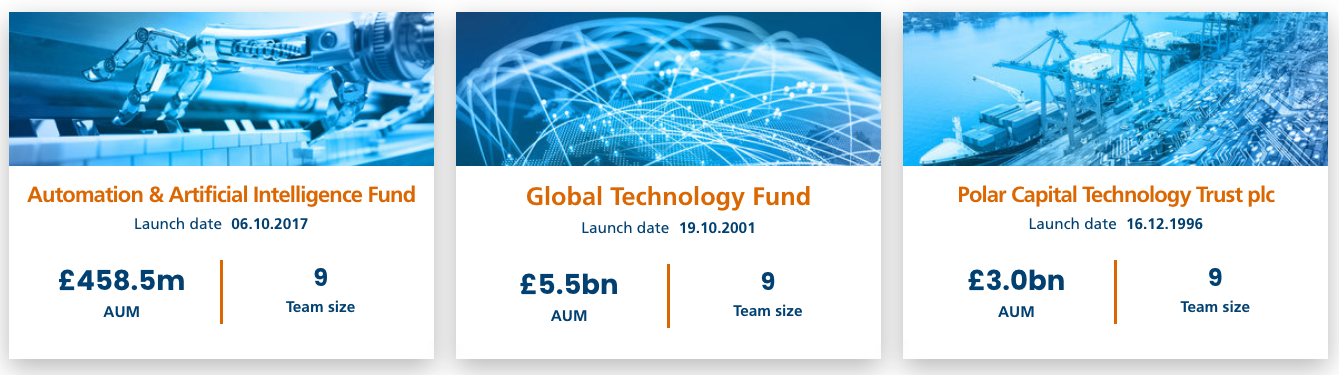
Two other tech funds — Polar Capital Global Technology and Polar Capital Automation and Artificial Intelligence — complement PCT and at the last count this trio of tech portfolios represented 44% of Polar’s entire funds under management.
Second to the technology sector is healthcare, in which 15% of Polar’s funds reside:
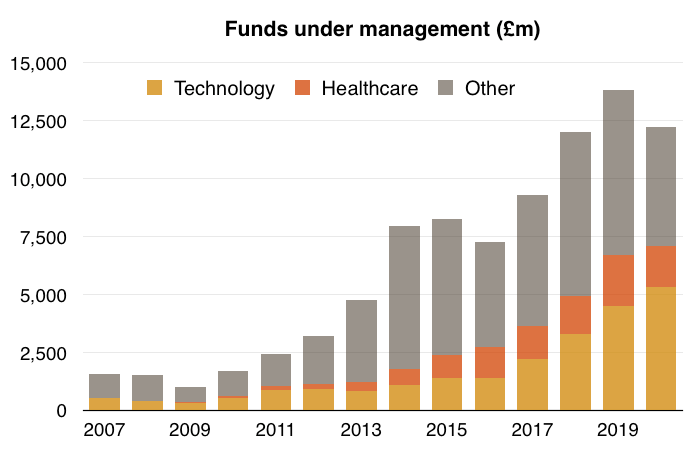
Technology and healthcare have not always been the main themes employed by Polar.
In particular, Japan represented 43% of client funds back in 2014 but less than 2% for 2020. A combination of customer redemptions, poor performance and better returns from other sectors led to that theme’s relegation.
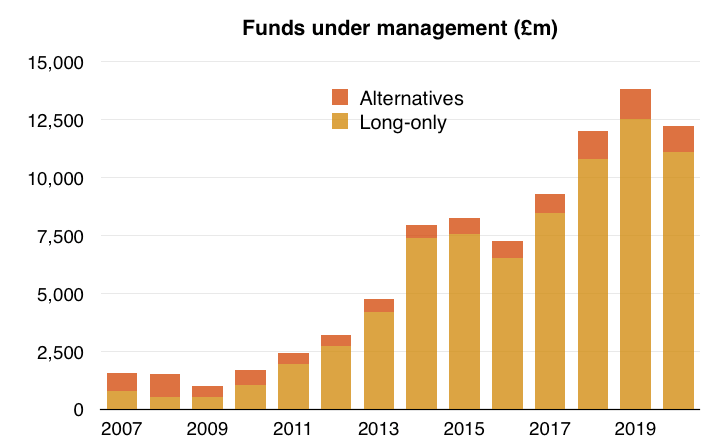
Going further back, hedge funds (described as ‘alternatives’ by Polar) have also diminished in importance.
Representing two-thirds of Polar’s funds in 2008, the long/short strategies never regained investor interest following the banking crash. Polar has since focused mostly on conventional ‘long-only’ portfolios:
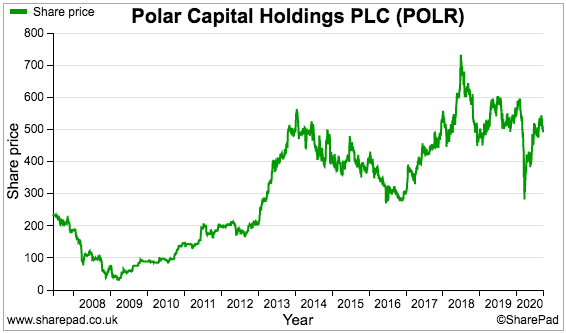
The banking crash provided a baptism of fire for Polar following its 2007 flotation. The shares were priced initially at 190p and two years later had sunk to less than 40p:
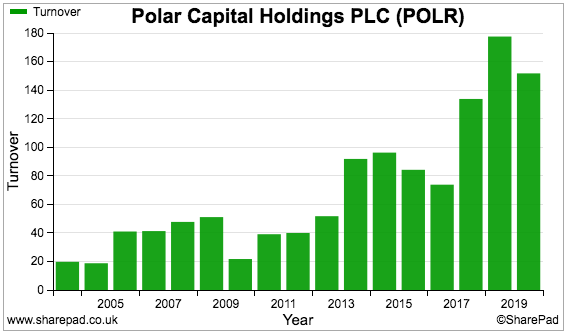
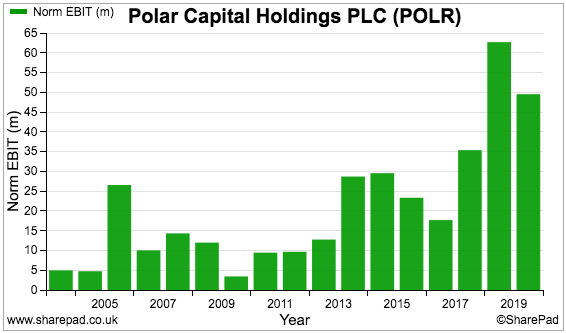
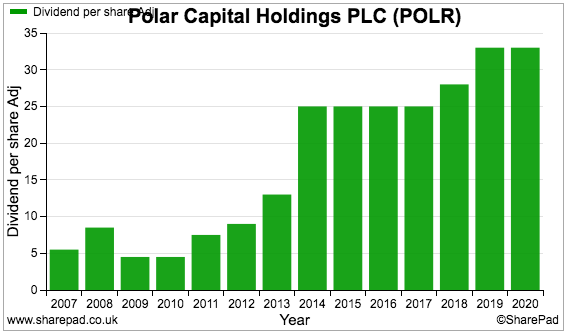
Although revenue collapsed 60% during the banking crash, the business remained profitable and even continued paying a dividend:
Let’s now check on Polar’s funds.
Fund performance
The fund-management industry has an irritating habit of fudging performance statistics. Results presentations are unfortunately afflicted with the same drawback.
‘Survivorship bias’ is the issue. Duff funds are eventually closed or merged to leave only the best for the City powerpoints to showcase.
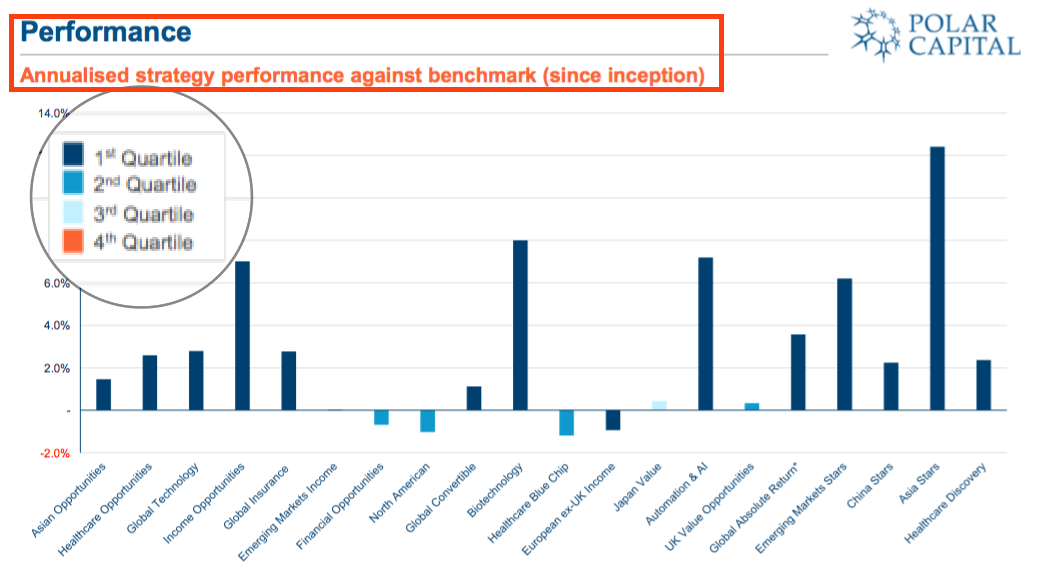
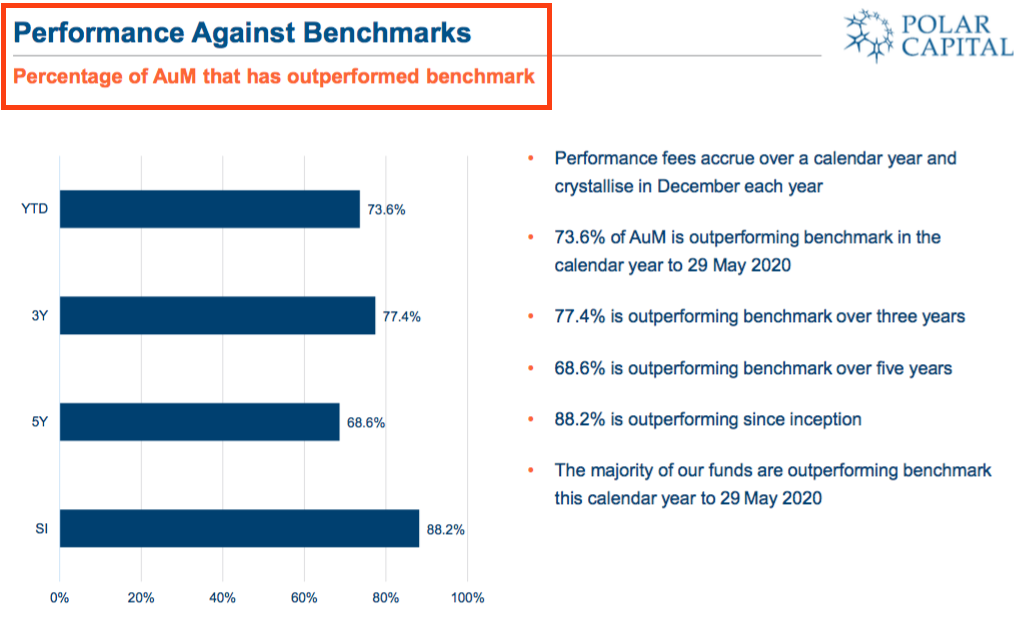
The slides below from Polar’s latest presentation suggest the majority of funds have been outperforming strongly:
Investors must double-check whether such performance claims are genuine. Polar regularly reconciles fund movements and discloses the amount added (or lost) due to investment returns:
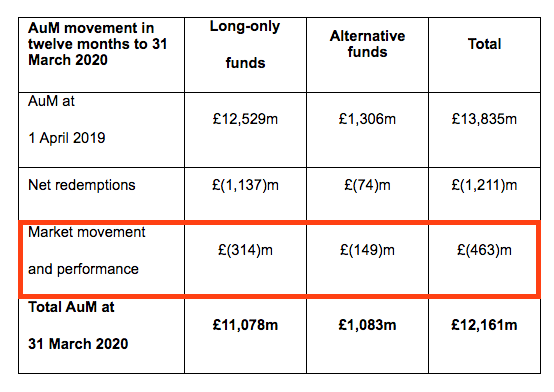
My spreadsheet below shows the aggregate returns from Polar’s long-only and alternatives funds. The performance of the FTSE 100 (with dividends reinvested) is given for extra perspective:
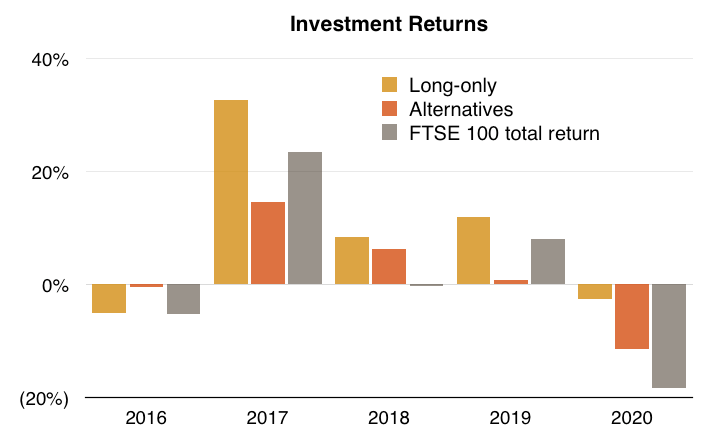
Polar’s long-only funds collectively recorded a 49% investment gain during the five years to March 2020, versus 8% for the alternatives and 3% for the FTSE.
The long-only funds did very well during 2017 because they were invested mostly in overseas stocks as sterling weakened significantly following the Brexit vote.
Mind you, the long-only funds beat the FTSE 100 during 2016, 2018 2019 and 2020 as well, so Polar’s stock-pickers do appear to have some talent.
One irony of the better long-only performance is the greater amount of new client money flowing into the lower-performing alternatives.
The red blocks in the spreadsheet charts below represent net client money entering or exiting Polar’s funds:
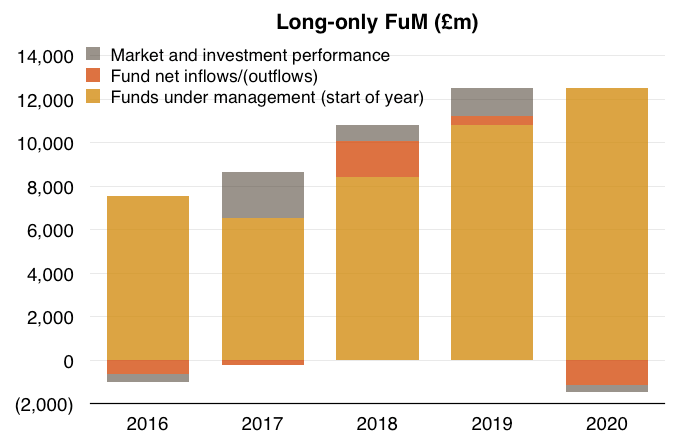
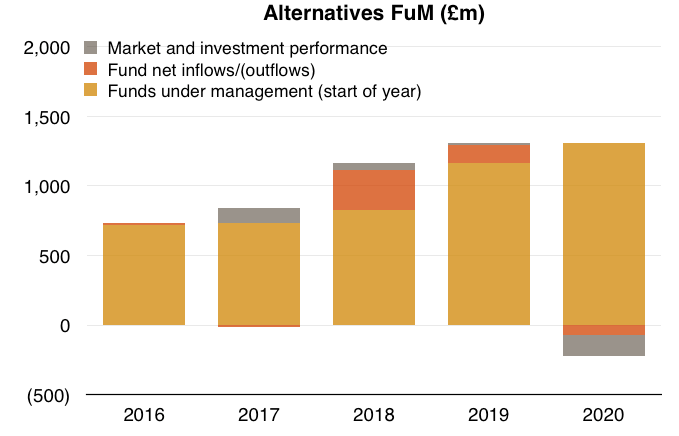
I calculate the long-only funds have attracted only £93 million of net new money during the last five years, with the alternatives attracting £344 million.
We should also investigate the relative performance of Polar’s sizeable technology funds, as problems there could have a disproportionate impact on earnings.
SharePad can easily compare Polar’s tech portfolios with an appropriate tracker alternative.
A Nasdaq 100 exchange-traded fund — which is dominated by the likes of Apple, Amazon, and so on — seems as good a benchmark as any to employ:
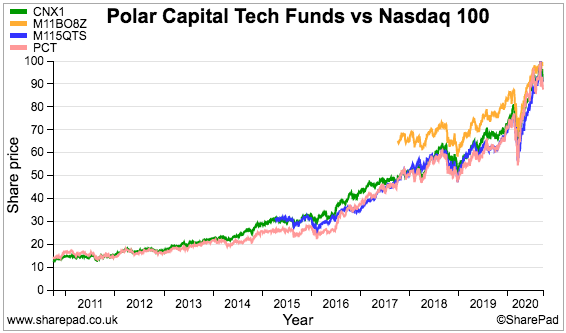
(Apologies for the messy chart above. The green line represents the Nasdaq 100, the pink line represents the Technology Trust, the blue line represents the Global Technology portfolio while the orange line is the Automation and Artificial Intelligence fund.)
The converging chart lines and data in the table do not suggest Nasdaq-trouncing returns from Polar’s tech stock-pickers.
Indeed, holders of the Technology Trust may wish to ponder whether the fund’s 0.93% ongoing charge provides better value than the 0.33% total expense ratio of the Nasdaq ETF.
Polar Capital’s SharePad summary
Polar’s SharePad Summary is shown below:
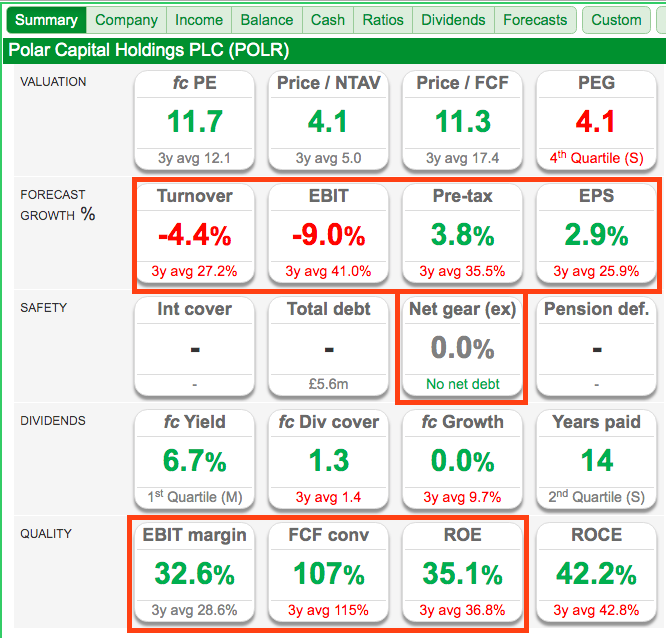
I see these points of interest:
1) Revenue, profit and EPS show mixed progress for 2021 (second row)
2) No net debt (third row), and;
3) High margins, impressive cash conversion and robust equity returns (fifth row);
Let’s start with cash conversion.
Cash flow, options and buybacks
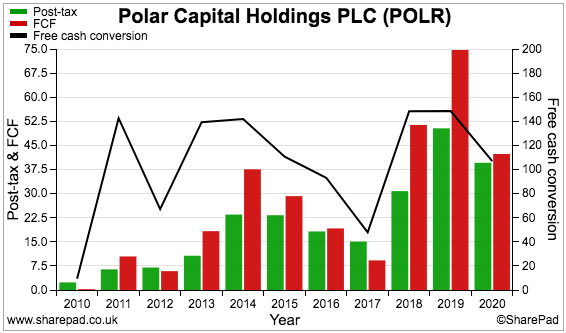
Polar’s SharePad Summary showed a super 107% of earnings converting into free cash.
Sure enough, the company has converted more than 100% of post-tax profit into cash flow during the last few years:
SharePad’s Cash tab reveals ‘Other (operating)’ to be significantly assisting Polar’s cash conversion:
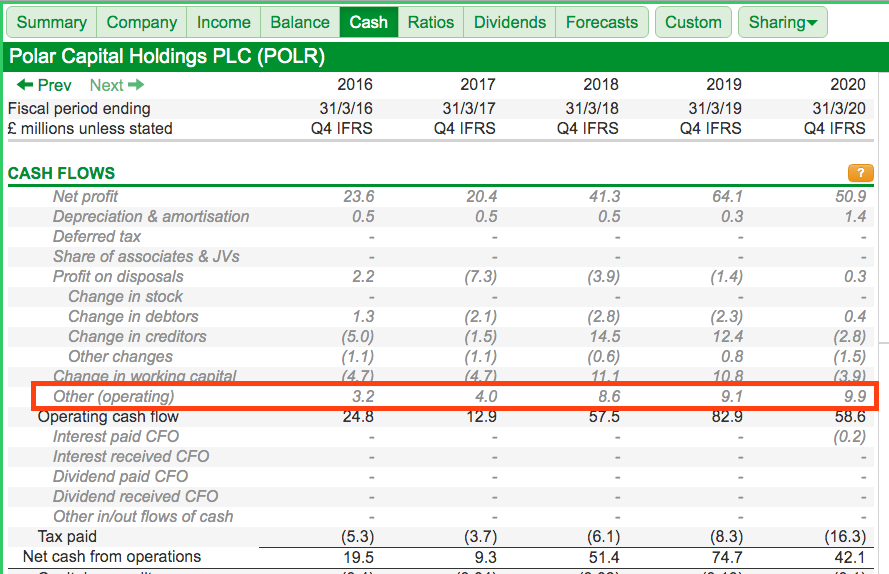
Large numbers within this ‘Other (operating)’ entry always require double-checking to understand what is going on in the accounts.
Past annual reports reveal ‘Other (operating)’ to be mostly share-based payments:
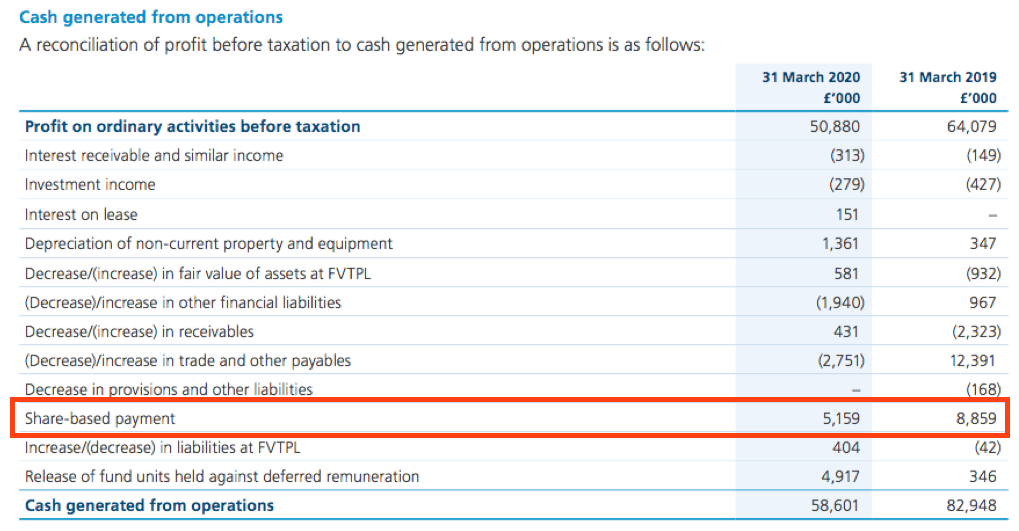
Share-based payments are a charge against earnings and represent the theoretical accounting cost of a company’s option scheme.
(The actual cash cost of the scheme might be completely different. Indeed, the cash cost will be zero if the company is happy to let options convert into extra shares and ‘dilute’ existing shareholders.)
Aggregate share-based payments during the last five years came to a sizeable £30 million.
Further down the Cash tab we find Polar’s share buybacks. These total £27 million over the last five years:
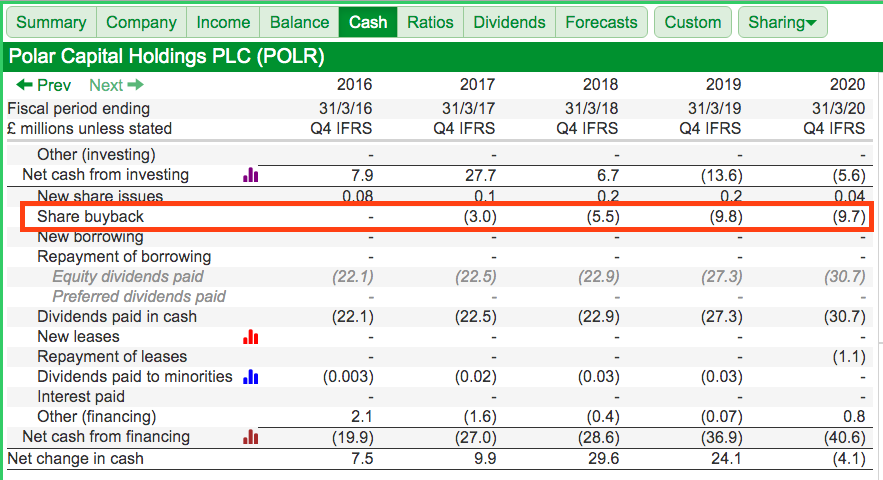
Polar’s last results said these buybacks relate to an Employee Benefit Trust (EBT):
“During the year the Group spent £10.0m (2019: £10.0m) to fund the EBT in buying shares in the Company at an average price over the year of £5.50.”
Polar’s buybacks are therefore a mechanism to limit the dilution from its option schemes.
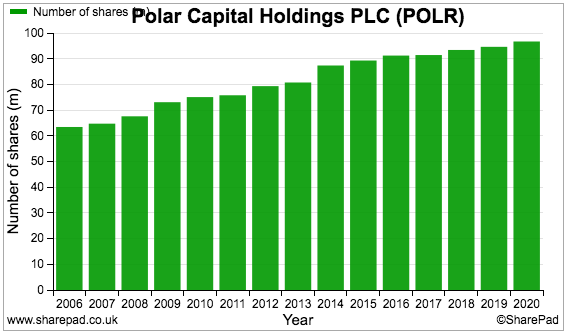
Note that the share count has still increased by 6% since 2016, while a lack of buybacks allowed the share count to balloon 36% between the flotation and 2016:
Alongside a standard option plan is some sort of convertible preference-share scheme and a nice 12%-of-profit LTIP bonus pool:
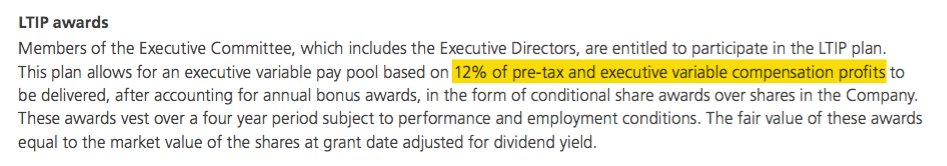
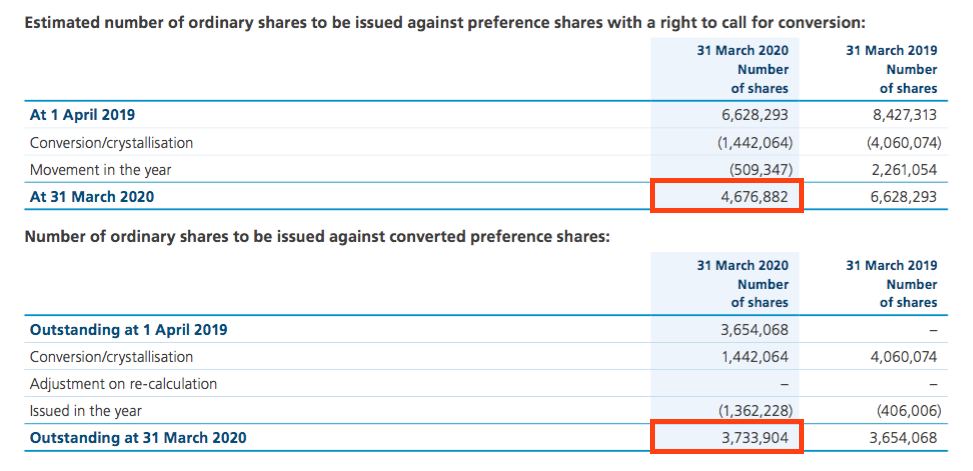
You don’t need to be a qualified remuneration consultant to work out how those arrangements are likely to affect the share count.
Employees, pay and cash
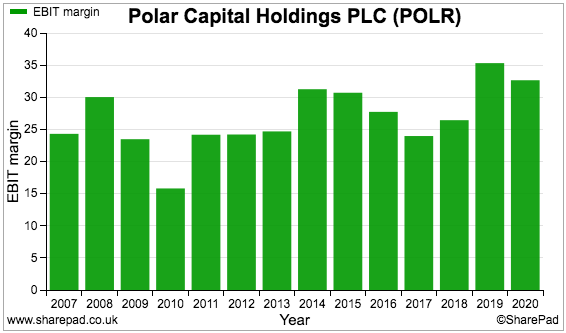
Despite the various remuneration schemes, Polar’s employees do leave some fees for shareholders to enjoy. The proportion of fees left over as profit has often topped 25% and surpassed 30% during 2019 and 2020:
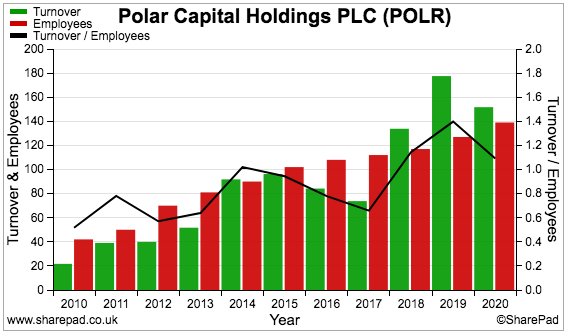
I am impressed by Polar’s employees each generating average revenue of £1 million. SharePad ranks Polar high on that measure:
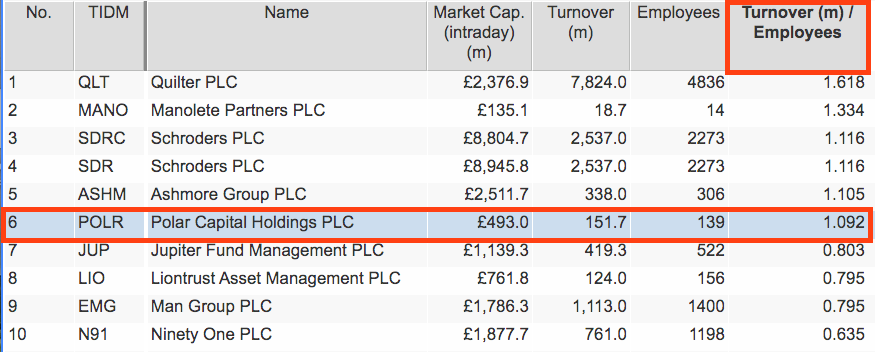
Revenue per employee is influenced by Polar’s performance-related income, which can fluctuate significantly from year to year. However, the measure’s general trend over the last decade is positive:
Just so you know, Polar’s 141 employees cost the firm a total £69 million during 2020 — or a mighty £487k per head. The chief exec took home £745k.
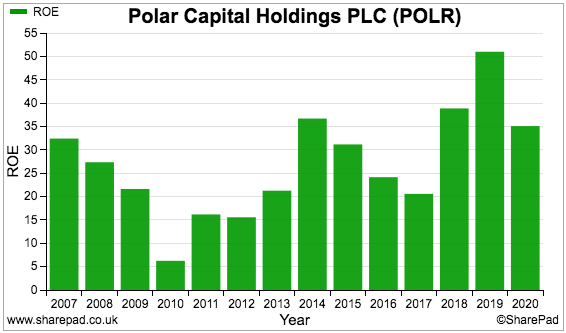
Elsewhere around SharePad, we can see return on equity levels have typically exceeded 20%:
The equity base is comprised mostly of cash and investments, which have piled up nicely over time:
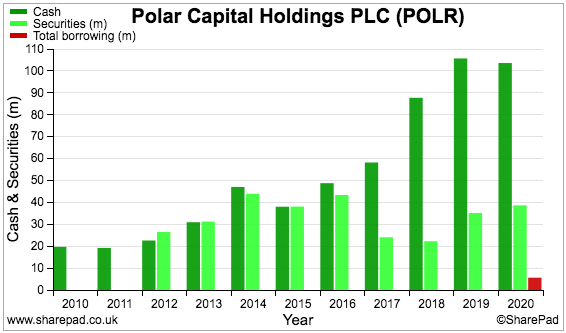
(The small amount of debt relates to lease obligations, which following IFRS 16 are now classified formally as borrowings).
You need to be careful with cash and investments held by fund managers. Some of the cash will be required for regulatory purposes and some of the investments may in fact be owned by customers.
Polar’s disclosure is pretty good. The annual report reveals regulatory capital to be £20m, while cash of £3m is held by an employee trust, investments of £8 million relate to staff remuneration and investments of £3 million are owned by clients.
We end up with ‘surplus’ cash of £84 million alongside investments — all of which are ‘seed’ investments — of £30 million. The £114 million total represents almost a quarter of Polar’s £490 million market cap, although how much of the cash and investments could be returned to shareholders is hard to say.
Most fund managers carry significant ‘surplus’ cash, and these balances may not be earmarked for extra dividends — but instead be required to reassure clients that the lights will be kept on during prolonged bear markets.
Forecasts, valuation and summary
SharePad offers the following forecasts:
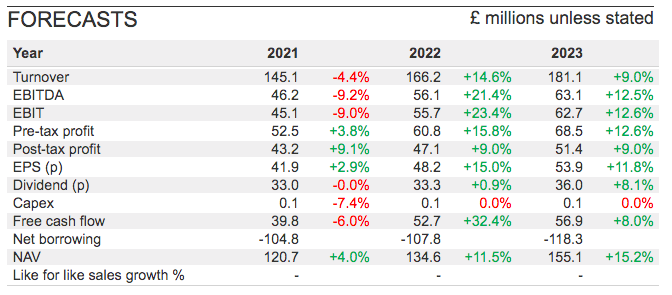
The City consensus expects double-digit growth during 2022 and 2023, although I have never placed much emphasis on broker projections within this sector.
Polar’s revenue, profit and dividend are all inherently linked to the value of its funds, which dictates the level of the fees collected and naturally fluctuates with the markets
All we know for sure is Polar’s funds rebounded strongly during April, May and June following the March crash:
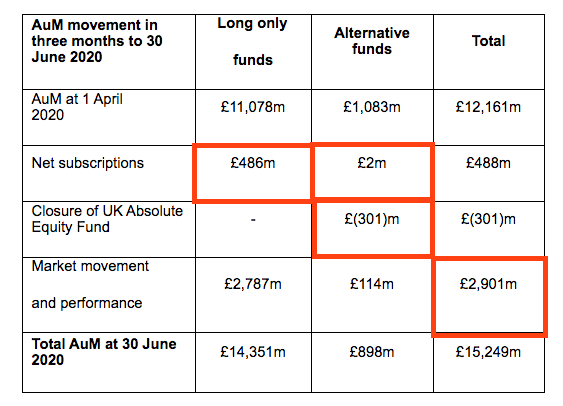
I suspect most of the £486 million injected by clients into the long-only strategies found its way into the technology and healthcare funds. Note the lacklustre £2 million of new money for the alternatives, and the fund closure.
Polar’s P/E of 12 and yield of 6% do not seem expensive, especially as total funds last stood at a record £15 billion.
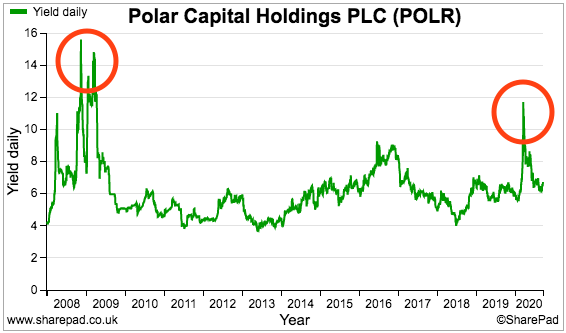
That said, market panics can leave the shares trading at single-digit multiples and double-digit yields:
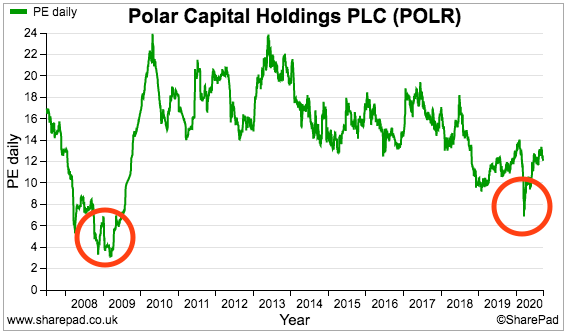
A share-price re-rating will probably require a notable step-change to the amount of new client money garnered each year.
Mind you, the net £93 million attracted to the long-only funds during the last five years seems very beatable to me…
…especially given technology and healthcare now represent more than 60% of client money and may well offer ‘pandemic-proof’ qualities.
Polar has not entirely ridden my prejudices against the sector — in particular, the tech funds do not seem much better than a Nasdaq tracker while the hedge funds have barely outpaced the FTSE.
But Polar’s clients may be very satisfied with their returns, in which case fans of the sector and/or smaller income shares may wish to study the company — and those remuneration schemes! — in more detail.
Until next time, I wish you safe and healthy investing with SharePad.
Maynard Paton
Disclosure: Maynard does not own shares in Polar Capital.
This article is for educational purposes only. It is not a recommendation to buy or sell shares or other investments. Do your own research before buying or selling any investment or seek professional financial advice.


