
It’s nice to be back writing some articles for SharePad. As some of you may know, I worked for ShareScope between 2014 and 2018 and helped to design many of the financial analysis features that are in the SharePad software.
I remain a very happy user of SharePad today and use it extensively for my writing work and my own personal investing.
During my early days at ShareScope, I wrote a step-by-step guide for financial analysis which is still on the website today. Most of it was written before SharePad was launched, so I am now back to write a series of articles about how an investor or analyst can use the tools available to help them research companies and identify potentially good investments.
In many ways, these short articles are intended to be an updated practical version of the step-by step guide using SharePad.
I hope you find them useful.
Why ROCE is one of the most important financial ratios
Investing should be as simple as possible. In so many ways it is all about interest rates.
Just as many of us might look for a savings account with the highest or high rate of interest (when such things existed), it makes sense to look for companies that generate high interest rates as well.
ROCE is a measure of a company’s interest rate. It compares its operating profit with the money invested (capital employed) used to generate that profit.
The higher the level of ROCE the more profitable a company is. Many leading investors seek out companies with a high and sustainable ROCE or ones that they think will eventually have a high ROCE.
Operating profit is a very easy number to find. Calculating capital employed is more involved and open to interpretation.
SharePad calculates capital employed in the following way:
Capital Employed = Total Assets – Current Liabilities + Short term debt (including lease debt)
An alternative way to calculate it which gives the same number is:
Capital Employed = Total Equity + Total Debt + Other long-term liabilities
Some people net off cash balances but I find it is more prudent not to as year end cash balances may not be representative of cash throughout the year. It may be temporary because a company hasn’t paid one of its suppliers and this is already netted off in current liabilities. Deducting cash may therefore be double counting.
You can calculate ROCE using opening, closing or average capital employed. It’s up to you but whichever method you choose, stick with it.
SharePad calculates ROCE by dividing the company’s normalised operating profit (or EBIT) by the average of the last two year’s capital employed.
Operating margin, capital turnover, ROCE and ROOCE
One of the reasons why ROCE is such a powerful ratio is because it can be broken down into its constituent parts. You get the same answer by taking a company’s operating margin by its capital turnover ratio (which is revenues divided by capital employed)
ROCE = operating margin x Capital Turnover
ROCE measures the return based on all the capital or money that has been invested in a business. Sometimes this can include substantial amounts of goodwill paid on acquisitions (goodwill represents the excess paid for a company above its net asset value).
Lots of goodwill can depress ROCE and mask a very profitable business that is underneath. To avoid missing these businesses you can calculate the return on operating capital employed or ROOCE for short. To do this in SharePad, just select the ROCE excluding goodwill option when selecting a data field.
These days, ROOCE is my go to measure for identifying potential investment ideas when just looking at numbers.
Using ROCE in SharePad
There are a number of ways you can look at ROCE in SharePad:
- Columns in a list.
- A custom financial data table that you can make yourself.
- Financial charts.
Here I am using columns in a list to look at some electrical engineering and industrial businesses which tend to score very highly when it comes to ROCE.
This tells me the ratios for the companies based on their last reported results. Once I have this list setting, I can apply it to any company or companies in SharePad which saves huge amounts of time.
As you can see, there are some impressive ROCE and ROOCE numbers here.
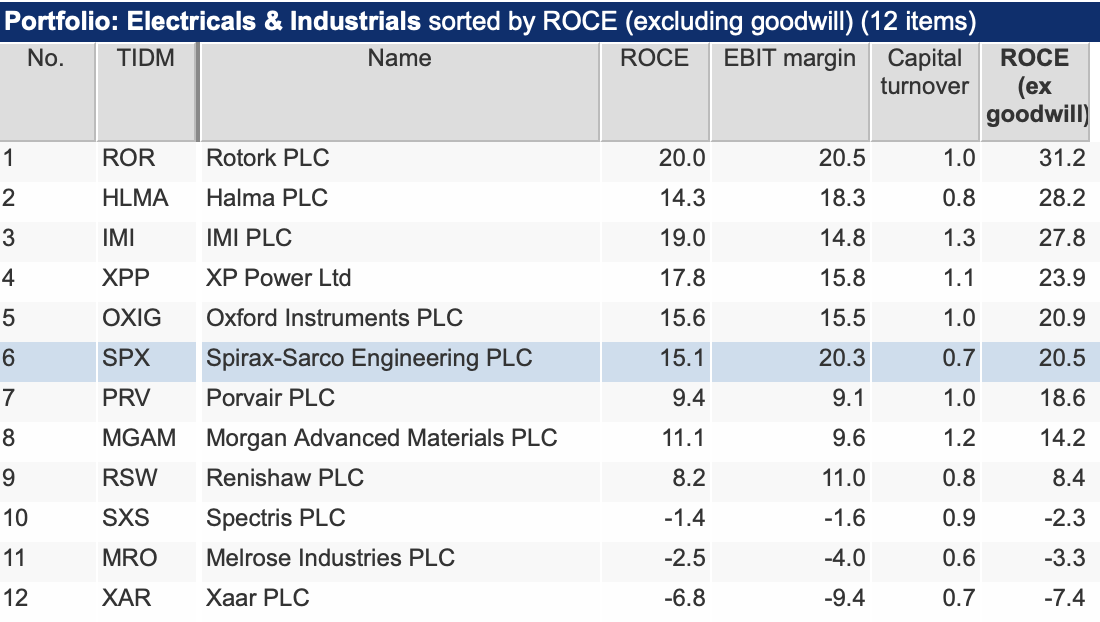
However, you should never look at a financial ratio in isolation. It pays to look back at least 5 years and preferably longer to include recessions and look at how resilient a company is.
There are a number of ways you can do this.
One way is to create a custom financial table with the data fields in it. Here’s Spirax-Sarco going back to 2014. I can go back to the early 1990s if I want to, given that there’s so much data in SharePad.
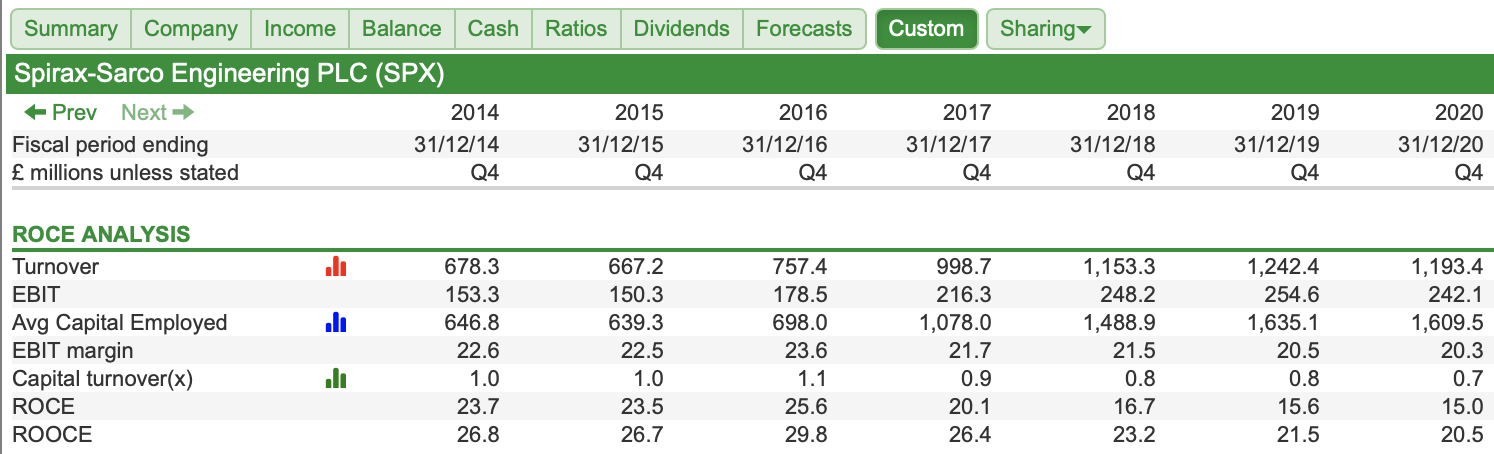
We can see here that Spirax-Sarco’s ROCE and ROOCE has been a downwards trend. Capital turnover has come down a lot and this can be explained by acquisitions. ROOCE is also down but still at a very high level. You need to find out what’s causing it. Is it a temporary blip, a change in business mix (perhaps caused by the acquisition of a less profitable company) or is something else going on?
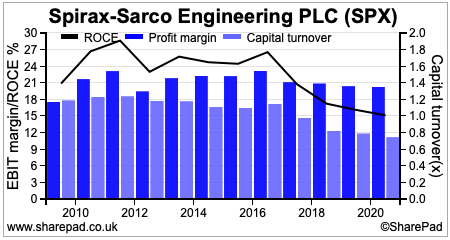
One of the great features in SharePad is its financial charts. These allow you to chart ratios and get a very clear view of what has been happening.
Here’s the custom financial table replicated as a financial chart.
Now let’s look at Spirax’s Sarco’s ROOCE over time.
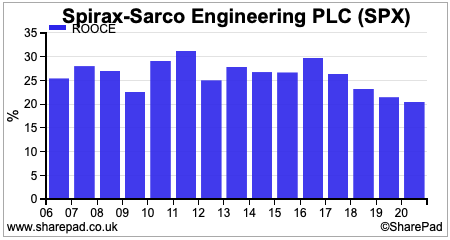
Look at how resilient it has been over time as it has stayed at a high level despite its recent downwards trends. This kind of chart would definitely get me interested in a business.
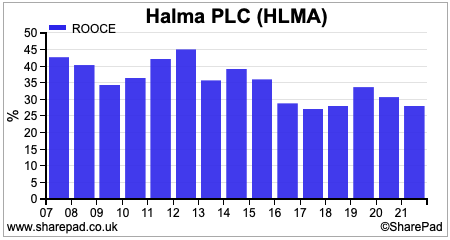
Halma’s ROOCE chart also looks attractive.
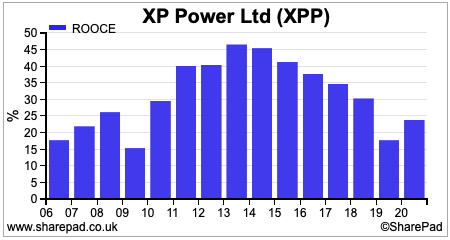
XP Power doesn’t look too bad either but has been a bit more volatile, especially in the 2008/09 recession and 2020 which might be telling you it is not as resilient as Halma or Spirax-Sarco.
Things to consider
ROCE is a very powerful way of weighing up a company but it is rarely a good idea to invest in a share based on this number alone.
- Understand how a company makes its profits – the real business behind the numbers. What is happening to its competitive position?
- Look at the trend in ROCE.
- Beware of temporary peaks and troughs in ROCE that come with cyclical businesses.
- Make sure that ROCE is not flattered by old assets that will have to be replaced and reduce ROCE.
- Try and understand how changes in business and profit mix can change ROCE.
- Be wary of companies with a high ROOCE but a very low ROCE. This is a sign that a company has paid too much for an acquisition which may disappoint investors.
- Be wary of a high ROCE caused by low investment and a lack of growth. Profits growth at a high ROCE is what generates higher share prices over time. Without future growth, a business with a high ROCE can be a bad investment.
- Look at the drivers of ROCE – margins and capital turnover. High margins can sustain ROCE if capital turnover is collapsing. If margins then fall, ROCE will collapse also.
Phil Oakley
Co-founder of Invest-ability – an investment analysis and research website for private investors. Find more content, insight and the latest Quality Shares podcast at invest-ability.co.uk
This article is for educational purposes only. It is not a recommendation to buy or sell shares or other investments. Do your own research before buying or selling any investment or seek professional financial advice.


Hi Phil,
Good article.
I see that you are highlighting Halma and Spirax Sarco which have featured in my shortlists recently for entirely different reasons.
My thinking was stimulated by the book ‘100 Baggers’ by Christopher Mayer.
Regards
Colin Farrier
Many thanks.Very detailed .Itend to look at Simply WallStreets assessments.Ican understand these.Are they oversimplified or do you view themsatifactory for financial morons?Robert Henshall?
Great article and reasonably easy to follow, even for an inexperienced investor such as myself. To maximise the learnings I am trying to recreate the custom chart you show. Some of my data is the same but most I get different numbers, such as EBIT and ROCE itself. What are the settings you select?
Could you please tell me where Phil Oakley works now?