

Today I have returned to one of my favourite SharePad screens.
This screen applies two ratios favoured by ‘quality’ investors — operating margin and return on equity (ROE).
The main filter criteria are:
1) An operating margin (latest and 10-year average) of 20% or more, and;
2) An ROE (latest and 10-year average) of 20% or more.
Any business with a margin and ROE consistently above 20% is probably quite special.
To narrow the field down further, the screen also seeks companies that carry net borrowings of less than zero (i.e. net cash).
I first used the screen to identify Victrex and then shares such as Abcam, Jupiter Fund Management and Dotdigital.
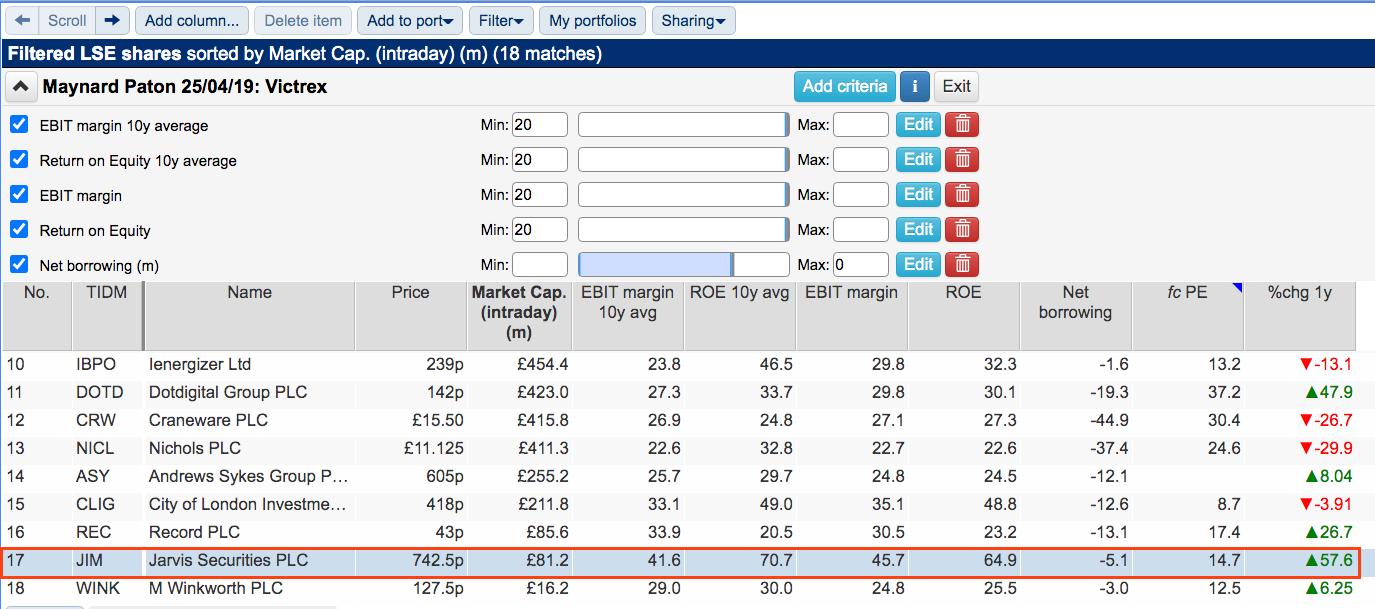
I ran the screen the other day and found 18 matches:
(You can run this screen for yourself by selecting the “Maynard Paton 25/04/19: Victrex” filter within SharePad’s unbelievable Filter Library. My instructions show you how.)
The 18 matches contained a bevy of other companies I have studied for SharePad, including Rightmove, Games Workshop and Craneware.
I decided to look at the smaller shares in the list and plumped for Jarvis Securities.
Jarvis’s margin and ROE histories are displayed below:
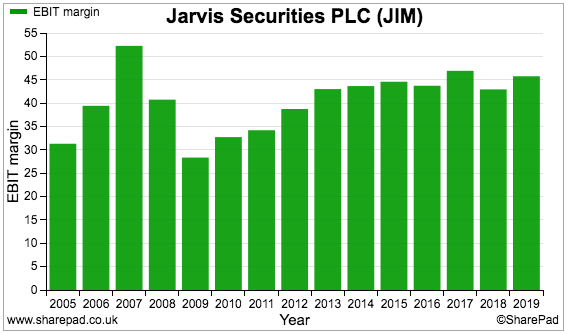
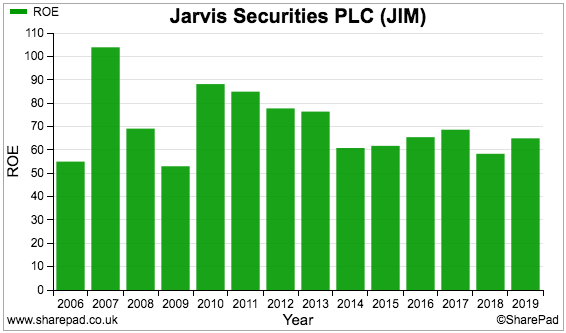
The operating margin has always exceeded 25% and occasionally topped 40%. ROE meanwhile has never dropped below 50%. Those performances are amazing and the company thoroughly deserves closer inspection.
The business of Jarvis Securities
Jarvis Securities was established during 1984 and was initially — at least according to the company’s chairman — a “private investment club”.
After evolving into financial advisory work, the business today runs various execution-only share-dealing services. Back-office admin is also supplied to other stockbrokers.
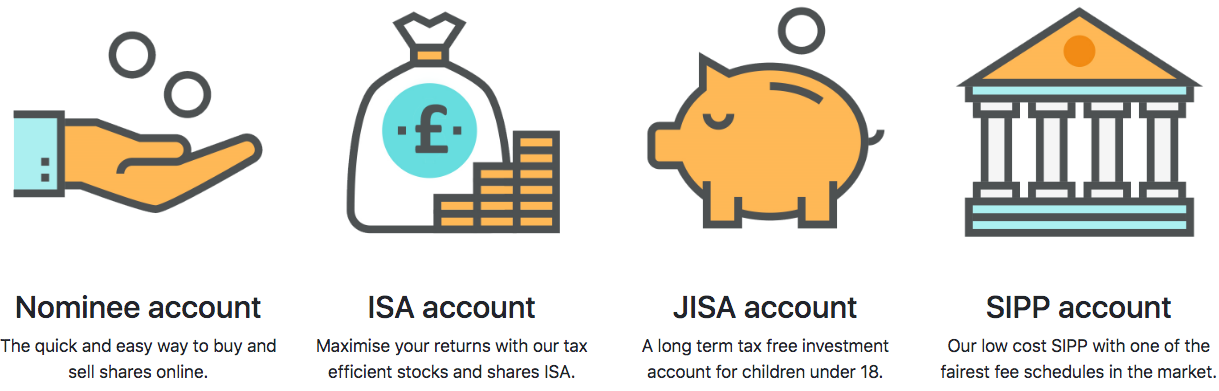
Jarvis is perhaps best known for operating x-o.co.uk (‘XO’), a website that offers “a simple, low cost, no fuss way to buy and sell shares online”.
XO charges just £5.95 per trade, regardless of size or frequency, while annual ISA administration fees are zero. XO’s costs are all listed below:
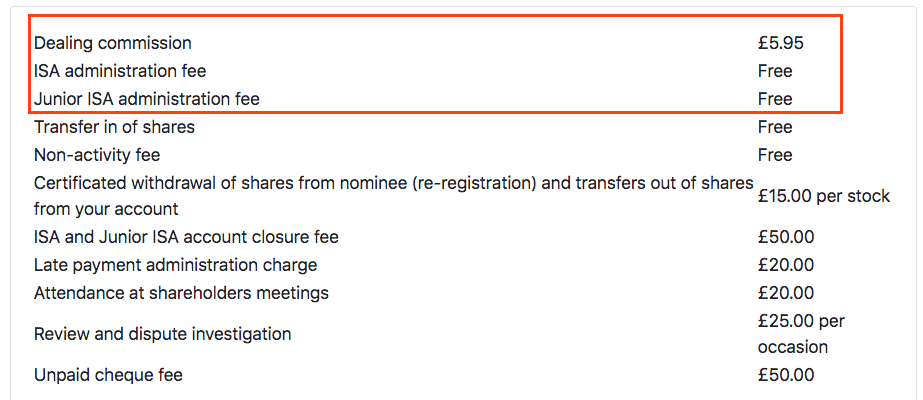
I may have to switch brokers after discovering these charges.
I currently trade shares using Youinvest (owned by AJ Bell) and Selftrade (owned by Equiniti), where standard dealing commissions are £10 and £11 respectively.
Both Youinvest and Selftrade apply annual ISA charges, which can be up to £30 at the former and possibly* £70 at the latter. (*I say possibly as Selftrade’s fee structure is too complicated to explain here).
For further comparison, Hargreaves Lansdown’s standard dealing commission is £12 a trade and its ISA fees can be up to £45 a year.
Note that XO does have limitations. In particular, the website does not deal in overseas stocks nor open-ended funds.
Cost of course is one thing, while service is quite another. What you can save on dealing fees can be lost on poor execution. Trustpilot marks XO 3.2 out of 5 and presents some very mixed reviews:
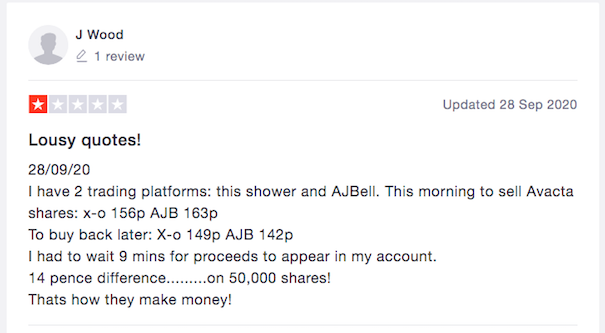
AJ Bell scores 4.4 out of 5 on Trustpilot, with Hargreaves scoring 3.4 and Selftrade receiving 2.9. I suppose only by opening an account and starting to place trades do you find out how good (or bad) a broker really is.
Other dealing sites operated by Jarvis include sharedealactive (£9.50/trade), sellmysharecertificates (£25/trade) and Dial-n-deal (£27.50/trade). The company also supports the share-trading service for the Yorkshire Building Society.
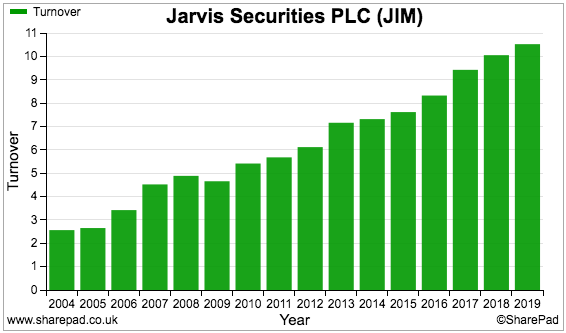
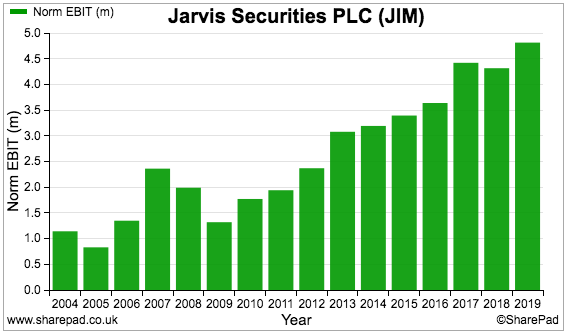
Jarvis joined AIM during 2004 and has since delivered very respectable progress without any acquisitions.
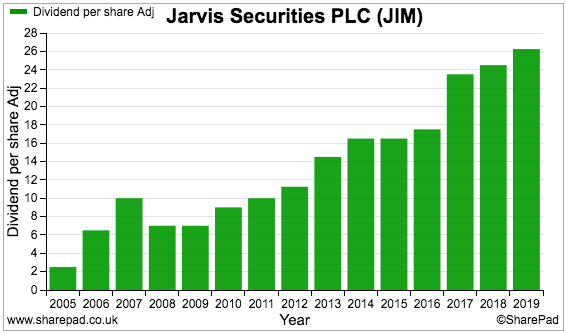
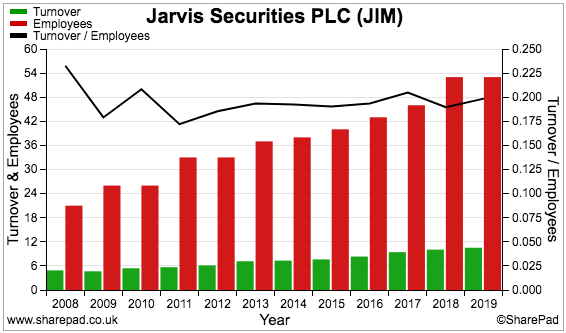
Revenue, profit and the dividend have all moved higher over time, although the banking crash of 2008/09 understandably caused profits to slide and the dividend to be cut:
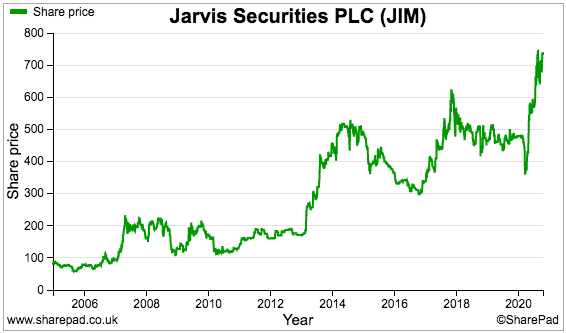
The share price has reflected the group’s expansion, having rallied from the initial 83p admission price to a recent 743p to support an £81m market cap:
Interest income
Jarvis’s annual report provides a reminder that smaller companies can disclose a lot less information than larger companies.
In particular, the following charts from Jarvis’s 2019 report irritatingly exclude the Y-axis values:
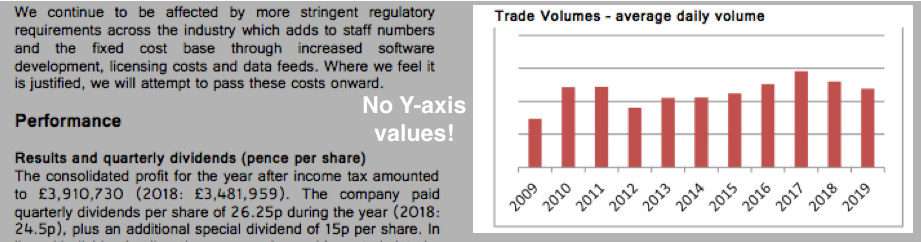
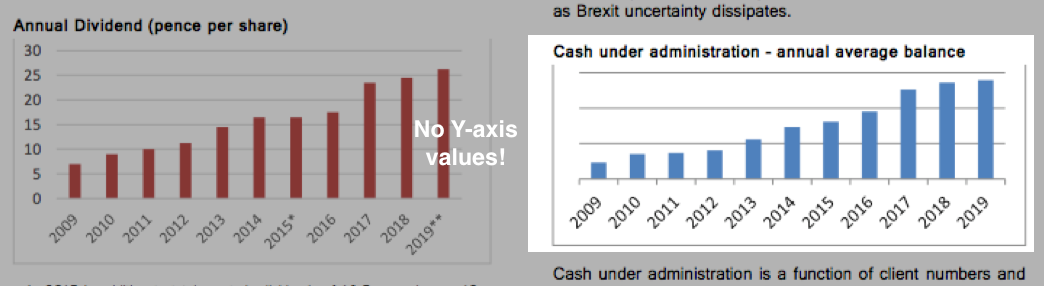
The exclusions are deliberate and very poor form for a quoted business. Jarvis had presented Y-axis values until 2011, then decided investors could do without such information.
The irritating charts show trading volumes and cash under administration, which are important to Jarvis (and its shareholders) because both correlate to revenue and therefore profit.
We can tell from Jarvis’s chart that trading volumes have broadly stagnated during the last ten years. However, cash under administration has advanced significantly.
The 2011 annual report showed cash under administration to be approximately £70 million:
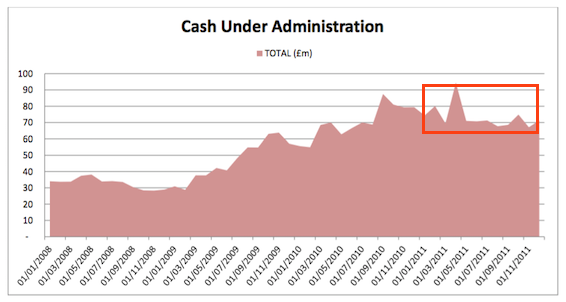
And looking at the subsequent growth within that 2019 chart, client cash balances could now exceed £300 million…
…from which Jarvis seemingly takes the interest all for itself.
The 2019 annual report details the company’s revenue sources:
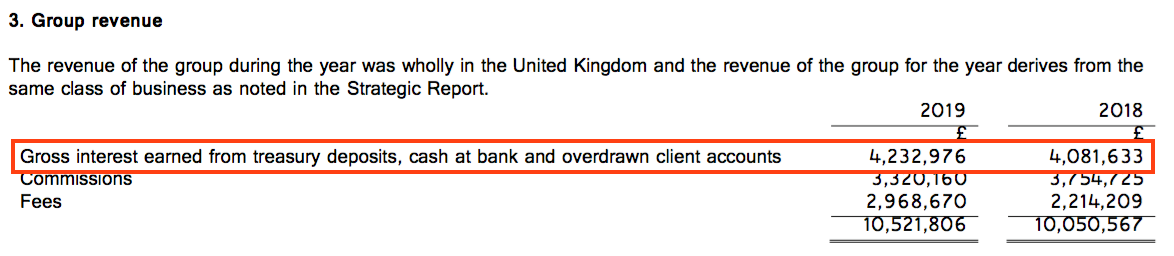
Approximately 40% of revenue has on average been derived from interest earned from client cash balances:
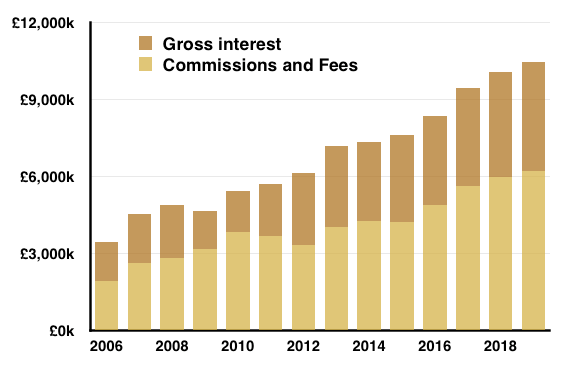
My spreadsheet chart above confirms Jarvis has earned notable levels of interest despite rock-bottom rates — no doubt due to paying little (if any) interest to its customers.
The company does not appear too concerned about the prospect of base rates going even lower:
“The group derives a significant proportion of its revenue from interest earned on client cash deposits and does not have any borrowings. Hence, the directors do not consider the group to be materially exposed to interest rate risk in terms of the usual consideration of financing costs, but do note that there is a risk to earnings.
Given the current Bank of England base rate is near its lowest level since its foundation in 1694, and the business has remained profitable, this risk is not considered material in terms of a threat to the long term prospects of the group.”
I will have to let you decide exactly how Jarvis would cope should interest rates go negative.
Jarvis Securities’s SharePad summary
Jarvis’s SharePad Summary is shown below:
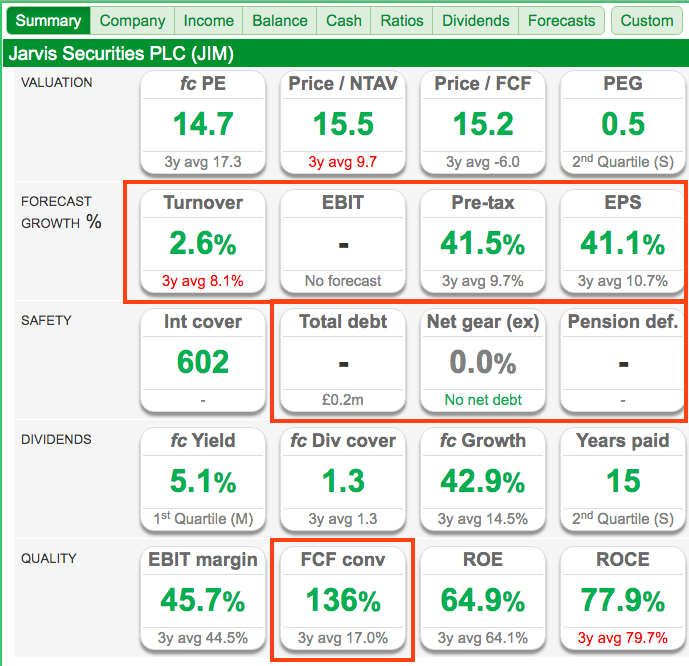
I see these points of interest:
1) Revenue, profit and EPS show positive progress for 2020 (second row);
2) No net debt and no pension deficit (third row), and;
3) Impressive cash conversion (fifth row);
Let’s concentrate first on the cash conversion.
Cash flow, settlements and cash in the bank
Jarvis’s SharePad Summary reveals an amazing 136% of earnings converting into free cash.
However, conversion over time (black line, right axis) has been extremely volatile:
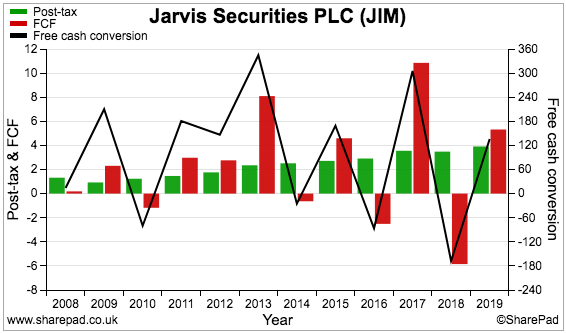
This next chart leads us to an explanation:
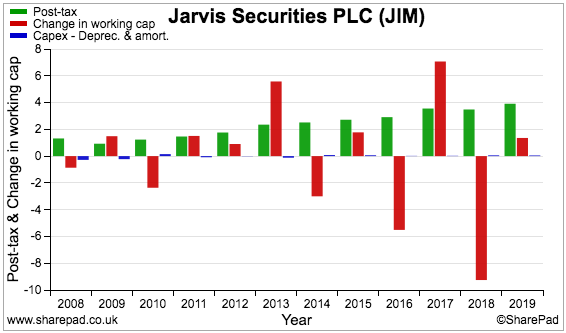
Jarvis’s earnings (green bars) are compared to the additional investment in working capital (red bars) and ‘excess’ capital expenditure (blue bars) — that is, the cash spent on tangible assets minus the associated depreciation expensed against earnings.
Working-capital movements are clearly the issue here.
The annual report is now required to understand what exactly is going on. The relevant notes are shown below:
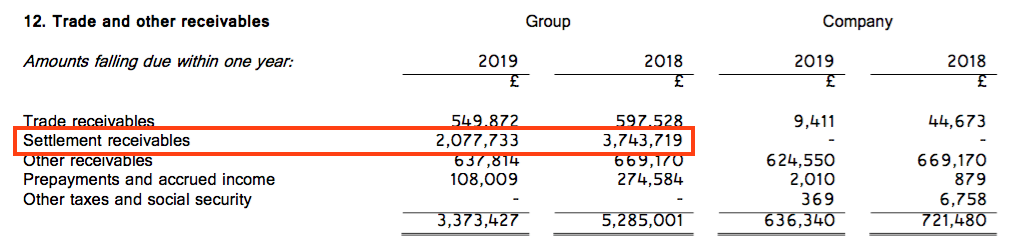
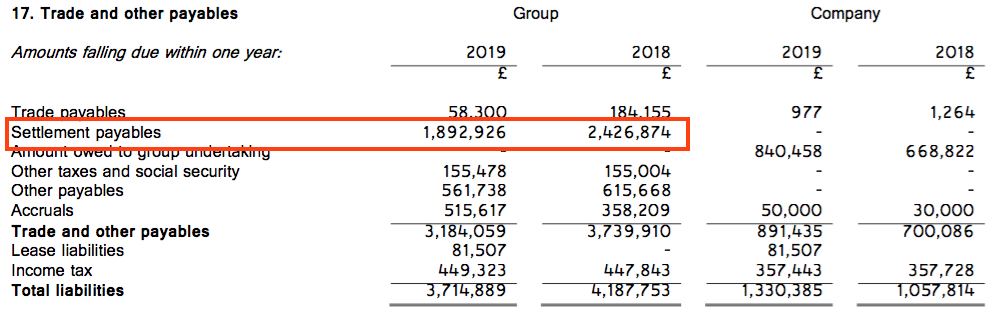
The major working-capital entries relate to ‘settlements’ and the two-day ‘settlement period’ that occurs after a client buys or sells a share.
I guess these settlement entries will always be very unpredictable, given they reflect the outstanding amounts due on one particular day of the year (the balance sheet date, which for Jarvis is 31 December).
While settlement cash-flow has its ups and downs, cash in the bank (none of which is client money) has reassuringly advanced since the 2008/09 market downturn:
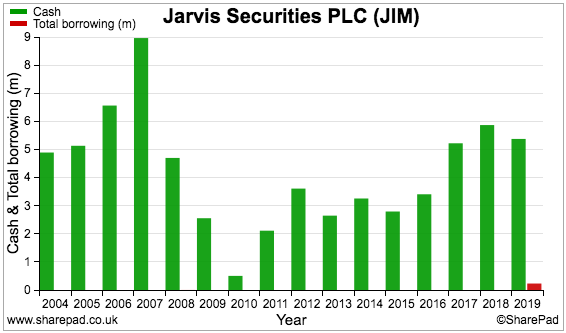
Also reassuring is the lack of debt and the declaration of two significant special dividends (blue bars):
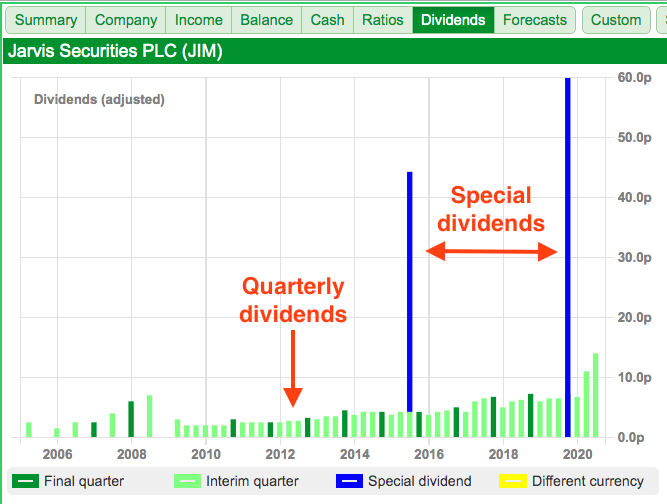
The chart above reveals Jarvis to be one of the very few AIM shares that pays a quarterly dividend.
Management and employees
I am sure the presence of a dominant ‘owner-manager’ has led to Jarvis’s steady track record, cash-flush balance sheet and liking for the occasional special dividend.
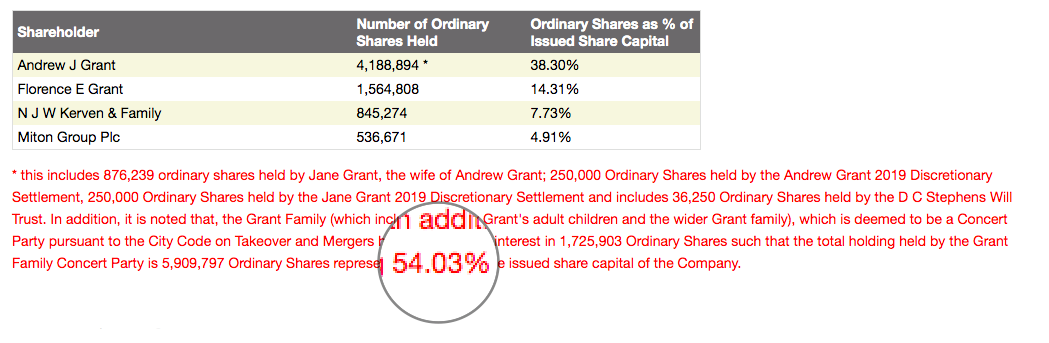
Company founder Andrew Grant runs the group as both chairman and chief executive, and he and his family control 54% of the share count (a stake worth £44 million):
Mr Grant is 61 years old and could remain in charge for another few years.
The annual report gives the impression Mr Grant runs Jarvis just like XO’s dealing service — in a “simple, low cost, no fuss way”. The report’s spartan black and white design is punctuated only by those irritating Y-axis charts exported from Excel.
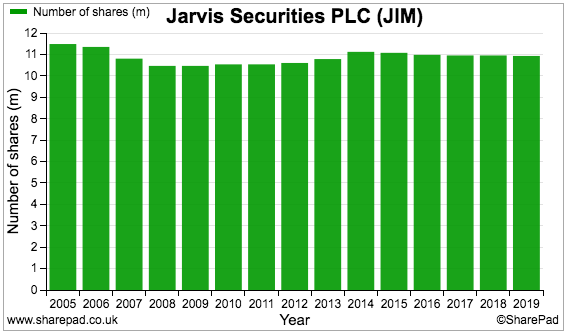
Unlike many other financial-services companies, Jarvis commendably no longer bothers with options and LTIPs. A share-based payment charge was last seen during 2014 and the share count has been kept quite tight:
I dare say the low-cost culture explains why Jarvis can deliver its 40%-plus margin and 50%-plus ROE.
Employees are by far the group’s largest expense, and each employee costs Jarvis a reasonable £38k a year (excluding Mr Grant and his useful £354k annual pay).
Revenue per employee has consistently come in at a very respectable £200k, too:
Forecasts, valuation and summary
Another drawback with smaller companies can be the sparse City forecasts:
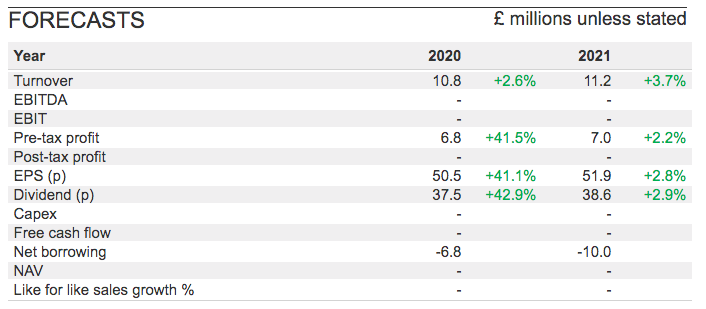
Those projections might well be on the low side. Interim results published during July showed revenue up 31% to £6.8 million and pre-tax profit up 50% to £3.6 million.
Mr Grant encouragingly implied the group was now enjoying some long-awaited economies of scale:
“I believed that the uncertainty between the vote to leave the EU in 2016 and the election at the end of 2019 created an artificially depressed trading environment. So, I am pleased to say that we have now seen a significant increase in trade volumes for which the corresponding increase in revenue has outstripped the increase in the marginal operating costs. As a consequence, the Directors believe the Company is trading ahead of current market expectations.”
Doubling up the first-half performance would give earnings of approximately 53p per share and perhaps a full-year dividend of 35p per share based on the group’s 1.5x dividend-cover policy.
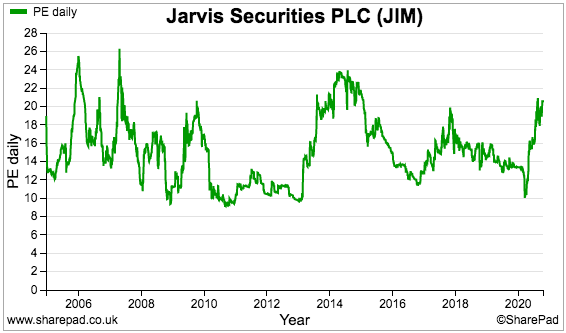
A possible P/E of 14 does not seem expensive, and is towards the lower end of Jarvis’s trailing P/E history:
Talking of P/Es, the annual report contains this peculiar extract:
“The principal measures used by investors to compare and rate publicly traded companies are the earnings per share (EPS) and the relative multiple to these earnings of the current share price (the price earnings or P/E ratio)…
These measures are important to investors and hence need to be given high regard. The board will continue its efforts to maintain the P/E ratio to reflect its belief that Jarvis should have a premium rating to its competitors because of its yield and differentiated business model.”
Boards should really concentrate their efforts on maintaining their businesses and let investors worry about P/E ratios.
I do wonder if Jarvis could one day become a takeover target. Fellow broker Share, which operates The Share Centre, was purchased for £61 million earlier this year to help enhance Interactive Investor’s economies of scale:
“Interactive Investor believes direct to consumer platforms require scale to sustain the level of profitability necessary for significant and ongoing technology investment in customer experience and services. Therefore, there is a strong strategic rationale for consolidation amongst compatible groups.”
Mind you, Jarvis’s immense margin and ROE do not suggest a larger parent is required just yet.
To sum up, I would say Jarvis offers quite a lot to like, although do bear in mind the group’s small market cap, likely weakness during bear markets, the dominant shareholder and those dodgy Excel charts.
Until next time, I wish you safe and healthy investing with SharePad.
Maynard Paton
Disclosure: Maynard does not own shares in Jarvis Securities.
This article is for educational purposes only. It is not a recommendation to buy or sell shares or other investments. Do your own research before buying or selling any investment or seek professional financial advice.


