
Updated: August 2024
In the previous chapter, we looked at how a balance sheet was put together and the numbers that go into it. In this chapter, we are going to take all those numbers from the balance sheet and turn it into useful information for investors.

A company’s balance sheet contains a wealth of information for investors. The numbers within it allow you to calculate a lot of very useful ratios which can reveal a great deal about a company’s finances and whether its shares could end up being a good investment or not.
Calculating ratios – where we divide one number by another number – would take a lot of time if you were doing it by hand and wading through years of annual reports. With ShareScope, all the useful calculations are already done for you. You can look at a particular trend or ratio for a company going back more than twenty years if you want to.
One of the best ways to look at trends in ShareScope is to use its financial charts which can give you a great insight into what has been happening within a business. You will be seeing a lot of these charts in this chapter and subsequent chapters.
However, when it comes to analysing the numbers in a balance sheet always remember what a balance sheet is. It is a snapshot of a company’s financial position at one point in time – usually the end of its financial year or half year.
It is not uncommon for a balance sheet to change very quickly within a few months. For example, debt levels can often be a lot higher during the year than they are at the end of it. This may be because suppliers may have been paid before customers have bought any products or services.
Companies tend to present their year-end balance sheet when they give the most favourable view of their finances – for example, retailers report shortly after Christmas. It’s always worth bearing this in mind.
What to look for when using ratios
Before we get on to calculating some balance sheet ratios, it’s probably a good idea to ask ourselves what you are trying to find out before we start.
As well as interpreting the ratio, I’d suggest you keep a look out for two main things:
- Any big changes in the ratios from one year to the next. Or big changes in the ratios compared with competitors. This might alert you to the fact that something significant is changing for the better or that something is possibly wrong.
- The trends in the ratios over a period of time. So you will be looking for an upwards, downwards or consistent trend. What has happened in the past probably won’t be repeated exactly in the future, but the more you learn about a company’s historical performance the better the investment decisions you will probably make.
Balance sheet ratios
ShareScope will focus on calculating the following types of ratios:
- Liquidity ratios – looking at the ability of a company to pay its liabilities when they fall due.
- Gearing ratios – the amount of borrowed finance as a percentage of shareholders’ or equity finance and as a percentage of all company finance (capital employed).
- Net asset values
- Capital employed
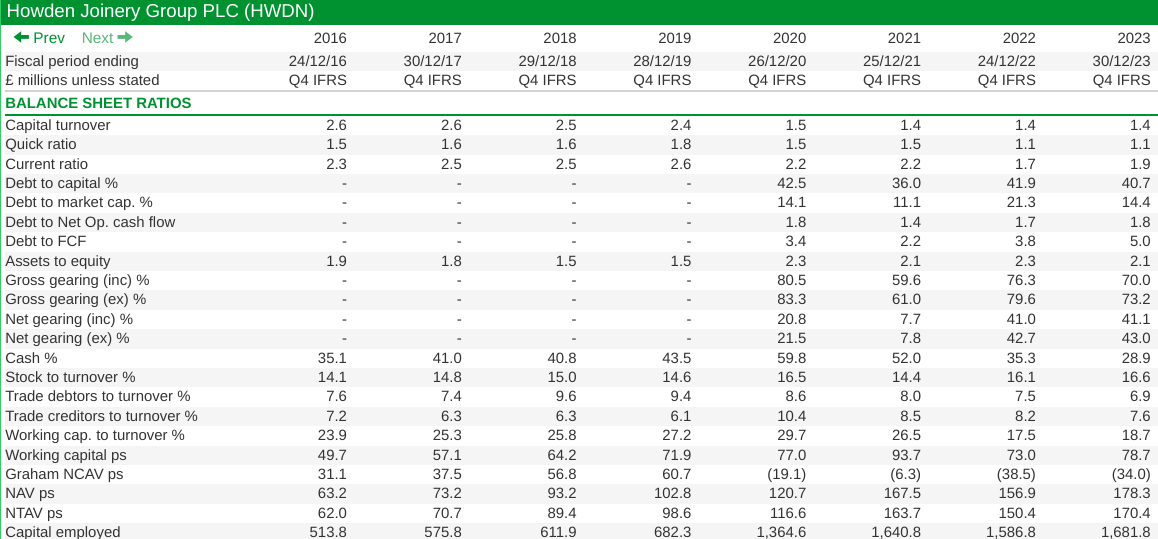
Below you’ll see a view of all the main balance sheet ratios that ShareScope currently calculates. As you can see, there are a lot of them and they are all very useful. If you want to you can calculate your own ratios in ShareScope as well by using any number from a company’s financial statements.
Let’s start by looking at liquidity ratios for Howden Joinery.
Liquidity ratios
Liquidity isn’t a word that most people will use or think about during their everyday lives. If you are new to investing you may even find the word rather confusing. So what does liquidity mean when we are talking about companies?
You might be familiar with the term asset rich and cash poor. This might be used to refer to an old aged pensioner (OAP) who has lived in a house for years which has become very valuable but they don’t have a lot of income and therefore money available to pay the day-to-day bills. You could say that the OAP has a liquidity problem.
Companies can find themselves in a similar position. They can be profitable, have no debts and look financially sound but if they have to pay a bill before their customers pay them then they can get into financial difficulties very quickly. As an investor, you need to find a way of spotting companies in these kinds of situations and stay away from them.
This is what liquidity ratios were designed for – to spot companies that might find it difficult to pay their bills. These are the kind of companies you also might want to avoid investing in.
We are going to look at the following liquidity ratios:
- Current ratio
- Quick ratio
- Working capital
- Stock days
- Debtor days
- Creditor days
- The working capital cycle
Current ratio
This ratio looks at a company’s current assets (assets that can be turned into cash within one year) and compares them with its current liabilities (payments that are due within one year). It is asking: Are the current assets sufficient to pay the current liabilities? Is the current ratio greater than 1? If not, then the company may have a liquidity problem and could be heading for trouble.
Current ratio = Current Assets/Current Liabilities
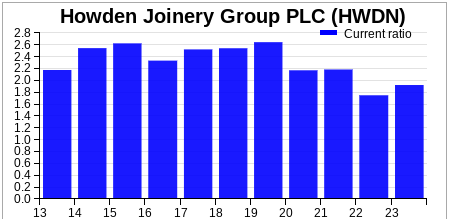
We can see that Howden has a very healthy current ratio of just under 2 times in 2023. This has come down from the higher levels seen a few years earlier but would not usually be seen as something that investors should worry about.
When you are calculating any ratio, it is important to try and understand the potential drawbacks of it. The current ratio has a few that are worth mentioning.
Stock is in the current asset number and is assumed that this can be turned into cash within one year. This might not be true. Some of it could take a lot longer to sell depending on the type of goods involved. For example, a product that goes out of fashion could be very difficult to sell, and its price might have to be slashed in order to turn it into cash.
Bank overdrafts are in current liabilities and whilst they are effectively repayable whenever the bank demands, in practice they can roll on for years.
The current ratio ignores the timing of when things get turned into cash and when payments are due. For example, current assets could be much greater than current liabilities but all the liabilities could be due now and all the assets can’t be turned into cash for almost a year. I’ll show you a way to deal with this shortly.
So a current ratio can be useful but must be treated with caution. You’ll have to dig deeper than this to really get to grips with a company’s liquidity.
Quick ratio (or acid test)
To get around the problem of stock being turned into cash, the quick ratio modifies the current ratio slightly.
Quick ratio = (current assets – stock)/current liabilities.
As with the current ratio, if the number is less than 1 you might want to take a closer look at the company’s finances to see if there is anything to worry about.
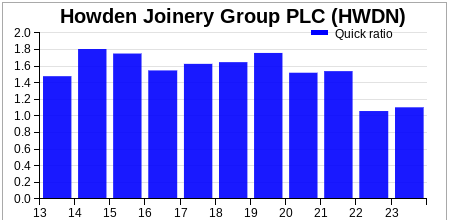
We can see here that even when the value of stocks is ignored, Howden had a quick ratio of more than 1 in 2023. This suggests that the company has a strong liquidity position.
Working capital
This is very similar to the current ratio, except current liabilities are taken away from current assets rather than being divided into them. But what do we mean by working capital?
Working capital = Current assets – Current liabilities

Working capital is the money that a company needs to operate on a day-to-day basis. Some companies need more of it than others. That’s because they might need to hold lots of stock, pay for things in advance and sell goods to customers on credit. All this can be a drain on a company’s cash resources, so it might need to invest cash in the business so that it can pay its daily running costs. This cash is known as working capital.
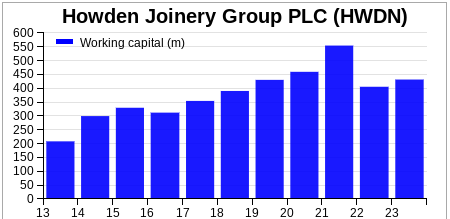
As you can see, Howden Joinery has invested more money in working capital over the ten year period between 2013 and 2023. The amount of money tied up in the business has reduced in the last couple of years, but for this ratio to be more meaningful, it is better to compare it with the size of the business as a whole.
As a general rule of thumb, a company that needs working capital will tend to need more of it as the company grows larger. It is only when the size of working capital increases faster than something such as the growth in revenues or sales – or is vastly different to similar companies – that further investigation is probably needed.
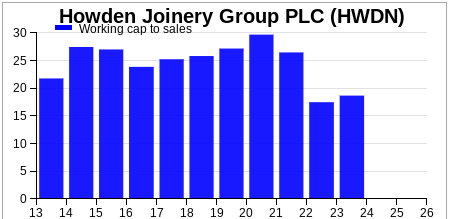
With this ratio, we can see that Howden is a business that needs quite a lot of working capital – almost one-quarter of its annual revenues were tied up in working capital until 2021. This ratio has come down since, which shows good working capital management by the company.
Going beyond the current ratio – The working capital cycle
This addresses some of the weaknesses with the current and quick ratios. It does so by looking at the speed of cash around the working capital cycle. It looks at three main things:
- How long it takes to turn stock into cash
- How long it takes for trade debtors to settle their bills
- How long the company takes to pay its suppliers
It is calculated as follows:
Working capital cycle = Stock days + debtor days – creditor days
Stock days or stock turnover
This shows how quickly a company is selling its stock.
Stock days = (Stock/Cost of sales) x 365
The slight problem here is that companies include different expenses in their cost of sales figures or sometimes don’t disclose them. In this case, turnover can be substituted for cost of sales.
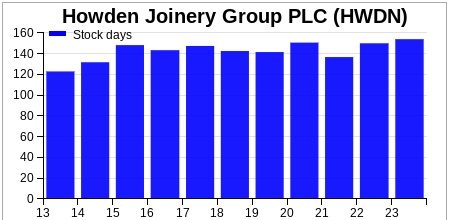
We can see here that Howden takes around 150 days to sell its stock – a ratio that has been quite consistent over the last ten years.
Alternatively, you can ignore the adjustment into days and just calculate stocks as a percentage of turnover. This is arguably a better way of comparing a company with its competitors as turnover or revenue is usually calculated in the same way, whereas cost of sales calculations can vary considerably even with companies in the same sector.
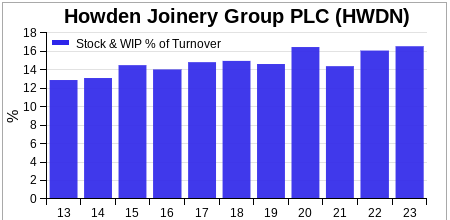
Again, we can see a level of consistency in this ratio, but it is higher in 2023 than it was a decade earlier.
One thing to bear in mind here is that calculations such as stock days will never be entirely accurate. That’s because we are comparing a number at one point in time (stock) with a number based on something throughout a year (cost of sales or turnover). The same points apply to debtor days and creditor days.
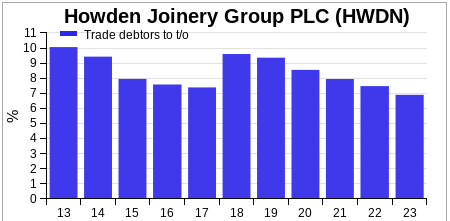
Debtor days = (trade debtors/Turnover) x 365
This gives you an idea of how fast a company is turning its debtors into cash – how fast customers are paying their bills.
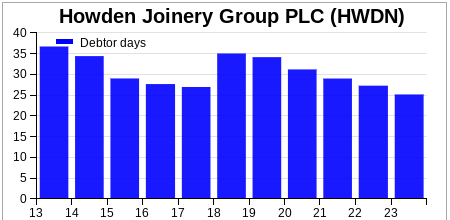
We can see that Howden’s customers took around 25 days in 2023 to pay their outstanding bills. This is down from 35 days in 2019, which is a good sign.
Again, it is probably easier to look at debtors as a percentage of turnover. The lower the number, the better.
Howden looks very healthy here with a low percentage and one that has been coming down.
Sometimes, companies don’t disclose trade debtors in their annual accounts. If that’s the case, then ShareScope won’t give you the trade debtors as a percentage of sales ratio. Instead, it will give you the total debtors as a percentage of sales ratio. This is not quite the same but can give you a flavour of what’s going on in a company.
Creditor days
This ratio shows how long on average a company takes to pay its suppliers.
Creditor days = (trade creditors/cost of sales) x 365
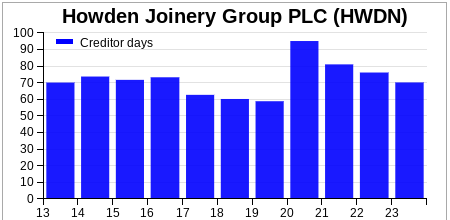
Howden took around 70 days to pay its suppliers in 2023. This is down from over 90 days in 2020, but similar to what it was in 2013.
Companies can boost their operating or trading cash flows by taking longer to pay their suppliers. This is sometimes seen as a sign of the strength of a company using its buying power. However, prompt payment of suppliers is also a sign of a business that treats its suppliers well – something that is essential for a good long-term relationship
.What a long creditor days is effectively showing is how a supplier is effectively financing the customer’s business.
A declining number of creditor days can also be a sign of something known as a “supplier squeeze” where suppliers worry about the creditworthiness of their customers and demand faster payment to reflect this.
This is a situation that you do not want to see, as the squeeze on cash flow can put a company in financial difficulty and make it harder for it to pay its other bills and liabilities.
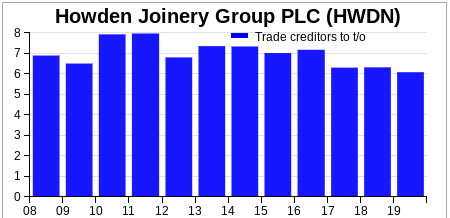
Alternatively, you can see that trade creditors were just over 6% of turnover.
Putting it all together
If we add all three ratios together, we can calculate the speed of cash around the working capital cycle.
Working capital cycle = Stock days + trade debtor days – trade creditor days
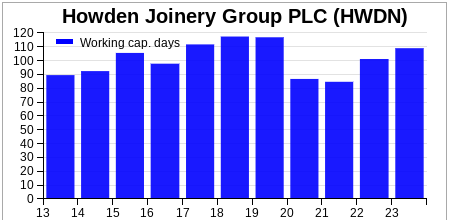
We can see that for Howden, its working capital days increased in 2023. However, its working capital as a percentage of sales – as we saw earlier – came down.
Given the issues with cost of sales numbers, many investors prefer to focus on working capital – and its components – relative to sales.
Working capital is an important number but is very industry-specific. Some companies such as supermarkets have very low working capital requirements as they can sell their stocks very quickly, don’t sell on credit and have a reasonable length of time to pay their suppliers.
On the other hand, manufacturers may have to hold large levels of stocks to meet demand as well as substantial amounts of raw materials. This makes them more working capital intensive which can mean that their ability to generate cash and earn high returns on assets may not be as good as companies with lower working capital requirements.
Financial gearing ratios
Gearing, like liquidity, is an unusual word if you aren’t familiar with financial terms.
It is a very important term to understand. However, gearing in finance is very similar to gearing on a bike or a car. If you can think of it in those terms, it will help you understand what it means for a company.
When you ride your bike in a higher gear it travels further for each complete turn of the pedals. The same is true for financial gearing. The more debt you finance the business with, the bigger the percentage change in shareholders’ profits for each percentage change in sales. This can be a good and bad thing depending on which direction sales are heading.
The important point to remember is that gearing increases the risk for shareholders. The American term for gearing is leverage. This word is becoming used more often in finance books and the financial media.
Let me show you how gearing increases risk for shareholders with a few simple examples. We’ll look at how gearing affects shareholders’ income first.

Income gearing
Below is an income statement for a company with no debt. All its operating costs are variable (this means they change in exactly the same proportion to changes in sales). In this case, the change in profits for shareholders is exactly the same as the change in sales.
| No debt (£m) | Now | 10% up | 10% down |
|---|---|---|---|
| Sales | 100 | 110 | 90 |
| Operating costs | -80 | -88 | -72 |
| Trading profit | 20 | 22 | 18 |
| Interest | 0 | 0 | 0 |
| Profit before tax | 20 | 22 | 18 |
| Tax @ 20% | -4 | -4.4 | -3.6 |
| Profit for shareholders | 16 | 17.6 | 14.4 |
| Change | 10% | -10% | |
Now add some debt into the business with an annual interest bill of £5m.
| With some debt (£m) | Now | 10% up | 10% down |
|---|---|---|---|
| Sales | 100 | 110 | 90 |
| Operating costs | -80 | -88 | -72 |
| Trading profit | 20 | 22 | 18 |
| Interest | -5 | -5 | -5 |
| Profit before tax | 15 | 17 | 13 |
| Tax @ 20% | -3 | -3.4 | -2.6 |
| Profit for shareholders | 12 | 13.6 | 10.4 |
| Change | 13.30% | -13.30% | |
The introduction of gearing (debt) means that a 10% change in sales leads to a 13.3% change in the profits for shareholders. The gearing has magnified the change in sales on shareholder profits just like putting a bike or car up a gear.
With even more debt (costing £10m a year) the gearing effect gets even bigger. Here a 10% change in sales leads to a 20% change in profits.
| With lots of debt (£m) | Now | 10% up | 10% down |
|---|---|---|---|
| Sales | 100 | 110 | 90 |
| Operating costs | -80 | -88 | -72 |
| Trading profit | 20 | 22 | 18 |
| Interest | -10 | -10 | -10 |
| Profit before tax | 10 | 12 | 8 |
| Tax @ 20% | -2 | -2.4 | -1.6 |
| Profit for shareholders | 8 | 9.6 | 6.4 |
| Change | 20% | -20% | |
People often ignore gearing when times are good and sales and profits are growing strongly. They sober up very quickly when sales are falling though.
Balance sheet gearing
Gearing applies equally to asset values. The best way to explain this is through the simple example of a house – one with a mortgage, one without.
| House with no mortgage | Now | 10% increase | 10% decrease |
|---|---|---|---|
| House Value | £100,000 | £110,000 | £90,000 |
| Mortgage | 0 | 0 | 0 |
| Net asset value | £100,000 | £110,000 | £90,000 |
| Change | 10% | -10% | |
With no mortgage, the change in the value of the house feeds through to the same percentage change in net asset value or the householder’s net worth.
Now look at what happens when the householder takes out a 95% loan to value mortgage.
| House with 95% mortgage | Now | 10% increase | 10% decrease |
|---|---|---|---|
| House Value | £100,000 | £110,000 | £90,000 |
| Mortgage | £95,000 | £95,000 | £95,000 |
| Net Asset Value | £5,000 | £15,000 | -£5,000 |
| Change | 200% | -200% | |
A 10% increase in house prices increases the net asset value by a whopping 200%. A 10% fall wipes the householder’s wealth out completely.
This unfortunate plight has been experienced by quite a few households when house prices have crashed and is called negative equity. The same can happen with companies. Britain’s banks were financed in a very similar way to a 95% mortgage (in fact worse) just before the financial crisis hit.
Measuring financial gearing with companies
ShareScope calculates quite a few gearing ratios for you. I’ll explain to you what each of them is trying to tell you. In particular, we are going to be concentrating on:
Assets to Equity
This looks at the amount of equity (the amount of money invested in the business by shareholders) that is financing a company’s total assets. The bigger the amount of assets that are financed by equity the lower a company’s gearing ratio.
Assets to Equity = Total Assets/Equity
Think back to the previous example of the £100,000 house that was financed with a £95,000 mortgage and £5,000 of equity. Here assets to equity was 20 times (£100,000/£5,000). Put another way, this means that £1 of equity was supporting £20 of assets. As we saw earlier, there’s not much protection for equity when asset values fall when gearing is this high.
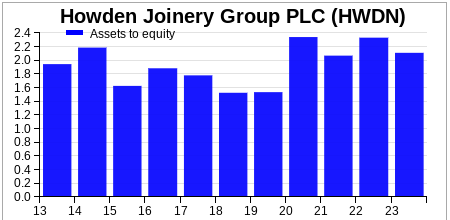
For Howden Joinery in 2023, its assets to equity ratio was only just over 2 indicating that it was not excessively geared. This ratio has also been low and stable over time.
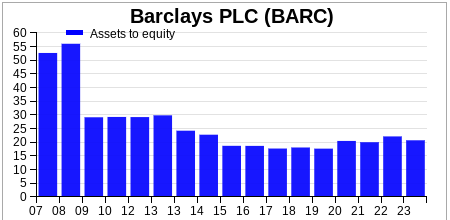
Some companies are much more highly geared than others. Banks, for example, may have an assets to equity ratio of 20 times. Before the financial crisis of 2008, it was typically over 40 times – even higher in the case of Barclays – and was one of the reasons their finances came under severe strain which saw shareholders lose a lot of money.
Gross gearing
This ratio looks at total borrowings as a percentage of shareholders’ equity. The higher the ratio, the bigger the gearing and possibly the bigger the risk to shareholders.
Gross gearing = Total borrowings/Equity
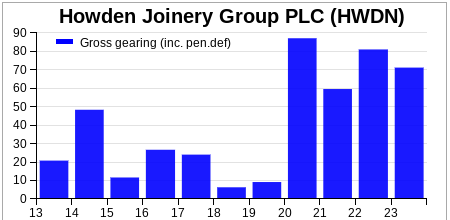
For Howden in 2023, its gross gearing was 70%. Put another way, you can say that Howden had 70 pence of debt for every £1 of equity.
ShareScope gives you the option of including any pension deficit (which is seen as a form of debt in all but name) to calculate gearing as it is more conservative to do so on this basis.
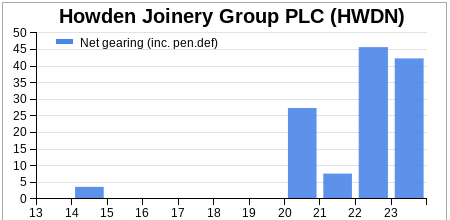
Net gearing
Net borrowings (or net debt) are defined as total borrowings less cash. This is the measure of borrowings most commonly used by companies and commentators when talking about issues such as indebtedness and gearing.
Net gearing = Net borrowings/Equity
Howden’s net gearing in 2023 was just over 40%.
Issues with gearing ratios
A company’s gearing ratio is based on the balance sheet which is a snapshot on one particular day. It may not be representative of the levels of debt and gearing throughout the year.
It’s quite common for companies to have their year ends show the companies in the most flattering light. This is often just after when trading has been its most buoyant (such as Christmas for retailers), or when lots of cash has been received from customers whilst bills have yet to be paid,
This is why net debt and net gearing do need to be treated with some caution. Taking away the cash from borrowings may not be prudent as the cash is not surplus cash and cannot be paid out to shareholders as it may have to be used to pay outstanding bills. For this reason, using gross gearing rather than net gearing may be more sensible.
A closer look at a company’s borrowings

The financial crisis of 2008 taught many investors some valuable lessons. Not only did it tell them that too much debt was very dangerous but also that the timing of when that debt needed to be paid back was something they needed to know about too.
Lots of companies borrow money which needs to be paid back at different times. These are known as debt maturities. More often than not, borrowings are repaid by taking out another loan. But what happens if the financial markets are in meltdown? The company might not be able to get another loan. If it can, then it may have to pay a much higher interest rate than it was previously which will lower its profits in the future.
Annual reports contain a lot of information about a company’s borrowings such as when they are due to be repaid. You can see if there are any large repayments due soon or whether most of its borrowings are due a long time into the future.
At times when interest rates are rising, large chunks of borrowings that need to be refinanced could cost a company more in interest payments and put pressure on its profits.
Other useful balance sheet measures
As well as calculating ratios, there are other useful bits of information that you can glean from a company’s balance sheet. They can be very useful in helping you to understand the value of a company’s shares and to calculate other ratios.
Two important numbers that you can use are:
Net asset value (NAV) per share
We know that net asset value (or NAV for short) is a company’s total assets less its total liabilities. It also equals the amount of shareholders’ equity in a business.
NAV can be a useful measure for companies that have lots of assets such as property companies, house builders or financial companies. In some circumstances it is used as an estimate of what the company could be worth if it was liquidated and the proceeds returned to shareholders. It is very easy to calculate and ShareScope does this for you.
NAV per share = NAV/Number of shares in issue at balance sheet date
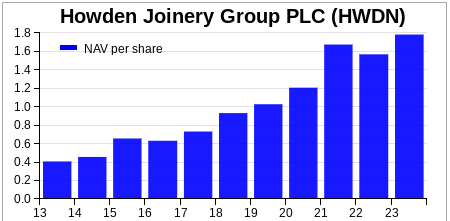
At the end of 2023, Howden’s NAV per share was 178.3p. This has grown significantly over the last decade which is a good sign.
At the time of writing – June 2024 – its share price was 875p. Companies that are very profitable – they earn very high returns on their shareholders’ equity – can see their share prices at many times their NAV per share. Companies with poor profitability can often see their share prices trade below their NAV per share.
One of the issues with NAV is that it often contains a lot of intangible assets where the value might be questionable. To get round this, it is possible to calculate a different version of NAV based on a company’s tangible assets – net tangible asset value per share (NTAV ps).
NTAV ps = (NAV less intangible assets)/Number of shares in issue at balance sheet date
For Howden at the end of 2023, its NTAV per share was 170.4p which was only slightly less than its NAV per share due to its small amount of intangible assets.
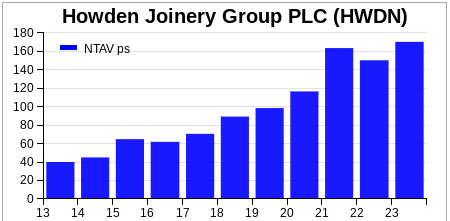
We’ll talk more about these measures when discussing how to weigh up the value of a share in a later chapter. But if you can find a share where its share price is less than its NTAVps you might want to do a bit more research and find out if it could be a potential bargain.
Capital Employed
Capital employed Is a term used to describe the amount of money that has been invested in an entire business. It is a very important number. As we shall see in a later chapter on investment returns, the sign of a good company is a high return on the money it has invested.
Capital employed can be defined in many different ways, but you can calculate it either from the asset side or financing side of a balance sheet. To give you an idea of how ShareScope does this, consider a house with a mortgage again.
If you buy a house for £100,000 with an £80,000 mortgage, your capital (or money) employed can be calculated as:
£100,000 – the price of the house – from the asset side.
or
£80,000 mortgage plus £20,000 of equity from the financing side
All you really need to understand is that capital employed represents the money that a company has invested in its business. You don’t need to worry too much about calculating it as ShareScope will do this for you.
It is a very important number used to calculate what is arguably the best measure of company performance – return on capital employed (ROCE).
The calculation of Howden’s capital employed for 2023 is shown in the table below if you are interested in seeing how ShareScope calculates the number.
| Howden Joinery Capital Employed 2023 | £m |
|---|---|
| Total Assets | 2064.5 |
| less: Current Liabilities | -468 |
| Add: Short term Borrowings/Debt | 85.3 |
| Capital Employed from Asset side of Balance Sheet | 1681.8 |
| Total Equity | 978.4 |
| Total Borrowings | 684.5 |
| Other non-current liabilities | 18.9 |
| Capital Employed from Financing side of Balance Sheet | 1681.8 |
If you want to understand how Howden’s capital employed of just over £1681.8m in 2023 was calculated, it is described in the next section.
How to calculate Howden Joinery’s capital employed
This is how ShareScope has calculated Howden Joinery’s capital employed of £1681.8m. As you can see, both the asset side (in the top half of the table) and the financing side (in the bottom half) give the same value.
From the asset side, capital employed is total assets less non-interest-bearing current liabilities less cash and securities. What we are doing is taking the assets used in the business and subtracting current liabilities such as unpaid bills. We take these away as these are a form of free financing for a business. We don’t take away short-term borrowings as they are financing the assets and we don’t want to count them twice.
The best way to deal with this when calculating capital employed is to subtract current liabilities from total assets and then add back the short-term borrowing number.
From the financing side, we take total equity, then add non-current liabilities such as debts, pension fund deficits and provisions for future expenses, and add short-term borrowings.
Some investors like to deduct the value of cash when calculating capital employed. However, it is more conservative to include it as the cash balance may not be truly surplus cash that could reduce the amount of money invested in the business.
Next: Chapter 4 – Income statements
This article is for educational purposes only. It is not a recommendation to buy or sell shares or other investments. Do your own research before buying or selling any investment or seek professional financial advice.


