
Updated: August 2024
In this chapter, we look at ways to measure how good a company is at generating profits from the resources at its disposal. We will be looking at what the company is getting back in profits as a percentage of the money it has invested. This is the real measure of how good a company (or its management team) is.

How to measure company returns
There are lots of characteristics that are required to make a good business – such as product quality, customer service, growth potential and financial strength – but as far as investors are concerned a company has to produce high levels of profitability.
To find this out we calculate investment returns using a range of return ratios. I’ll explain four popular ratios and which ones I prefer.
For those of you that are interested in more advanced analysis, I’ll also show you how you can break up some return calculations to find out even more about a company.
Companies are just like savings accounts
The best way to look at a company’s financial performance is to keep things simple and compare it to a savings account. Most of us know that a bank account paying 5% interest is better than one paying 2%. Well, companies are no different.
If a company invests £10,000 in a business (the equivalent of putting money in a savings account) and gets back £1,000, its return (or interest rate) is 10% (£1,000 divided by £10,000).
What you should be looking for as an investor is to buy the shares of a company that earns a consistently high interest rate. Or you could look for a company with a low interest rate that has the potential to earn a higher one.
One thing to bear in mind is that different sectors of the economy will have different returns or interest rates. For example, a company that makes computer software is largely dependent on the brains of its employees to make money and will tend to have less money invested in assets. If it is successful, then you would expect it to make higher returns than a steel mill which will have a lot of money tied up in buildings, machinery and stocks of raw materials.
So when you are comparing companies, those comparisons will only be meaningful if the companies concerned are in the same line of business. Having said that, by looking across different sectors you may come to the conclusion that it might be better to invest your money in a computer software company than a steel mill.
How to work out a company’s interest rate
ShareScope provides you with four key calculations (ratios) to help you work this out. They are:
- Return on capital employed (ROCE)
- Cash return on capital invested (CROCI)
- Return on assets (ROA)
- Return on equity (ROE)
These four ratios all use slightly different measures of profit and money invested. You may wonder why this is. In some cases, it comes down to investor preference or the fact that some ratios are better for particular types of companies. I’ll explain more below.
Note that ShareScope calculates returns based on the average values of assets, equity, and capital employed/invested.
As you will hopefully see, these calculations can tell you a great deal about a company and whether it could be a good investment or not.
Return on capital employed (ROCE)
Let’s start by looking at return on capital employed (ROCE), which is probably the best measure of a company’s financial performance and a number you should definitely look at.
What does capital employed mean?
Capital employed, capital invested and invested capital are terms that are used when calculating company returns. They all mean the same thing – the total amount of money that has been invested in the company.
This includes money invested by shareholders (equity) and lenders (debt) as well as other long-term liabilities such as pension schemes and provisions for future costs.
Capital employed can also be calculated from the value of the company’s assets less, credit from suppliers and credit from the taxman (which are all forms of free short-term financing).
ROCE looks at the returns a company makes for all its providers of finance – shareholders and lenders. Go back to Chapter 2 to see how capital employed is calculated. ROCE is calculated by using the following numbers:
ROCE = EBIT / Capital Employed x 100%
What this ratio is looking at is the money a company makes before tax (earnings before interest and tax or EBIT) to pay all providers of finance – essentially interest to lenders and dividends to shareholders. It is not distorted by how a company is financed or the rate of tax it pays on its profits as we shall see later with ROA and ROE. This makes it a much better measure for comparing companies.
Generally speaking, when it comes to ROCE the bigger the number the better. If a company can invest money and earn a high ROCE then over time the owners of the business – its shareholders – should become better off. Remember though, that different companies in different industries will have different values for ROCE.
You should look at the trend of a company’s ROCE to get a feel of how a company has been performing. A trend of falling ROCE needs to be watched closely as it can often be a sign that things are going wrong even if profits and earnings per share (EPS) are still rising.
Why EPS can still go up as ROCE is falling
Consider a company that has an EBIT of £2m and capital employed of £20m. It has no debt – the capital employed has all come from equity (money paid for shares by shareholders). Its ROCE is 10% (£2m/£20m). It pays tax on its profits at a rate of 20% (20% of £2m is £400k) leaving it with £1.6m of profit for shareholders. With 2m shares in issue, earnings per share (EPS) is 80p (£1.6m of profit divided by 2m shares).
Let’s say that the company borrows £10m at an interest rate of 5% to buy its main competitor which has EBIT of £600k. Interest payable will be £500k (5% of £10m) leaving profits before tax of £100k. After tax at 20% has been paid, there is £80k of extra profit for shareholders.
So profits for the whole company have gone up to £1.68m or 84p per share. Not too bad you might think. But ROCE has fallen. Total EBIT is now is £2.6m and capital employed is £30m (£20m + £10m) giving an ROCE of 8.67% (£2.6m/£30m).
The lesson here is that a company only needs an ROCE on new investments which is more than the interest rate on new borrowings to increase profit (EPS). However, ROCE measures the firm’s efficiency at converting invested cash into profit. Profit may have gone up but the % return (ROCE) is lower. This is not usually a good sign.
A high ROCE that has been sustained for a long period of time is usually a sign that you are looking at a very good business.
However, a high ROCE can be a warning sign too. That’s because it can attract competition which wants to grab a slice of those high returns. It’s very important that when you find a company with a high ROCE that you dig a little deeper into its business and satisfy yourself that it can keep the competition at bay.
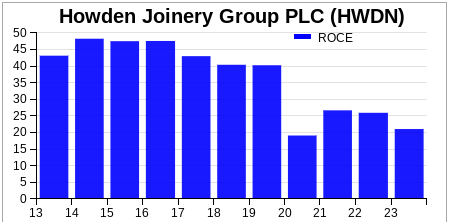
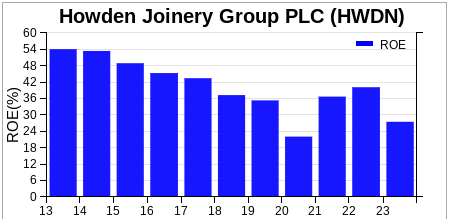
Howden’s ROCE in 2023 was 21% which is a sign of a very good business. However, looking at the chart above, its ROCE has been much higher in the past. Why has it fallen so much?
The main reason is because Howden rents most of its buildings that are used as customer depots. Before 2020, the value of these rented assets was not required to be disclosed on its balance sheet. As a result, it was not counted as part of capital employed but if it has owned its depots it would have been.
A change in accounting standards means that the value of rented assets now has to go onto a company balance sheet and is rightfully counted as part of capital employed. When calculating ROCE, the returns are lower than they were when the assets were excluded.
Return on operating capital employed (ROOCE)
A variant of ROCE is the return on operating capital employed (ROOCE). This measures the returns on the money a company has invested in its operating assets.
In contrast, ROCE measures the total amount of money invested by the company. This will include the goodwill (the amount paid over the asset value) of companies it has acquired.
You should look for companies that have high returns on the total amount of money invested, but sometimes companies pay too much for companies and this can disguise the fact that the underlying business (assets) are very profitable. By relying on ROCE alone, you can miss out on spotting very profitable businesses.
This is where ROOCE comes in. To calculate it, you simply deduct the value of goodwill from a company’s capital employed and compare it with EBIT.
ROOCE = EBIT/Capital Employed (ex goodwill)
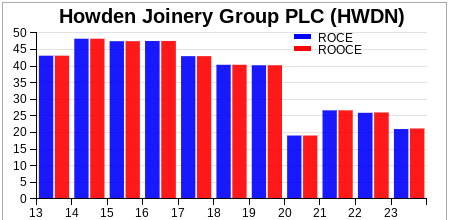
As Howden has not made many acquisitions – and paid large amounts of goodwill – its ROCE and ROOCE are very similar.
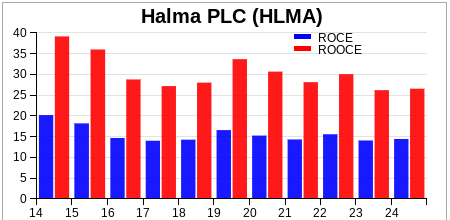
Contrast this with a company such as Halma, where its business strategy is based on buying companies and you can see a big difference between ROCE and ROOCE. That said, Halma still looks like a very good business based on the chart below.
Cash return on capital invested (CROCI) – where ROCE and FCFf meet
As we discussed in the previous chapter, free cash flow is a useful number to calculate but on its own doesn’t mean that much. ROCE is good at calculating a return on all the money invested by a company. CROCI combines the two and gives a cash return which actually means something.
CROCI = Free Cash Flow to the Firm (FCFF) / Capital Employed x 100%
This ratio is great for spotting companies that are good at turning their profits into cash but comparing it with a measure of money that has been invested by a company.
It’s another way of calculating a company’s interest rate on its investment. High rates of CROCI may tell you that you have found a very good business with high-quality profits.
The same issues with capital employed and the treatment of rented assets (leases) apply to CROCI as well.
We know from previous chapters that Howden’s free cash flow performance has been quite weak. Therefore, it is not really a surprise to see it have a low CROCI number in 2023.

It is important to understand which definition of free cash flow you have to use to calculate CROCI. You should use free cash flow to the firm (FCFf).
FCFf is the amount of surplus cash available to all providers of finance – lenders and shareholders. Capital employed is the total amount of money invested by lenders and shareholders. So you are comparing the money invested by them with the money that belongs to them.
If you have negative free cash flow to the firm you will have a negative CROCI. Should you worry about this?
As I said in the last chapter, not necessarily. All companies tend to make big investments from time to time which will eat up all their cash flow and more. It’s the future cash inflow that those investments will produce that matters.
If a company spends cash today so that it can earn a higher CROCI in the future then a year or two of negative free cash flow (and negative CROCI) shouldn’t be anything to worry about. Years and years of low or negative CROCI is another matter though. That would be a sign that a management’s strategy is not very effective at growing the value of the company.
ROCE and CROCI are probably the best two measures of company returns. Having said that, they don’t tend to work too well with financial companies – such as banks – which have lots of assets and lots of debt. For these companies, return on assets (ROA) and return on equity (ROE) are better measures and are the ones that tend to be used by professional investors..
Return on assets (ROA)
You can calculate ROA in a couple of ways but the most common method is:
ROA = Profits after tax / Total Assets x 100%
This is looking at what shareholders are getting in profits as a percentage of the total assets employed.
Total Assets is the biggest number that you will usually see on a company’s balance sheet. It will include items such as land, buildings, intangible assets, current assets and cash – essentially everything a company owns or has a claim on.
It can be seen as a broad approximation of the money that has been invested in a business, but will not take away free financing items such as cash balances and credit from suppliers as capital employed does.
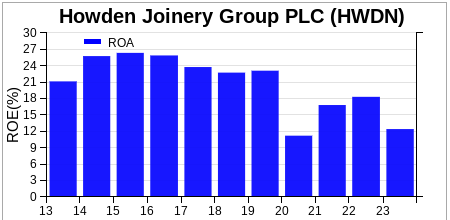
Howden’s return on assets in 2023 was 12% which is a respectable number.
Return on equity (ROE)
This is similar to ROA but instead just looks at the profits for shareholders made by a company on the money that shareholders have invested or its equity.
ROE = Profits after tax / Total Equity x 100%
Howden’s ROE was a very healthy 27.5% in 2023 but it has been much higher than this.
Advanced analysis – how debt distorts return on equity (ROE)
One of the great benefits to an investor of crunching numbers and calculating financial ratios is that they can often be broken down into smaller bits. For example, return on equity can be broken down as follows:
Return on Assets x Financial Gearing = Return on Equity (ROE)
Let’s look at this a little more closely. We know the calculation for ROA (Profit after tax/Total Assets) whilst financial gearing in this case is measured by Assets/Equity.
Assets to equity explained
Assets to equity is a measure of gearing (leverage). It tells you how many times larger a company’s assets are compared with the equity invested by shareholders. You can also work out your own personal gearing in the same way if you want to.
Let’s say two neighbours, Sarah and Jane, have bought identical houses (the asset) valued at £100k. Sarah has invested £5k of her own money (her equity) and borrowed £95k via a mortgage to buy the house. Jane has put in £50k of her money (her equity) and borrowed the rest.
Sarah is geared 20 times (£100k/£5k) whilst Jane is only geared twice (£100k/£50k). If the value of the house goes up 5%, Sarah’s equity will go up by 100% (5×20 or £105k – £95k = £10k). Jane’s equity will go up by only 10% (5×2 or £105k – £50k = £55k).
The gearing also works in reverse: Sarah’s equity will be wiped out completely with a 5% fall in house prices whereas Jane’s will not. Sarah’s higher gearing means she is facing a much higher risk. The same is true with companies.
If we list all the ratios together what you will see is this.
(Profits after tax / Total Assets) x (Total Assets/ Equity) = (Profits after tax/Equity)
Now, I don’t want to take you back to a school maths lesson too much but for those of you who know a little bit about basic algebra will understand that the Total Assets on the bottom half of the first equation (ROA) and the top of the second equation (Financial Gearing) cancel each other out. This proves that ROA and gearing when multiplied together equal return on equity.
What this means in practice is that ROE can be juiced up by increasing financial gearing. If you were just to look at ROE in isolation you might miss this.
Banks – low returns and lots of gearing
However, if you want a starker example of how to leverage juices up returns to shareholders then look no further than a bank during the early 2000s and how this became a big problem during the financial crisis of 2008.
On the basis of cold, hard numbers, banks aren’t really that profitable at all. They have very low returns on their assets. The only way that they have been able to make acceptable returns on equity in the past is by having lots of gearing.
Banks have lots of gearing chiefly because the money that customers deposit with them is a liability. Banks use this money as a source of finance in exactly the same way as borrowing from another bank or investors – it is debt.
Have a look at the record of Barclays between 2000 and 2013 in the table below, starting with its ROA.:
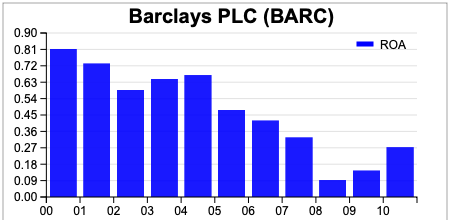
As you can see, ROA was not very impressive. Starting at 0.79% in 2000 it continued to trickle down throughout the decade. The most revealing column is what has happened to assets to equity. Starting out at an already high 21 times it went higher and higher but was not enough to stop ROE from falling after 2005.
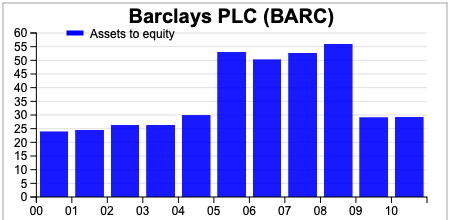
By the time of the financial crisis in 2008, Barclays was over 50 times geared. Since then it has been reducing that gearing which in 2013 was back to around the same level it was in 2000. However, ROA is still very low and so is ROE.
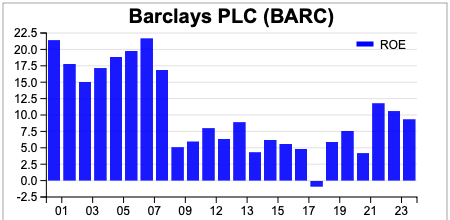
It begs the question as to how high ROE can be without high amounts of leverage and financial risk. This issue could be a reason why the shares of banks are unpopular with many professional investors.
Capital turnover explained
Capital turnover is the value of sales (or turnover or revenue) generated per £1 of capital invested in the company (or $ for US companies). It is a useful measure of how effective a company’s investments are and the effectiveness of its strategy. Capital turnover is a major determinant of a company’s ROCE. A capital turnover of 0.3 means that the company is generating 30p of sales for every £1 invested. A rising capital turnover ratio can be a good sign whereas a falling one can be a sign of trouble ahead (or a change in the company’s activities).
Breaking down ROCE into smaller parts
Just like ROE, you can break down ROCE into smaller parts as follows:
ROCE = EBIT margin x Capital Turnover
Or
(EBIT / Sales) x (Sales/Capital Employed) = (EBIT/Capital Employed)
As with the breakdown of ROE into smaller bits, the Sales numbers cancel each other out so multiplying a company’s profit margin (in this case EBIT) by its capital turnover will equal its ROCE.
So if you look at the trends in operating margin and capital turnover you can gain a greater understanding of how a company is generating its ROCE.
Let’s have a closer look at Howden’s capital turnover.
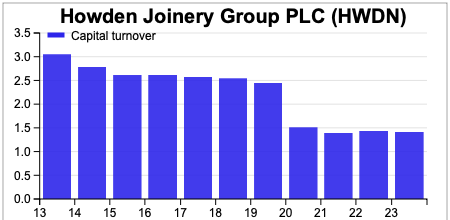
As with ROCE calculations, Capital turnover has been impacted by the inclusion of rented assets on the balance sheet – which increases capital employed – after 2020. In 2023, Howden’s capital turnover ratio was holding steady at 1.4 times.
It has been its falling operating margins which have driven down its ROCE in recent years,
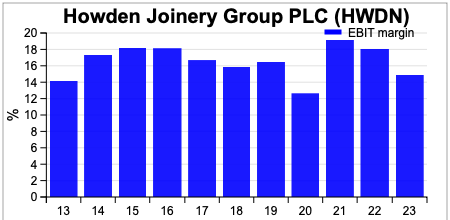
What ROCE teaches you to do is to concentrate on more than just the income statement. If you did just that, you might look at the EBIT margin and think that it has been quite stable and that everything was fine.
What’s good about breaking down a company’s ROCE between its profit margin and capital turnover is that it gives you an insight into how a company can improve its returns or where it might be vulnerable. If you think about this a bit further, you can see how a company can earn a higher ROCE:
- Higher profit margin
- Higher capital turnover
- Higher profit margin and capital turnover
Capital turnover and profit margins are related to each other. For example, a company with a high profit margin and low capital turnover could try to increase its ROCE by cutting its prices – and possibly its profit margin – in order to sell more.
A company with low profit margins might want to look at cutting costs or becoming more efficient to boost its ROCE. Another option is to boost capital turnover by getting rid of unproductive assets.
Different businesses in different industries tend to have different profit margins and capital turnover characteristics. One year’s figures should not be taken as a rule, you should examine the trend.
Having said that, here is a short list of different companies in different industries which have a high ROCE based on their latest profit margin and capital turnover figures (as of June 2024) to highlight this point.
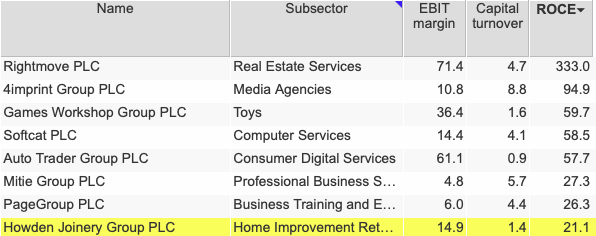
Source: ShareScope
We can see that companies such as Games Workshop and Auto Trader earn their high ROCE mainly from having high profit margins. Others such as Mitie, Page and Softcat achieve it from high capital turnover ratios.
Rightmove is a standout company in that it earns exceptionally high returns from having both high profit margins and a high capital turnover ratio.
Understanding these issues means understanding the challenges that face the CEO and board of a substantial company. Excessive emphasis on one or more values like EPS and ROCE can lead to distorting behaviour.
Next: Chapter 9 – Share valuations
This article is for educational purposes only. It is not a recommendation to buy or sell shares or other investments. Do your own research before buying or selling any investment or seek professional financial advice.


