
Updated: August 2024
The last four chapters have been spent looking at the balance sheet and income statement and how to use them. In this chapter, we will move on to arguably the most revealing piece of financial information that a company gives investors – its cash flow statement.

When a company’s financial results are talked about in the news you’ll find that a lot of emphasis will be placed on its profits and maybe whether the dividend has been increased. After all, profits are what matters, right?
To an extent, this is true. But cash is part of the lifeblood of any business. There have been numerous past examples of companies that seemed to be very profitable but were teetering on the edge of bankruptcy because they couldn’t turn those profits into cash fast enough.
That’s why cash flow statements are really useful for investors. They show you where cash comes in and goes out of a company. If you want to really understand a company’s finances then you need to look at its cash flow.
In many ways, profit is based on opinions relating to the treatment of costs and revenues. This means that they can be manipulated to make a company look like it is doing better than it really is. Cash flow is much harder to fudge over the long run and that’s why it’s a good idea to know something about it. ShareScope will show you the way.
Why profits and cash flow are not the same number
If you remember when we talked about profits and the income statement, one of the most important things to understand was how they are calculated.
Profits are calculated on the basis of accruals or matching. This means that a company’s revenues and the costs of generating them are matched against each other and recorded when a transaction takes place. This does not tell you when cash came in or went out of the business – the flow of cash or cash flow. They usually don’t happen at the same time.
This means that for most companies, its profits will never be exactly the same as its cash flow. There are lots of reasons why this is the case but I’ll give you three quick examples now:
- Depreciation – this is an expense in the income statement which matches the cost of a tangible fixed asset against the revenues it produces. It reduces the amount of profit a company makes in a year. However, it is not a cash flow. The actual cash flow happened when the company bought the asset being depreciated in the first place which could have been a long time ago.
- Sales on credit – Customers are often given a period of time to pay for the goods and services they buy from a company. This sale will usually be booked in the income statement before the cash is received.
- Purchases on credit – Similarly companies may buy supplies on credit. These will be expensed in the income statement sometimes before the bill has been paid. Also, companies can pay for supplies in advance (a prepayment) which means that cash has flowed out of the company before the costs of supplies have been expensed in the income statement.
The bottom line for companies and investors is that cash matters. It is needed to pay things like bills, wages, interest on borrowings and dividends to shareholders. Investors can use it to spot aggressive accounting by comparing profits with cash flows over a period of time. It therefore pays to spend some time looking at a company’s cash flows.
Howden’s cash flow statement
Howden’s cash flow statement taken from ShareScope is shown below. It shows the company’s cash flows for the last six years. If you wanted to do a study of its cash flows over a longer period of time then ShareScope will allow you to go back as far as 1989 for this company.

You may not want to do this with Howden, but for some companies, this can be a very useful thing to do. As mentioned in an earlier chapter, you might want to learn more about how a company’s cash flow behaved during an economic boom or a recession.
A cash flow statement is broken down into three main bits:
- Net cash flow from operations – This shows how a company’s net income is turned into operating cash flow.
- Net cash flow from investing – this looks at the cash flows from buying and selling assets, buying and selling businesses and any interest and dividends received.
- Net cash flow from financing – this looks at how a company raises money such as new share issues or new borrowings. It also looks at money spent on paying back loans or repurchasing shares as well as paying for the cost of loans (interest) and shareholder finance (dividends).
These three sources of cash flow are then added together to calculate the change in a company’s cash balance over the year. This is shown at the bottom of the cash flow statement as the “net change in cash”
For 2023, we can see that Howden’s cash balance declined by £27.3m. This will not always equal the change in the cash balance on the balance sheet as there may be exchange rate adjustments for cash held overseas.
Let’s look at each section of the cash flow separately.
Net cash flow from operations
This is the most important part of the cash flow statement. It shows you how much cash flow a company is generating from its operating or trading activities.
Here we see how Howden converts its net income or profit after tax into net cash flow from operations.
What happens is that any expense – such as depreciation – which reduced net income but did not see cash flow out of the business is added to the net income number. Any income or profit that did not cause cash to come into the business is taken away from net income.
The main adjustments that get us from a company’s net income to the net cash flow from operations number are:
- Depreciation – add back
- Amortisation – add back
- Profit on disposals – take away
- Losses on disposal – add back
- Share-based payments – add back
- Increases in sales made on credit (change in debtors) – take away.
- Decreases in sales made on credit – add back
- Increases in purchases made on credit (change in trade creditors) – add back
- Decreases in purchases made on credit – take away
- Increases in stocks or inventory – take away
- Decreases in stocks or inventory – add back
- Amount paid into pension fund is more than pension cost expensed in the income statement – take away
- Amount paid into pension fund is less than pension cost expensed in the income statement – add back
- Tax paid – take away
That’s a fairly long list, but hopefully, after you’ve looked at a few cash flow statements you will be able to understand how a company is – or isn’t – generating its cash.
Some companies choose to start from profit before tax when presenting their net cash flows from operations. In this case, any interest income will be deducted, and interest costs added back. In ShareScope, the adjustment process always starts from the net income number.
How does Howden’s operating cash flow stack up?

We’ll talk about analysing cash flow statements in more detail in the next chapter. But first, let’s look at the make-up of Howden’s net cash flow from operations in ShareScope for 2023.
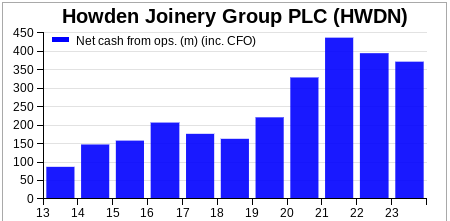
Before we do, the chart below shows us what has been happening to this number over the last decade. We can see that it has increased substantially which is always a good sign. However, it has declined for the last two years which should be investigated.
Here is the breakdown of Howden’s net cash flow from operations taken from ShareScope.

The first thing to notice is that the net income profit figure is substantially lower than in 2022 which will put pressure on the cash flow figure right from the start.
Then there is an increased figure for depreciation and amortisation of £140.9m that is added back. This is a big source of operating cash flow for a company like Howden which owns or rents lots of tangible fixed assets such as its customer depots, delivery vehicles and kitchen unit manufacturing factories.
We then turn our attention to the cash flow impacts from changes in Howden’s working capital – the changes in stocks, debtors and creditors.
We can see that the business has been increasing in stocks for a number of years. In 2023 there was a cash outflow of £9.5m which is much lower than what has been seen recently.
Debtors have been reduced which has brought £38.8m of cash flow into the business, but this has been offset by creditors reducing which led to a cash outflow of £64.3m.
Overall, Howden saw £51.9m of cash flow out of the company which was similar to the year before.
Tax paid was £63.5m which was a lot lower than in 2022. This will reflect the lower levels of profit but may also be due to timing issues.
Starting from a position of net income being £78.2m lower than in 2022, net cash flow from operations was only £23m lower due to higher depreciation and lower tax paid.
Net cash flow from investing
This section shows how much money a company is spending on its business and how it may be bringing in cash as well. It can do this by investing in new assets (known as capital expenditure or capex) or buying new business (acquisitions).
Money can be raised by selling assets or businesses. You are also shown the money coming into the business from interest on bank accounts and dividends from investments in other companies. Any other cash flows from investing are in the “Other” row.
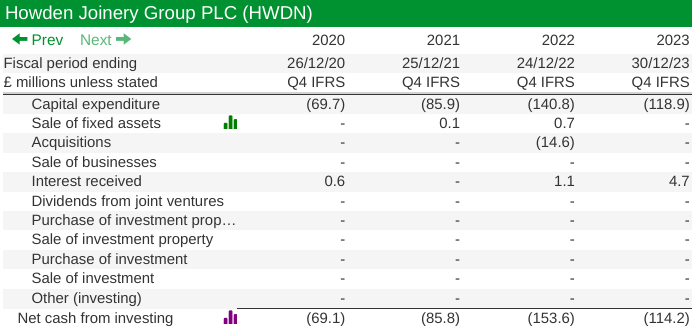
Again, the size of the numbers involved here and their trend is what’s important. By far the biggest amount of money going out of the business is capital expenditure or capex. This was £118.9m in 2023, down from £140.8m the year before.
The only other cash flow was £4.7m coming in from interest received.
We can also see that Howden made an acquisition of £14.6m in 2022.
Generally speaking, Howden’s investing activities have largely been confined to capital expenditures in the last few years. Some companies regularly spend money on acquisitions in order to grow. There is nothing wrong with this as long as they are not paying too much to buy businesses. You’ll learn how to see if this is the case in a later chapter.
The cash outflow was £114.2m in 2023 which was £39.4m lower than the year before.
Net cash flow from financing
This section shows how Howden raises new money from lenders and shareholders and what it pays back to them in terms of interest, dividends and share repurchases.

What is interesting here is that we can see that financing has seen cash flowing out of the business between 2020 and 2023. If we add up the net cash outflows for these years, a total of £1094.1m has flowed out which is a big number.
There was a £285.4m outflow in 2023, down from £444.6m in 2022.
The big outflows in 2023 came from the payment of dividends, the repayment of leases and a share buyback. Interest payments are relatively small in comparison.
Repayment of leases are a regular cash outflow. They are treated as a financing cash flow but you could argue that they could be seen as an investing cash flow as well as they are related to physical assets that have been rented.
The share buyback figure was a very significant £250m in 2022. It may explain the lower cash dividend cash flows due to fewer shares in issue.
Share buybacks are normally viewed as a good thing for companies to do. By reducing the number of shares in issue, they increase the ownership stake of the remaining shareholders. That said, if a company’s shares are deemed to be expensive or overvalued, then share buybacks can be seen as a bad use of money by a company.
We can also see that Howden is not raising any money from new borrowings which can be seen as a sign of financial strength. It is also not raising much money from issuing new shares which makes sense given that it has been spending lots of money buying shares.
Adding everything up – the change in cash balances
If we add together operating, investing and financing cash flows, we get the overall change in the company’s cash balance.
As we saw earlier, Howden’s cash balance went down by £27.3m in 2023, and by looking at the three sections of its cash flow you will understand why that happened.
To gain more insight into Howden’s cash flow, we need to get ShareScope to analyse it in greater detail as it has done with balance sheets and income statements. You’ll see how it does this in the next chapter.
Next: Chapter 7 – Analysing cash flow statements
This article is for educational purposes only. It is not a recommendation to buy or sell shares or other investments. Do your own research before buying or selling any investment or seek professional financial advice.


