
Updated: August 2024
Hopefully, you will now understand balance sheets and how important and useful they are. Let’s move on to a set of numbers which most people think are even more important – profits.

Just as we did with balance sheets, I am going to explain the numbers in an income statement in this chapter. In the next chapter, I’ll show you how ShareScope turns those numbers into useful information.
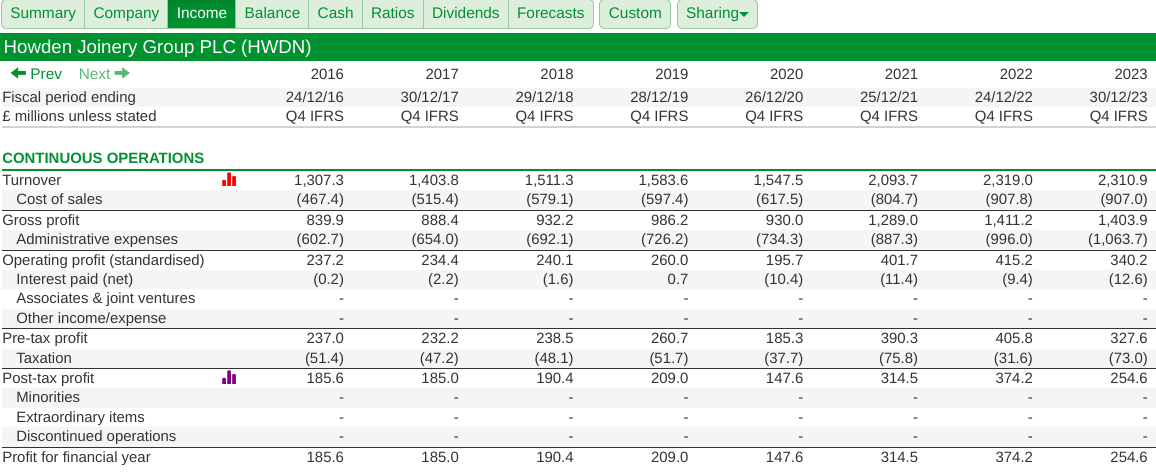
When you are looking at a company in ShareScope and click on the green “Income” tab you will get a view of its income statement as shown below. This will tell you how the company turned its turnover into profits in the years shown. The level of detail in the income statements will be very similar to what you would expect to see in a company’s annual report.
What is profit?
A company’s profit is simply its income less its costs. There are lots of different ways of measuring profits. I will explain what each of these mean in this chapter.
How much profit does a company make? This is probably the first thing an investor will look for when they are thinking of buying shares in a company. A company’s profit history and more importantly the prospects for its future profits form a major part of the decision-making process as to whether a share is a decent investment prospect or not.
A company’s annual report and accounts contain a lot of information about profits. The best place to start looking at them is with its income statement (this used to be called a profit and loss account which might make more sense to some readers).
ShareScope will give you a company’s income statement which will allow you to study its profit history over a long time period. For example, in ShareScope you can look at Howden Joinery’s income statement as far back as 1989 if you wanted to.
You might not think that’s necessary, but knowing how a company performed in the past in different economic conditions is very valuable information. The author Mark Twain was reputed to have said that “history doesn’t repeat itself but it does rhyme.” When it comes to company performance, I think this is probably true as well.
For example, you might want to look at how well a company’s profits held up in the recessions of the early 1990s, the 2008 financial crisis and the Covid-19 pandemic in 2020. Companies with resilient businesses and profits tend to make better long-term investments than those whose profits fall sharply in recessions.
The income statement shows a breakdown of a company’s income minus its costs for a period of time – most often a year. It shows you how a company’s income was made during the year.
One thing to make clear right away is that it does not show the movement of cash going in and out of a company. That’s a very important subject that I’ll talk a lot more about in another chapter.
An income statement is put together using an accounting principle known as accruals or matching. What this means in practice is that costs are matched against the income that they generate and are recorded. It does not matter whether the recorded income or cost caused cash to come into or out of the business. As I’ve just mentioned, this point will become more important later on when we discuss cash flow.
Nevertheless, an income statement contains lots of valuable information for an investor and it’s important to understand the main terms within it.
Here’s a brief explanation of the main terms that you will find in an income statement.
Turnover
This is the first line that you will see in an income statement.
It is also sometimes called sales or revenue. This is the lifeblood of any company. Companies don’t tend to last very long without turnover.
Turnover represents the income earned by a company from selling its goods and/or services.
For example, if you owned a business that sold one product – let’s say beer – and its price was £1 per pint and you sold 1,000 pints during the year, your turnover or revenue would be £1,000 (£1 x 1,000 pints). Howden sells lots of different goods at different prices. In 2023, when these were all added together it amounted to a very large sum of money of £2310.9m.
Gross profit
As you will see there are lots of different measures of profit. The first one you are likely to see on a company’s income statement is something known as gross profit.
Gross profit is a company’s turnover less the costs involved with selling the goods sold (or the cost of goods sold).
Gross profit = Turnover less cost of goods sold
Let’s return to your small brewery business. We know the amount of turnover. We need to work out the costs involved in selling those 1,000 pints.
In a very basic form, these will be the costs of things such as water, barley, hops, yeast, and sugar. But you could also include things such as the rent on the brewery, electricity, beer barrels, delivery costs, alcohol duties and wages.
It’s important to understand that one company’s definition of its cost of sales might be significantly different to another’s. There is no set standard as to what should count as a cost of sales and what shouldn’t. A company’s true gross profit may also give away some valuable information about its business to competitors or customers and so most companies don’t really want to give this information away.
However, if we get back to the simple example of the brewing business: let’s say that the cost of making and selling the beer was £800. This means that my gross profit was £200 (£1,000 of turnover less £800 of costs on 1000 pints).
On Howden’s definition, it was £1403.9m in 2023.
Gross profit can be an interesting number if based on a genuine measure of the cost of goods sold. It gives you the profits that are available to pay the fixed overheads of the businesses such as wages and rents. The bigger a company’s gross profits are, the easier it tends to be for it to pay these costs.
Operating profits
All other expenses of running the business (known as operating expenses) – however the company chooses to allocate them – are deducted from gross profit to get a figure known as operating profit. This is also known as trading profit because it represents the money made from selling its goods and services.
Howden’s operating profit in 2023 was £959.2m.

EBITDA
EBITDA is short for earnings before interest, tax, depreciation and amortisation which is quite a mouthful.
As a number, EBITDA has become increasingly popular with some investors in recent years, although I’m not convinced that it is that useful (I’ll explain why in a minute). But just in case it is, we’ve included it as a measure of profit in ShareScope.
I talked a little about depreciation when we were looking at balance sheets. It is an expense which matches the annual cost of using tangible fixed assets such as plant and machinery against the revenues or turnover that they help to generate.
There are a few different ways of calculating depreciation on an asset which I won’t get into here but the most common method is known as straight line – the same amount each year over the life of the asset.
Say I buy a machine that lasts ten years for a cost of £12,000. At the end of ten years, I reckon that I can sell it to a scrap merchant for £2000 (its residual value). I calculate the depreciation cost to charge against my revenues using the following formula:
Depreciation = (Cost – Residual Value)/Useful life
In my case, it is (£12,000-£2,000)/10 = £1,000 per year.
This means that my profits are reduced by £1,000 per year until I replace the machine. Amortisation is calculated in a similar way but applies to intangible assets such as computer software.
As cash is only spent when a fixed asset (such as a machine) is bought, some people argue that depreciation and amortisation are not real cash costs and so should be ignored (I disagree). They are also prone to manipulation by the company directors who can boost profits by lowering depreciation expenses by doing things such as changing assumptions on residual values or extending the useful lives of assets.
It is argued that in ignoring depreciation and amortisation altogether, EBITDA can therefore be seen as a cleaner measure of trading profit. It is often used by certain types of investors as a means of weighing up potential takeover value of a business.
For what it’s worth, I believe that profit has to be stated conservatively and based on something that can be paid to investors. It is true that a business can go on for a while without replacing its computers and fixed assets but in the long run it cannot do that. By reducing profits with a charge for depreciation, the fact that an asset will be replaced one day is being taken into account.
In 2023, Howden’s EBITDA was £1383.1m.
EBIT
EBIT is simply EBITDA less the costs of depreciation and amortisation. EBIT (Earnings before interest and tax) can end up being a very similar number to operating profit. In ShareScope, EBIT also includes the share of a company’s ownership stake in other companies (known as associates and joint ventures).
EBIT is arguably the most important number that you will see on the face of an income statement.
It represents the profits available to pay lenders (interest), taxes and shareholders (dividends). When it comes to valuing a company it is also one of the best numbers to use. This is because EBIT is not influenced by how a company is financed whereas other measures such as pre-tax profit or earnings per share (EPS) are.
Howden’s EBIT was £996.6m in 2023 according to ShareScope.
Interest paid (Net)
Just as individual savers do, companies receive interest on the money they hold in bank accounts. They also have to pay interest on their borrowings such as bank loans or bonds they have issued to investors.
Many companies also rent (lease) assets such as vehicles, plant and machinery and buildings. The cost of doing this includes an implicit interest cost which is also included on the face of its income statement.
Interest paid (net) is the sum of money paid to lenders less interest earned on bank accounts. It excludes something known as capitalised interest. Capitalised interest is the cost of borrowed money that is incurred when building an asset and this is included in the cost of assets on the balance sheet.
Howden’s net interest paid was £32.4m in 2023.
Pre-tax profit
Sometimes referred to as profit before tax (PBT), this is the company’s total profit after all of its operating and financial expenses have been accounted for.
Howden’s pre-tax profit in 2023 was £910.3m.

Taxation
Companies usually have to pay tax on their pre-tax profits. The amount actually paid will depend on which countries the profit is actually earned in. Companies may also use certain allowances that can reduce their tax bill such as losses made in previous years.
Howden’s taxation expense was £73m in 2023.
Post-tax profit
Pre-tax profit less taxation gives you a figure for post-tax profit.
In Howden’s case, this was £254.6m in 2023. However, this is not always the same as profit that belongs to its shareholders and is available to be paid out as dividends. There are still some deductions to be made before we get to that number.
The first number to take away is minority interests. This refers to the share of post-tax profits that belong to another party other than the company’s own shareholders. For example, a company may own 90% of a business and another company owns 10%. If the post-tax profits of this business are £40m, then 10% (£4m) belongs to a minority interest and so must be taken away from the company’s total post-tax profits to reflect that those profits don’t belong to its shareholders.
In Howden’s case, there is no deduction for minority interests.
The other figure that also has to be deducted before we get to profits available for dividends is what are known as non-equity dividends. Companies sometimes issue preference shares – so-called because their shareholders get preferential treatment and are paid before ordinary shareholders are – where the dividend paid has to be paid out of post-tax profits but before ordinary shareholders get paid a penny. This is not an issue for Howden as it doesn’t have any preference shares and non-equity dividends.
Profit for the financial year
After everything has been deducted, we are left with a profit for the financial year. This is the profit that can be used to pay dividends to shareholders or retained within the business for investment.
In 2023, Howden’s profit for the year was £254.6m, the same as its post-tax profit.

Per share and normalised values
As well as the actual numbers within an income statement, ShareScope gives you some important numbers on a per-share basis. These are identical or similar to the ones that you would see in a company’s annual report. This makes it easier for shareholders to see what their share of the profits is for each share owned.
One of the most heavily used and quoted numbers from a company’s income statement is earnings per share which is often abbreviated to EPS.
In simple terms, this is the company’s profits for the financial year available to shareholders divided by the weighted average number of shares in issue during the year.
However, companies tend to publish lots of different EPS numbers which can be confusing. Understanding the differences between them is very useful.
Reported EPS
Reported EPS is based on the profit from a company’s underlying trading activities plus the profits and losses from one-off or exceptional items. Nothing is excluded from this measure of EPS. For Howden in 2023, the reported EPS was 46.3p.
For instance, a company may have made a big gain on selling some of its assets or incurred a lot of costs by shutting down a business. As you will see later, this EPS number can be quite useful for investors.
ShareScope also breaks down this reported EPS number into the EPS that has come from continuing businesses and discontinued ones (ones that have or will be closed or sold off). In 2023, all of Howden’s 46.3p of EPS came from its continuing businesses.
Normalised EPS and company-adjusted EPS
Normalised EPS is meant to give investors a per-share profit figure based on the underlying performance of the company. It is an adjusted measure of profits from ShareScope’s data provider.
It strips out one-off gains and losses (known as exceptional items) so that you can see the profits made by the existing business. For Howden in 2023, the normalised EPS number was 46.3p – the same as its reported EPS as there were no one-off items.
ShareScope also provides – when available – a company-adjusted EPS. This is the company’s own version of normalised EPS where it makes its own adjustments.
The normalised and adjusted versions is the EPS number that companies want you to focus on. It’s the number that they want City and Wall Street analysts to base their predictions of future performance on. It’s the number they want to be judged on.
Normalised EPS can be a very useful number but is open to abuse. Some companies have had a tendency to have big exceptional items every year. Exceptional items should be one-off in nature. When they recur every year it could be argued that they are no longer exceptional and could be a sign of aggressive accounting. Investors should be wary of companies where this happens.
In ShareScope, the normalised EPS figure is the one used for ratios when you are looking at UK companies.
Fully diluted EPS
In ShareScope all the EPS numbers are based on a fully diluted number of shares. We do this because we believe it is the most conservative measure of EPS.
What fully diluted EPS effectively does is to warn shareholders of possible future changes to EPS due to events that have already happened which may cause additional shares to be issued. Examples of such events are:
- Convertible bonds or preference shares that are in issue. These might give the holder the option to convert their bonds or preference shares into ordinary shares at a future date(s) which will increase the number of shares in issue.
- Share options or warrants (options to buy shares that are listed on the stock exchange) that are in issue.
All the above may lead to more shares being issued in the future which will mean that profits will be spread across a greater number of shares which would reduce EPS. Fully diluted EPS takes these effects into account.
ShareScope adjusts the earnings and number of shares to take any of these scenarios into account to give you a fully diluted EPS figure,
Other Normalised numbers
In addition to normalised EPS, ShareScope also gives normalised and company-adjusted figures for key profit items such as operating profit, pre-tax profit, post-tax profit, EBIT and EBITDA. These numbers are used for calculating some ratios in ShareScope and are very useful for looking at the underlying performance of a business based on different measures of profit.
Next: Chapter 5 – Analysing income statements
This article is for educational purposes only. It is not a recommendation to buy or sell shares or other investments. Do your own research before buying or selling any investment or seek professional financial advice.


