Updated: August 2024
In this final chapter, I use the data and tools in ShareScope to show you how I analyse shares. Even if you are not a subscriber, you should find this article extremely useful as a guide to making informed investment decisions.

One of the main selling pitches of the fund management industry is that they can make more money for you than you can by investing for yourself.
They argue that they have lots of clever, hard working people slaving away day after day trying to find the best investments so you don’t have to. Give them your money and you will be a lot richer over the long haul.
Sadly, most people have realised that this isn’t true.
More information isn’t necessarily better. You can have too much information.
The real skill in investing is focusing on the information that really matters.
You don’t need to spend hours talking to companies and analysts like many professional fund managers do. As with many things in life, the quality of what you do is much more important than the quantity.
You need to take the information that you have and use it in a structured and disciplined way to help you answer the important questions about an investment.
Combine this with the ability to be single minded, to think clearly and rationally and you are already well on the way to making good decisions.
The good news here is that with ShareScope you already have everything that you need.
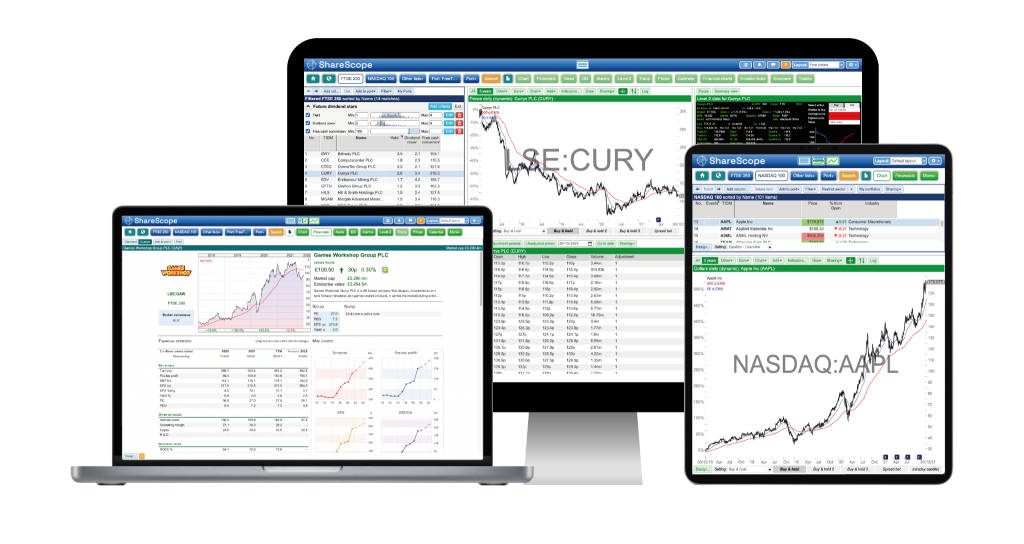
When I started investing, I believed that the only tools an investor really needs to do well are an internet connection and a copy of the company’s latest annual report.
I still read annual reports but I’ve changed my view slightly. An internet connection and a copy of ShareScope gives me everything that I need to make an informed decision about an investment. I have access to many years of company results within the software so I don’t need to go anywhere else, unless I choose to do so.
I used to be a professional analyst in the City and I can tell you that someone using ShareScope can analyse a company just as well as the pros.
In this chapter, I’m going to show you how I used a lot of the tools in ShareScope to decide whether I would buy the shares of sports retailer JD Sports. I am also going to show you how you can also use the wealth of data in ShareScope to perform some optional useful advanced analysis that can increase your understanding of a company.
This is not a share tip but a way of showing you how you can use ShareScope to analyse a company and its shares. As always, do your own research before investing in anything.
Let’s get started.
Know what you are buying
Before you do anything else, you need to spend a reasonable amount of time learning about what you are potentially buying into.
In these days of the internet and online broking accounts it’s very easy to get sucked into thinking that you are trading numbers on a computer screen.
If you are a proper, long-term investor you will not be doing this. Instead, you will be looking at buying a small chunk of a real business.
Understanding what makes this business tick is key.
The more you understand about how it makes money now and in the future, the more you will concentrate on this and stop worrying about the daily ups and downs of share prices and the masses of unimportant market chatter.
You can come across an investment idea in many ways.
For example, you can be a customer and like what the business sells. Or you might have found it by screening for it in ShareScope. Either way, you probably need to try and understand it better.
As a simple rule of thumb, if you can’t explain to a friend what a company does and how it makes money in a few minutes then you probably shouldn’t be buying its shares.
Let’s take the example of JD Sports.

The first thing you can do to find out more about the business is to click on the ‘financials’ then the ‘company’ tab in ShareScope. The activity breakdown will tell you where and from what businesses a company makes its money from. You can set this breakdown to tell you this in terms of sales or profit.
Here we can see that JD Sports makes around 95% of its sales from its Sports retail division and gets a similar proportion of those sales from the UK & Ireland, North America and the Rest of the World.
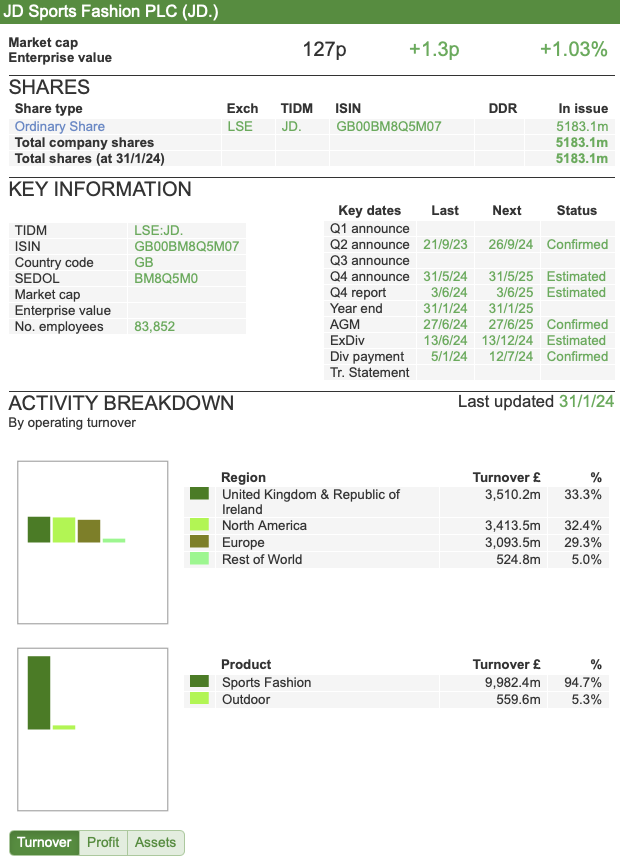
Below the activity breakdown is a brief summary of the company telling me a bit more about what it does.
In this instance, I can learn about some of the products, brands it sells and what countries it sells them in. It Trades under lots of different retail formats (known as fascias) in different markets across the world.

When first researching a company it is a good idea to look at who owns it as this can sometimes reveal some interesting facts. Click on the ‘DD’ tab (Major Shareholders and Directors Dealings) in ShareScope to do this.

The first thing that leaps out is the fact that Pentland Group owns 51.6% of the business. Large, dominant shareholders can be a blessing and a curse to the private investor.
Sometimes they can be too conservative and lock a company into a bad strategy or fail to react to competition. But they can also be a force for good. Either way, you need to try and find out a bit about them.
Who is Pentland Group?
Well, a quick search on the internet tells me that it is a family owned, private company that owns a lot of well known sports clothing brands such as Berghaus, Ellesse, Hunter (famous for its posh wellington boots), Endura Kickers (UKlicence), and Speedo.
It used to own the Reebok shoe brand before selling it for a nice profit.
It has owned its stake in JD Sports since 2005 and seems intent on remaining a long-term shareholder. This is reassuring, as the last thing you want as a private investor is big shareholders constantly selling down its stake and depressing the share price.
It is clear that Pentland Group sees JD Sports as key to selling more of its branded goods. This is also potentially good news for JD Sports and its shareholders as these brands help differentiate the company from the competition (more on this in just a minute).
My opinion is that these stable brands from Pentland Group may help to position JD Sports at the quality end of the sports fashion market away from the more commoditised end which is more about selling big brand trainers and replica football kits. This should allow it to earn higher profit margins than selling Nike trainers – of which it sells a lot.
What’s also encouraging is that the chairman, chief executive and group finance director own reasonable stakes in the company. In the words of Warren Buffett it seems that they ‘eat their own cooking’.

Is it a decent business?
If I am looking at this business from the perspective of owning it for a long time, not trading it for a few months, you have to have a lot of confidence that it has what it takes to survive and prosper.
To do this it has to be able to compete with similar businesses and stop them from destroying it.
What we need to find out is whether a business has an economic moat that can keep competitors at bay.
JD Sports operates in a very competitive sector. An internet news search will tell you that high profile companies such as JJB Sports and Blacks Leisure (which JD bought in 2012) have gone bust.
Many blame the aggressive pricing of Sports Direct (owned by Frasers Group) which once threatened to “finish off” JD Sports.
The fact that JD Sports has survived – and Sports Direct began to have problems – and prospered suggests that it is doing something right and has some form of competitive edge.
This is most likely to come from its focus on the quality end of the market and higher margin sports fashion goods.
You can easily compare two or more companies in ShareScope by setting up a portfolio and adding columns of financial data.
Here, I’ve compared JD Sports against Frasers Group which owns its major UK rival, Sports Direct.

As JD has been expanding its business in the US, I am also comparing it against some of its US rivals such as Foot Locker and Dick’s Sporting Goods.
We can quickly see here that JD is earning a respectable ROCE but below that earned by Frasers Group and Dick’s Sporting Goods.
Its financial position is strong as evidenced by a high level of interest cover.
Interestingly, we can see that JD has grown its turnover and earnings per share at a much higher rate than its rivals over the last decade. When you see big growth numbers like this, it is often a sign of a company buying companies in order to grow. If it isn’t then the growth rate would indicate a very successful business strategy.
It’s very easy to check if a company has been making lots of acquisitions by looking at its cash flow statement. This shows that JD has indeed been doing this.
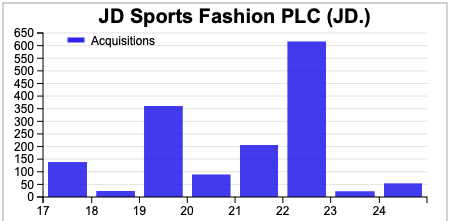
It is important to realise that the acquisitions line in the cash flow statement only shows the cash spent. Sometimes companies pay for large acquisitions by issuing new shares to the seller’s shareholders.
We can see a very large cash inflow from a new issue of shares in 2022.
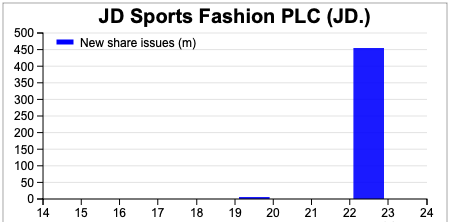
By checking out the news in ShareScope it shows that the money was raised to fund acquisitions,

That said, JD Sports current ROCE suggests that it is making decent returns for its investors despite spending lots of money buying companies.
Profit analysis
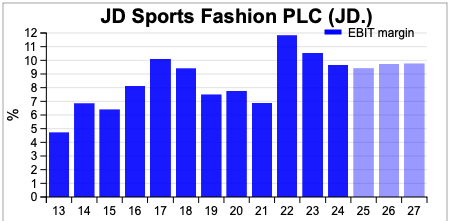
Selling trainers and sportswear is not a particularly high margin business. The company’s margins have been on a downwards trend since a recent peak in 2022. They are expected to fall in the current financial year before improving slightly.
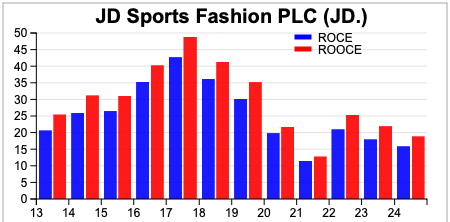
As mentioned in previous chapters, ROCE and ROOCE are distorted by the exclusion of rented assets – of which JD Sports has a lot of rented stores – from the balance sheet and capital employed before 2020.
ROCE and ROOCE have been on a declining trend but still remain above 15% which shows that JD is still a pretty decent company.
Balance Sheet analysis
One of the key balance sheet ratios to check out with a retailer such as JD is the level of stocks/inventories to turnover. A rising ratio can be a sign of slow moving stock where sluggish sales could see the need for big price reductions to shift it which could reduce future profits.
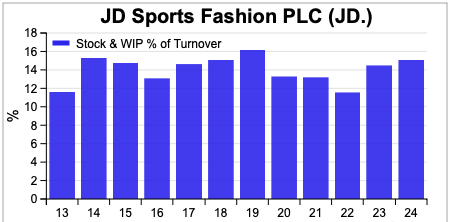
There was a slight increase in this ratio in the last couple of years but it remained within the company’s historic range which suggests at first glance that there isn’t anything to worry about here.
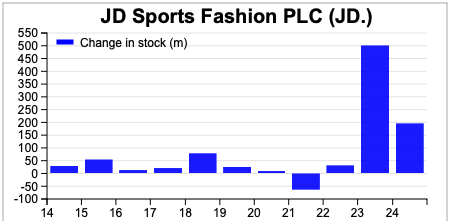
However, a look at the cash flow implications of rising stocks sees significant cash outflows which is not what you want to see. The company explained the big outflow in 2023 as a normalisation of stock levels in its US business. In other words, previous stock levels were too low.
“Inventories, net of provisions, across the Group at the end of the period were £1,466.4 million (2022: £989.4 million). Within this, inventories, net of provisions, in our businesses in North America increased to $581.7 million (2022: $262.9 million) as the flow of product reverted to normal levels.”
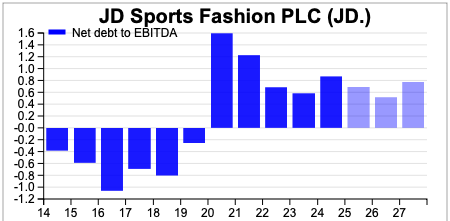
The company does not have excessive debts as measured by the net debt to EBITDA ratio.
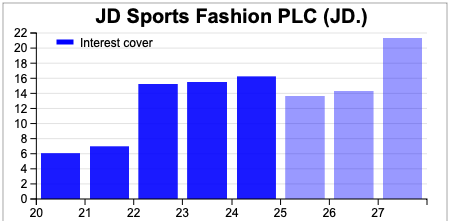
There is also no problem paying the interest bills as interest cover is very high.
Cash flow analysis – weak free cash flow is a concern
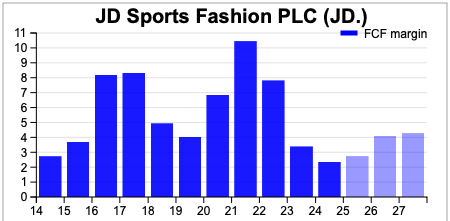
Having identified a significant cash flow weakness from stocks, this is feeding through to a weak free cash flow performance from the business in recent times.
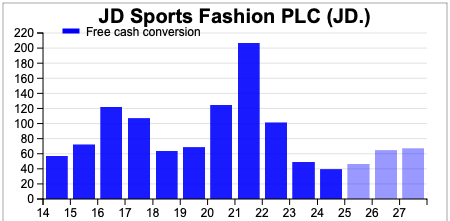
The company’s conversion of its profits into free cash flow has been deteriorating and is at a very low level. According to current forecasts by City analysts it is not expected to get back to acceptable levels – around 80% or better any time soon.
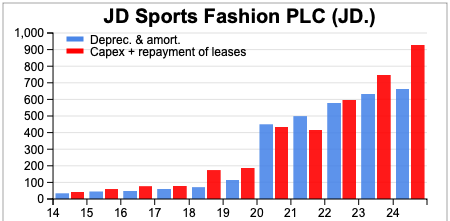
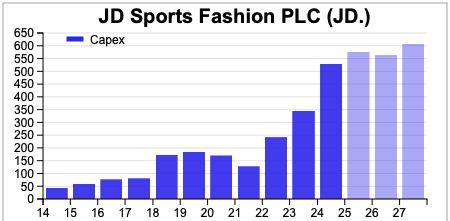
We know that free cash flow has been impacted from stocks while capex has also been more than depreciation which also reduces it.
Capex is also expected to stay at high levels over the next few years.
As a result, free cash flow margins are not looking great and are only expected to be just over 4% in 2027.
How can it grow?
Once you’ve got to know a bit more about the business and studied its financial history you need to start turning your attention to a company’s future prospects. Knowing what happened in the past is very useful, but a company’s share price and dividend paid are based on what will happen in the future.
For a share to be a good long-term investment it has to have the potential to keep on growing its profits. How do you go about working out whether JD Sports can do this?
We know that trainers and sportswear have become a major fashion market – especially for young people – and this trend is expected to continue.

The first thing I tend to do here is check out the latest news on current trading.
You can easily find this in the news section in ShareScope. It’s important to spend time reading the comments of the chief executive, finance director and the review of the business in a results statement. There will almost always be a comment on the future prospects of the business there.
The company released its full year results for the year to January 2024 on 31st May 2024. It showed revenues up by 2.7% with operating profits down by 8.1% with the company referring to “challenging markets”, in its peak trading period.
Its outlook for the new financial year was quite cautious with reference to volatile markets:
“We have started the new financial year with Q1 in line with our expectations in a volatile market and we are on track to deliver our profit guidance for the full year. Looking further ahead, we have a strong business model and a clear strategy to deliver long-term growth and value creation for our shareholders.”
The revenue growth was impacted by disposals of businesses.Excluding this, organic sales growth was reassuring at 9% although gross margins fell slightly due to increased promotional activity.
The chief executive remains very confident on the long-term growth potential for the company’s markets:
“I am confident that the global sportswear market, and in particular, the athleisure space within it, has many years of structural growth ahead of it, with favourable trends like casualisation and active lifestyles continuing. Euromonitor1 is forecasting that the sportswear market will achieve value growth of 6.6% per year from 2023 to 2028, on average. This would take the total value of the market from $396bn in 2023 to $544bn in 2028. We believe that through our growing brand presence, our industry-leading buying and merchandising team, our powerful brand partner relationships and both our strong balance sheet and cash generation capability, we will outperform the market and deliver double digit market shares in all our key markets”
He also confirmed the targets of the company’s five year plan, although it is not meeting some of them at the moment, especially on sales growth. Operating margins were also lower than target.
“We remain focused on delivering our ‘triple-double’ of double-digit sales growth3, double-digit operating margin3 and double-digit market shares in our key markets over the course of the plan. In respect of our target for double-digit sales growth3, we made a good start in the first year, delivering organic sales growth* of 9.0% in what ended up being a challenging and volatile market. With the positive impact from the proposed acquisitions of Courir and Hibbett to come, we remain confident of achieving this target. On operating margin*, our target is to reach and maintain a double-digit operating margin3 within the course of the plan. The operating margin* was lower this period than in the base period, reflecting the necessary investment in our operating platforms for long-term growth”
That said, if the company can meet these targets then its profits should be much higher than they are currently in a few years time.
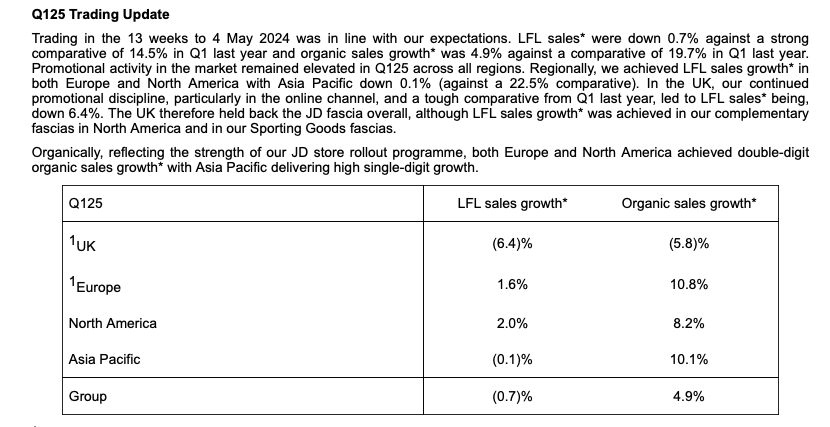
What is concerning is that current trading looks quite weak, even though the company is up against a strong comparable performance from a year previously.
Weak like-for-like sales and organic growth – especially in the UK – is a concern, although elsewhere, organic sales growth is more reasonable.
What do City analysts think?
Profits should be able to grow over the longer-term, but the company is going through a rough patch right now.
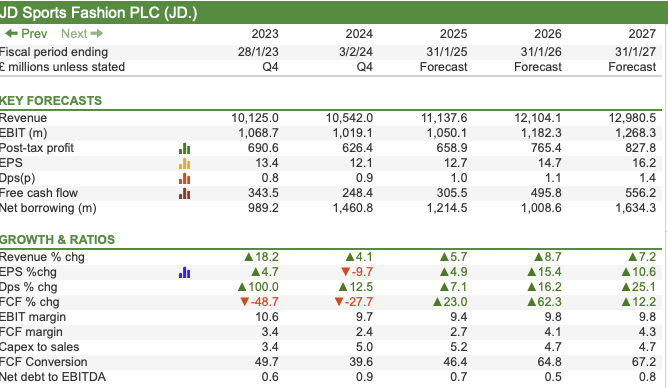
City analysts’ forecasts look to be quite bullish. While the year to January 2025 is expected to see quite modest EPS growth, this is expected to pick up in the following years, driven by robust revenue growth and improving profit margins.
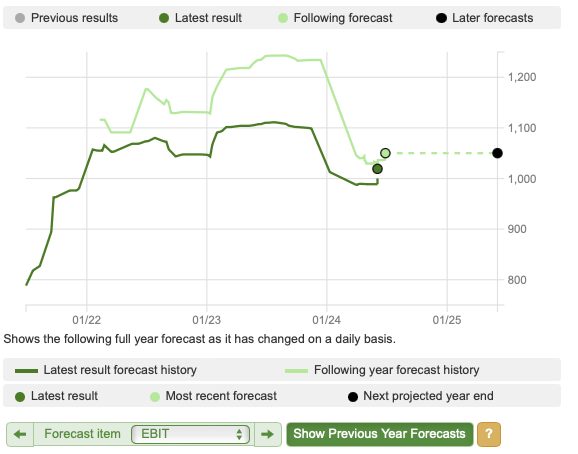
My concern would be that forecast momentum in this business has been weak.
The chart below shows that forecasts for EBIT for 2025 came down a lot at the start of 2024 but have edged up slightly more recently.
If they have stopped falling then that would be a good sign, but it could still be the case that growth expectations for 2026 and 2027 are still too high.
Looking at the Consensus Opinion in the Forecast section of ShareScope – we can also see that of the 15 analysts covering the shares, 11 rate them as an outperform or buy with 4 recommending hold. The average share price target is 168p – implying nearly 40% upside from the current share price of 120p.
Are the shares good value?
Paying the right price is crucial to investment success. Good companies are rarely available at rock bottom prices, but paying a “fair price” rather than a high price is what you should be aiming for.
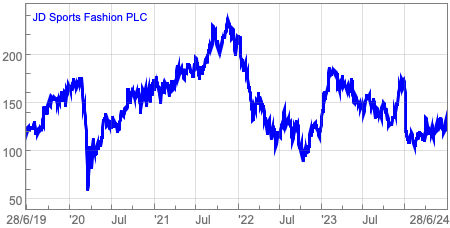
JD Sports’ shares are very unloved right now and have fallen by 27% in 2024 as concerns over its trading outlook have increased.
However, its shares do look cheap, especially when compared with US rivals Foot Locker and Dick’s Sporting Goods on a one year forecast PE basis. They also look reasonable on a PEG basis.

JD also has the highest expected sales growth forecast over the next three years, although it is getting a significant boost from acquisitions.
What is slightly more concerning is that despite this boost, its forecast EPS growth is expected to lag Foot Locker and Frasers Group.
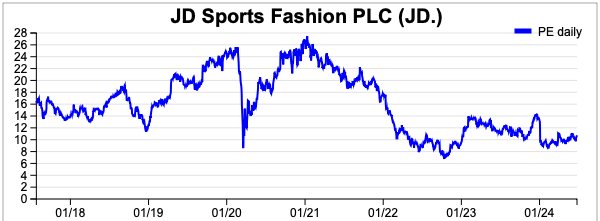
Looking at its PE history, we can see that the valuation of the shares has come down a lot over the last couple of years as competitive pressures and consumer weakness have increased.
Quick Summary
- JD Sports looks like a good business, making decent profits and operating in a growth market.
- Its profits should grow in the future but current trading conditions are difficult.
- 2025 forecasts look achievable but 2026 and 2027 may be too high.
- Free cash flow weakness is a concern.
- The shares look cheap if long-term forecasts can be met.
- In the UK, Frasers Group shares might be better value.
Conclusion
As you can see, you have all the data you need in ShareScope to perform a thorough analysis of a company and make a considered investment decision. Yes, I have years of experience which help me to do this quickly but just as I learnt how so can you. The weekly articles and this Step-by-Step Guide are here to help you achieve this and please feel free to email us at marketing@sharescope.co.uk with any questions or suggestions for future articles.
This article is for educational purposes only. It is not a recommendation to buy or sell shares or other investments. Do your own research before buying or selling any investment or seek professional financial advice.


