Bruce takes a look at some global indices and copper which all seem to be breaking down, with shorter term moving averages dropping below medium term ones (death cross). Companies covered: CRPR, DUKE and YCA.
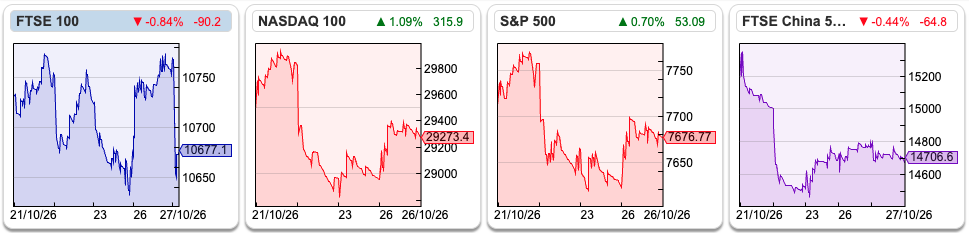
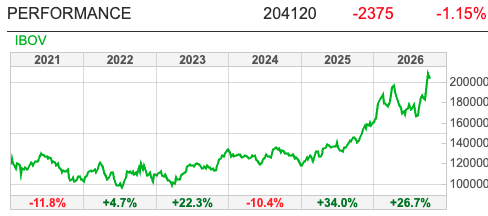
The FTSE 100 fell -0.5% to 10,677 over the last 5 trading days. The Nasdaq100 and S&P500 were down less than -1%, as Anthropic filed publicly for an IPO with the SEC. I mentioned a couple of weeks ago that the Brazilian stock exchange had risen +30% YTD, despite weak Chinese economic data. That trend has reversed as Lula defeated Jair Bolsonaro: The Brazilian real (currency) fell -8% and the Ibovespa Index lost roughly -14%, with trading halted as a “circuit breaker”. NB because of those “circuit breakers’, which temporarily close the market, the ShareScope IBOV chart had not updated at the time of writing.
I thought this Hugh Hendry post was very good, suggesting that we’re too focused on US inflation data. Instead, he points out the Chinese 10Y government bond yield is around 1.6%, versus the US at 5%. “Two economic giants, joined by the greatest manufacturing and consumption arrangement in history, now paying radically different prices for ten-year money.” As China has pegged its currency to the dollar, that implies Chinese debt markets are still dealing with their property bubble bursting. The US debt markets are by contrast looking very late cycle, running hot and funding AI capex.
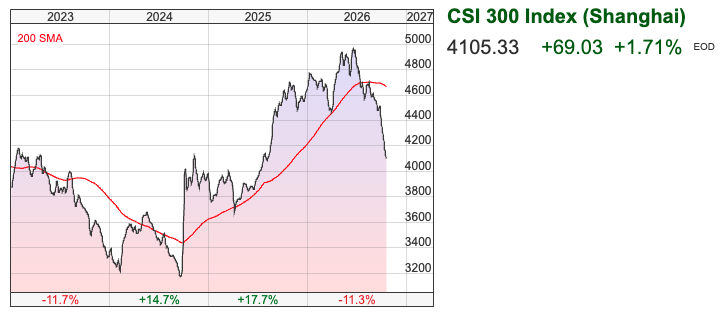
The CSI 300 (Shanghai – ticker 000300) looks far from reassuring. China has been exporting cheaper goods, and deflationary trends, to the rest of the world.
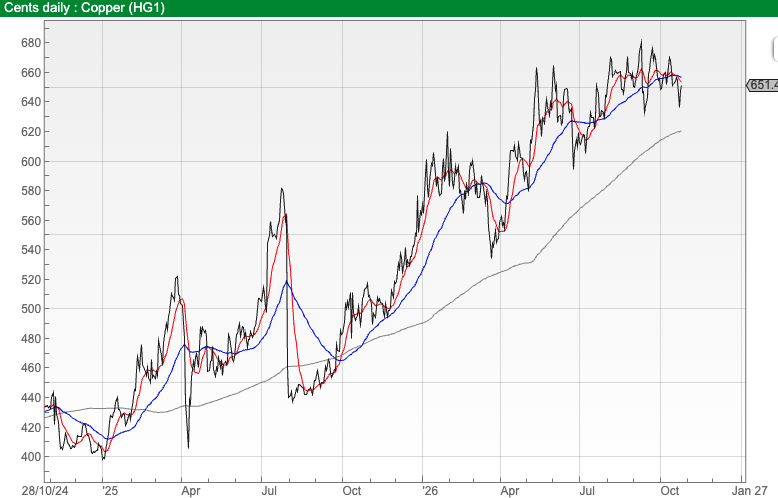
A number of indices have been weak in the last 3 months, including -8.5% for the STOXX Europe 600 banks (EXV1D) and -5% for the SPDR Russell 2000 Small Cap (R2US). Copper (HG1) remains above its 200 day moving average, but the chart (below) looks like it could be forming a rolling top, with the 16 day moving average (red) falling below the 64 day (blue). The same is true of the MSCI World (ACWI) and Nasdaq100 (IXND). A chart with the short term moving average breaking down is often called a “death cross” – which seems appropriate for Halloween.
After Trump started bombing Iran, I raised cash by selling some losing positions (including half my DUKE, see below). My plan was to slowly reinvest as the summer came to an end. Now with Brent Crude at $111 a barrel, and the various ShareScope charts mentioned above breaking down, perhaps a few more months of cautious “wait and see” won’t hurt. I would imagine most readers are UK focused too, but the benefit of ShareScope is data series and charting that help to understand global trends. Worth noting that AIM has been such a poor performer since the pandemic ended, perhaps there’s some shelter from any storm in owning “old economy” UK stocks?
November is a good month for conferences: seeing companies and speakers present and chatting with other investors. First, MoneyWeek Wealth Summit, 6th November in Central London, followed by Mello Events 17th and 18th November in Chiswick.
This week I look at Duke Capital’s curious share price movement and update, followed by Yellow Cake. But I start with James Cropper, the paper commodity, with advanced hydrogen materials division, enjoying a very strong 18 months after several difficult years.
James Cropper H1 Sept Trading Update
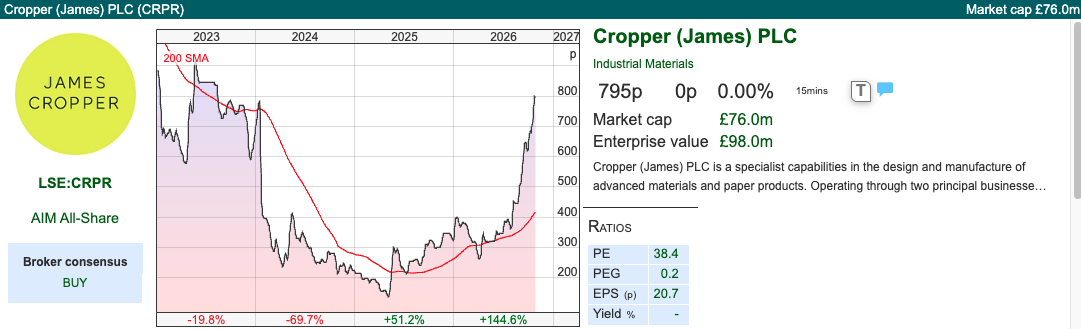
Well done to Cockney Rebel who pitched James Cropper on Mello about a month ago. Momentum has continued with a strong H1 trading update “ahead of the Board’s expectations”. The Group’s Paper & Packaging division around two thirds of group revenue (£63m of revenue, but loss making for 4 years between FY Mar 2026 – FY 2022) has been much stronger than anticipated, on both the revenue growth and cost management side.
Around a third of revenue is the Advanced Materials division, which looks to benefit from supplying the hydrogen economy. There’s no update on that division in the RNS, but at the FY Mar revenue was growing at +11% y-o-y, with a very healthy operating profit margin of 24%.
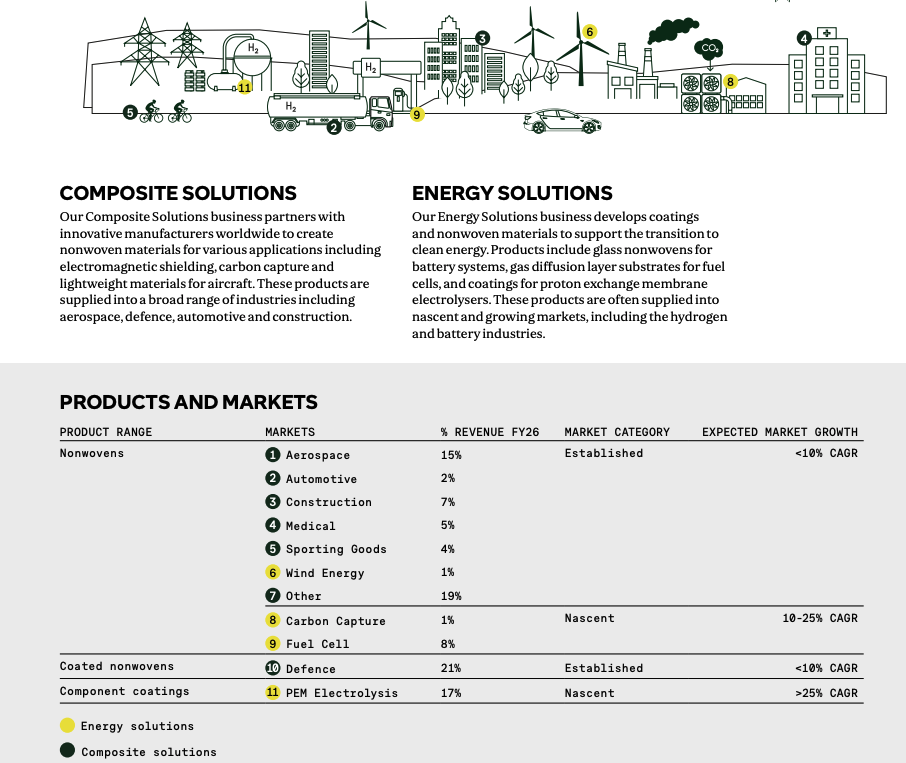
CRPR group FY Mar 2027F Adj EBITDA is expected to be between 10-20% ahead of expectations. This is a capitally intensive business, so ignoring depreciation as a real costs is not helpful, but at least trends are moving in the right direction.
Valuation: The shares are trading on 12.5x PER Mar 2028F, and 7.5x EV/EBITDA. So despite the 6x increase, these don’t look expensive if you assume that EPS of 64p in Mar 2028F is realistic. For context, they achieved EPS of over 50p in 2017, when the shares changed hands at above £19 per share.
Opinion: I last looked at this in August 2024, when the price was 255p, but the chart looked like a falling knife. I said that this “could be an opportunity if investors can time their entry point, but it’s not without risk. I’ve put it on my watchlist, but haven’t bought any.” Since that comment shares fell below 140p in May last year, but have now bounced to 800p.
I’ve mentioned that I keep buying “falling knives”, but ShareScope has the tools to help: here’s YouTube tutorial on how to set up a “golden cross” filter. That is, when a short term moving average rises through a long term moving average. This is not a fool proof, for CRPR the approach would have given a false buy signal at 600p and 300p on the way down, and a false sell signal during the recovery phase at 360p earlier this year. So the golden cross filter is not infallible, but could be a useful starting point, particularly if combined with disciplined risk management – cutting losses when the trade breaks down.
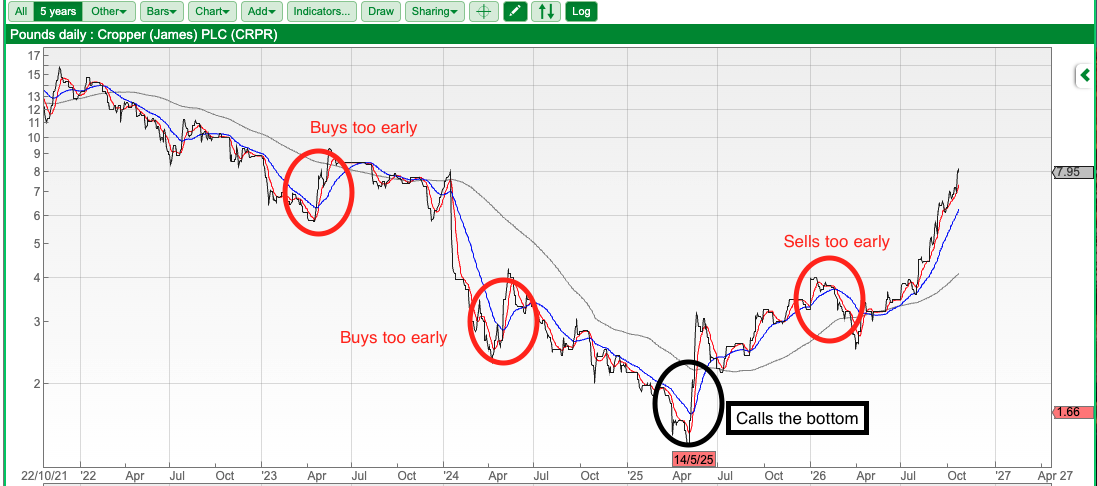
ShareScope tools like this filter can help focus our opportunity space, then combine with fundamental analysis and qualitative judgement, increasing our chances of making money.
Some other ideas: using the golden cross filter, flags other some interesting ideas.
- Cohort (mkt cap £590m, PER 17x Mar 2028F), the defence business that reported a strong trading update at the end of September.
- James Halstead (mkt cap £535m, PER 14x June 2028F) the commercial flooring group which has been in a long term downtrend since 2022. The most recent FY Jun results showed reported PBT continuing to decline. The outlook statement mentioned continued headwinds, but confusingly also the Board expressed confidence for the year ahead.
- LBG Media (market cap £79m, PER 5x Sept 2028F). This was hit badly by changes to Meta’s Facebook algorithm as well as lower traffic from search engines due to AI Overviews (some similarities with FUTR on <3 PER). Schroders have just bought a disclosable position in LBG, and revenues were up +22% at H1 Mar 2026.
- Ixico (market cap £20m, forecast to still be loss making) the neuroimaging and biomarker group that has also been in a long term downtrend by said a week ago they expect to exceed revenue expectations that had already been increased in July.
I don’t own any of these. The idea is to highlight ShareScope’s tools and filters, rather than provide tips. Do Your Own Research (DYOR).
Duke Capital Update
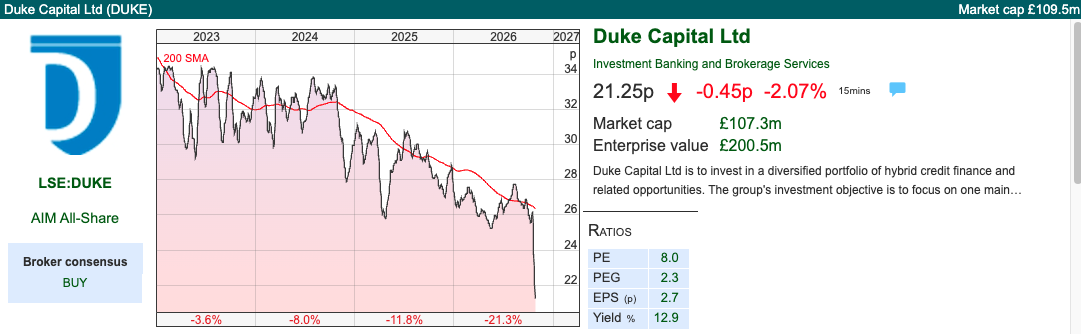
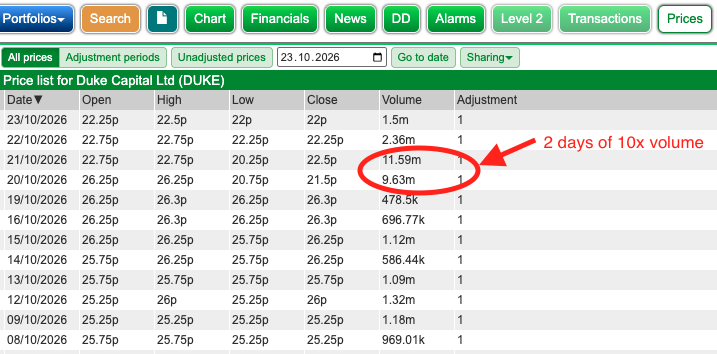
The opposite of a “golden cross” is a “death cross” – appropriate for Halloween. An example of which is Duke Capital, with a curious RNS after the share price had already fallen around -15% on no news but heavy volume last week. We can see that from ShareScope’s “Prices” tab (below), where the volume was 9.6m, versus a 3 month daily average of 1.03m. That daily volume compares to a previous maximum volume in that 3 month range of 2.3m shares traded. Interestingly there was even more volume 11.6m shares traded on the following day, when management released an RNS saying: “As the UK market continues to be challenging, we do expect lower recurring revenue to be generated within our UK portfolio in H2 with the key focus of the investment team currently being on improving the performance of the UK portfolio into next year.”
The RNS was combined with a broker update from Cavendish, leaving their forecasts of total cash revenue of £28m FY Mar 2027F unchanged. Last FY Mar 2026 DUKE reported total cash revenue of £28.6m, and recurring cash revenue of £27.1m (so there’s a £1.5m difference explained by exit premiums and cash gains from selling equity investments). DUKE also said in June that recurring cash revenue would be £7m in Q1 to June, then last week confirmed a further £7m in Q2 to September – Cavendish forecasts annualise that to reach £28m – too optimistic given management comments about H2. This doesn’t feel like the kind of market where DUKE will achieve exit premium significantly higher than reported FY Mar 2026, so by implication Cavendish’s forecasts are too high. Possibly management “pull a rabbit out of the hat” and they refer specifically to: “late-stage processes for exits which, if concluded, could have a material positive impact on market expectations for FY27 total cash revenue.”
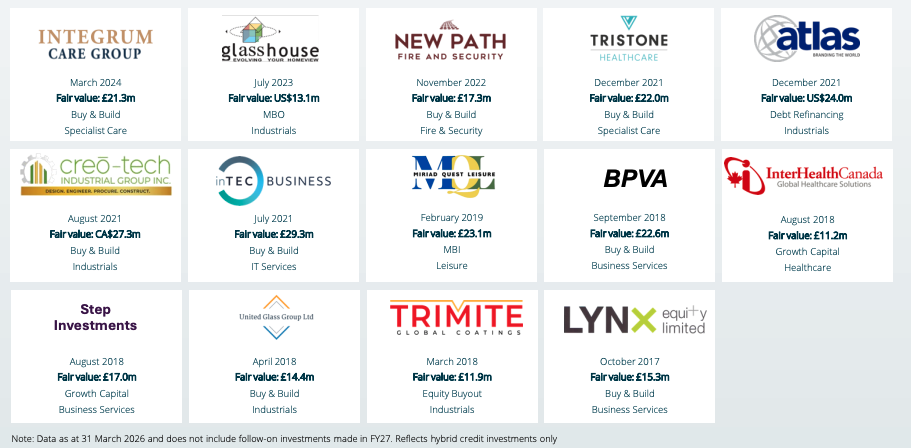
Duke has been lending to SMEs at around 12% fixed interest rate, with no re-financing risk. You can gain some idea of the portfolio here, note particularly the care homes, Intergrum and Tristone, which make up £43m of fair value, or just under a quarter of £174m of net assets. Duke is a majority shareholder in both Tristone and Intergrum Care, at just over 50%.
The last successful exit, worthy of an RNS was Fabrikat (a UK manufacturer of street lighting columns and guard rails) in March 2024. Fabrikat was sold for £3.9m (equity value), with a realised gain of £1.6m and an unrealised gain of £2.3m. Those gains from investing just £3000 in the equity and the lending Fabrikat £6.2m, which was repaid in full.
Valuation: The shares are now trading on a dividend yield of 13% and a price to NAV of 0.6x. I’m not going to quote a PER, because it seems likely that FY Mar 2027F numbers could be wrong by a wide margin in either direction. Tricky one.
Opinion: I can’t find fault in terms of voluntary disclosure here. It seems like there’s wide variance of outcomes, they could fail to achieve the exits – resulting in a missing FY Mar 2027F forecasts – or they could report some sizable gains if all goes well. I sold half my position in March, worried that the UK economy would suffer from energy price spikes, resulting in bad debts from Duke’s Royalty lending model. I have now sold my other half. My experience with financials (Argentex, but also banks) is to avoid anything that looks “too cheap” and the share price is falling for no obvious reason.
Yellow Cake Q3 Sept Update
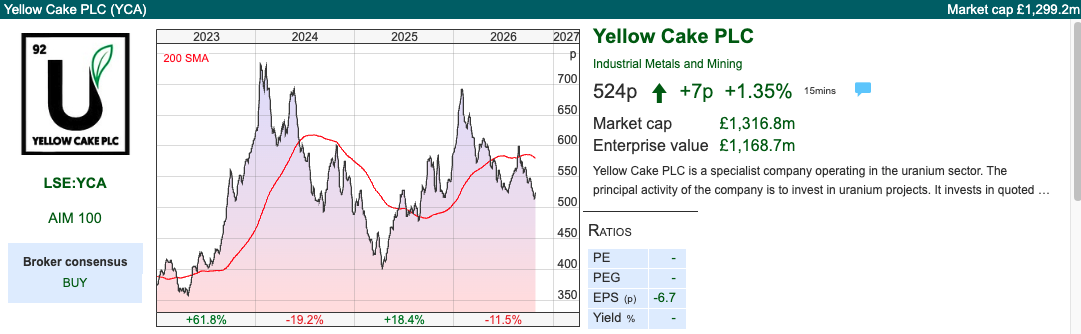
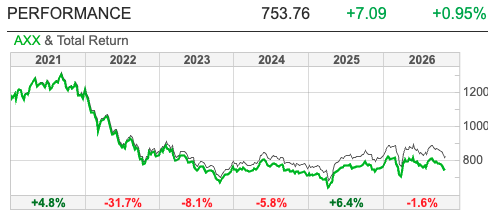
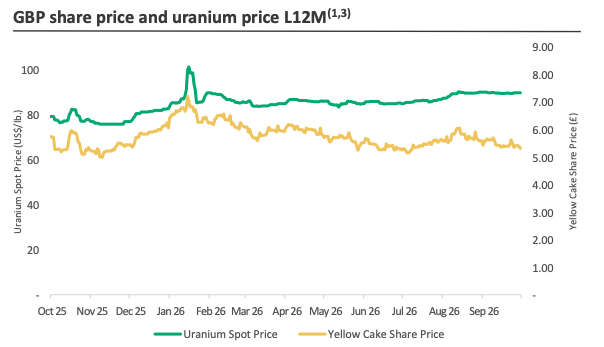
This Uranium storage group announced a Q3 update. They hold 24.3m lb of U₃O₈ in storage vaults in Canada and France. They bought just over 1.16m lb of Uranium from Kazatomprom, the Kazakhstan state mining company. The value of YCA’s Uranium increased by +11% in Q3, to $2.18bn as at 30 September 2026, reflecting the additional 1.16m lb of U₃O₈ they received and the spot price increase +5% to US$89.50/lb. They calculate their most recent NAV on 26th October as £6.65 versus a share price of £5.24p.
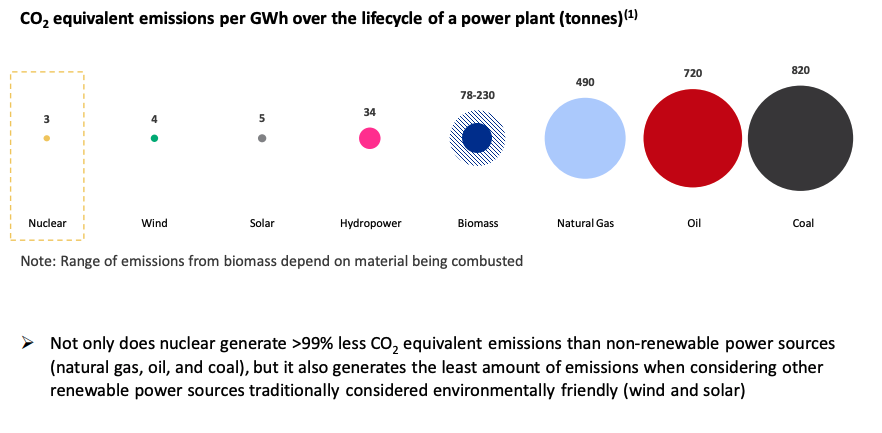
Readers might be unsure about owning a radioactive material. That obviously a legitimate concern, but nuclear power generates the least CO2 equivalent emissions compared to all other power sources.
Background: YCA IPO’ed in 2018 raising $200m, using the money to buy uranium oxide concentrate (known in the trade as U3O8), and then just hold it. The money went to Kazatomprom, the Kazakh state miner that produces more uranium than any single company on earth. There’s no mining, enrichment or processing. The Kakakhs dig up the metal up from a mine underground, transport it over to France and Canada, and then store YCA underground again. I came across Yellow Cake in this series by Blackwood Research, who have a fun series on unusual stocks, including Gulf Keystone and Games Workshop. I’m flagging Yellow Cake as worthy of a few hours of further investigation, but don’t own any myself.
Meanwhile Tether, the stablecoin pegged to the US dollar has amassed over 150 tonnes of gold, stored underground in Switzerland but also owns 210,000 cows — and just as many sheep. Surely “stable” coins should own horses?
Bruce Packard
@bruce_packard
Notes
This article is for educational purposes only. It is not a recommendation to buy or sell shares or other investments. Do your own research before buying or selling any investment or seek professional financial advice.





Bi-Weekly Market Commentary | 28/10/2026 | CRPR, DUKE, YCA | A Death Cross for Halloween
Bruce takes a look at some global indices and copper which all seem to be breaking down, with shorter term moving averages dropping below medium term ones (death cross). Companies covered: CRPR, DUKE and YCA.
The FTSE 100 fell -0.5% to 10,677 over the last 5 trading days. The Nasdaq100 and S&P500 were down less than -1%, as Anthropic filed publicly for an IPO with the SEC. I mentioned a couple of weeks ago that the Brazilian stock exchange had risen +30% YTD, despite weak Chinese economic data. That trend has reversed as Lula defeated Jair Bolsonaro: The Brazilian real (currency) fell -8% and the Ibovespa Index lost roughly -14%, with trading halted as a “circuit breaker”. NB because of those “circuit breakers’, which temporarily close the market, the ShareScope IBOV chart had not updated at the time of writing.
I thought this Hugh Hendry post was very good, suggesting that we’re too focused on US inflation data. Instead, he points out the Chinese 10Y government bond yield is around 1.6%, versus the US at 5%. “Two economic giants, joined by the greatest manufacturing and consumption arrangement in history, now paying radically different prices for ten-year money.” As China has pegged its currency to the dollar, that implies Chinese debt markets are still dealing with their property bubble bursting. The US debt markets are by contrast looking very late cycle, running hot and funding AI capex.
The CSI 300 (Shanghai – ticker 000300) looks far from reassuring. China has been exporting cheaper goods, and deflationary trends, to the rest of the world.
A number of indices have been weak in the last 3 months, including -8.5% for the STOXX Europe 600 banks (EXV1D) and -5% for the SPDR Russell 2000 Small Cap (R2US). Copper (HG1) remains above its 200 day moving average, but the chart (below) looks like it could be forming a rolling top, with the 16 day moving average (red) falling below the 64 day (blue). The same is true of the MSCI World (ACWI) and Nasdaq100 (IXND). A chart with the short term moving average breaking down is often called a “death cross” – which seems appropriate for Halloween.
After Trump started bombing Iran, I raised cash by selling some losing positions (including half my DUKE, see below). My plan was to slowly reinvest as the summer came to an end. Now with Brent Crude at $111 a barrel, and the various ShareScope charts mentioned above breaking down, perhaps a few more months of cautious “wait and see” won’t hurt. I would imagine most readers are UK focused too, but the benefit of ShareScope is data series and charting that help to understand global trends. Worth noting that AIM has been such a poor performer since the pandemic ended, perhaps there’s some shelter from any storm in owning “old economy” UK stocks?
November is a good month for conferences: seeing companies and speakers present and chatting with other investors. First, MoneyWeek Wealth Summit, 6th November in Central London, followed by Mello Events 17th and 18th November in Chiswick.
This week I look at Duke Capital’s curious share price movement and update, followed by Yellow Cake. But I start with James Cropper, the paper commodity, with advanced hydrogen materials division, enjoying a very strong 18 months after several difficult years.
James Cropper H1 Sept Trading Update
Well done to Cockney Rebel who pitched James Cropper on Mello about a month ago. Momentum has continued with a strong H1 trading update “ahead of the Board’s expectations”. The Group’s Paper & Packaging division around two thirds of group revenue (£63m of revenue, but loss making for 4 years between FY Mar 2026 – FY 2022) has been much stronger than anticipated, on both the revenue growth and cost management side.
Around a third of revenue is the Advanced Materials division, which looks to benefit from supplying the hydrogen economy. There’s no update on that division in the RNS, but at the FY Mar revenue was growing at +11% y-o-y, with a very healthy operating profit margin of 24%.
CRPR group FY Mar 2027F Adj EBITDA is expected to be between 10-20% ahead of expectations. This is a capitally intensive business, so ignoring depreciation as a real costs is not helpful, but at least trends are moving in the right direction.
Valuation: The shares are trading on 12.5x PER Mar 2028F, and 7.5x EV/EBITDA. So despite the 6x increase, these don’t look expensive if you assume that EPS of 64p in Mar 2028F is realistic. For context, they achieved EPS of over 50p in 2017, when the shares changed hands at above £19 per share.
Opinion: I last looked at this in August 2024, when the price was 255p, but the chart looked like a falling knife. I said that this “could be an opportunity if investors can time their entry point, but it’s not without risk. I’ve put it on my watchlist, but haven’t bought any.” Since that comment shares fell below 140p in May last year, but have now bounced to 800p.
I’ve mentioned that I keep buying “falling knives”, but ShareScope has the tools to help: here’s YouTube tutorial on how to set up a “golden cross” filter. That is, when a short term moving average rises through a long term moving average. This is not a fool proof, for CRPR the approach would have given a false buy signal at 600p and 300p on the way down, and a false sell signal during the recovery phase at 360p earlier this year. So the golden cross filter is not infallible, but could be a useful starting point, particularly if combined with disciplined risk management – cutting losses when the trade breaks down.
ShareScope tools like this filter can help focus our opportunity space, then combine with fundamental analysis and qualitative judgement, increasing our chances of making money.
Some other ideas: using the golden cross filter, flags other some interesting ideas.
I don’t own any of these. The idea is to highlight ShareScope’s tools and filters, rather than provide tips. Do Your Own Research (DYOR).
Duke Capital Update
The opposite of a “golden cross” is a “death cross” – appropriate for Halloween. An example of which is Duke Capital, with a curious RNS after the share price had already fallen around -15% on no news but heavy volume last week. We can see that from ShareScope’s “Prices” tab (below), where the volume was 9.6m, versus a 3 month daily average of 1.03m. That daily volume compares to a previous maximum volume in that 3 month range of 2.3m shares traded. Interestingly there was even more volume 11.6m shares traded on the following day, when management released an RNS saying: “As the UK market continues to be challenging, we do expect lower recurring revenue to be generated within our UK portfolio in H2 with the key focus of the investment team currently being on improving the performance of the UK portfolio into next year.”
The RNS was combined with a broker update from Cavendish, leaving their forecasts of total cash revenue of £28m FY Mar 2027F unchanged. Last FY Mar 2026 DUKE reported total cash revenue of £28.6m, and recurring cash revenue of £27.1m (so there’s a £1.5m difference explained by exit premiums and cash gains from selling equity investments). DUKE also said in June that recurring cash revenue would be £7m in Q1 to June, then last week confirmed a further £7m in Q2 to September – Cavendish forecasts annualise that to reach £28m – too optimistic given management comments about H2. This doesn’t feel like the kind of market where DUKE will achieve exit premium significantly higher than reported FY Mar 2026, so by implication Cavendish’s forecasts are too high. Possibly management “pull a rabbit out of the hat” and they refer specifically to: “late-stage processes for exits which, if concluded, could have a material positive impact on market expectations for FY27 total cash revenue.”
Duke has been lending to SMEs at around 12% fixed interest rate, with no re-financing risk. You can gain some idea of the portfolio here, note particularly the care homes, Intergrum and Tristone, which make up £43m of fair value, or just under a quarter of £174m of net assets. Duke is a majority shareholder in both Tristone and Intergrum Care, at just over 50%.
The last successful exit, worthy of an RNS was Fabrikat (a UK manufacturer of street lighting columns and guard rails) in March 2024. Fabrikat was sold for £3.9m (equity value), with a realised gain of £1.6m and an unrealised gain of £2.3m. Those gains from investing just £3000 in the equity and the lending Fabrikat £6.2m, which was repaid in full.
Valuation: The shares are now trading on a dividend yield of 13% and a price to NAV of 0.6x. I’m not going to quote a PER, because it seems likely that FY Mar 2027F numbers could be wrong by a wide margin in either direction. Tricky one.
Opinion: I can’t find fault in terms of voluntary disclosure here. It seems like there’s wide variance of outcomes, they could fail to achieve the exits – resulting in a missing FY Mar 2027F forecasts – or they could report some sizable gains if all goes well. I sold half my position in March, worried that the UK economy would suffer from energy price spikes, resulting in bad debts from Duke’s Royalty lending model. I have now sold my other half. My experience with financials (Argentex, but also banks) is to avoid anything that looks “too cheap” and the share price is falling for no obvious reason.
Yellow Cake Q3 Sept Update
This Uranium storage group announced a Q3 update. They hold 24.3m lb of U₃O₈ in storage vaults in Canada and France. They bought just over 1.16m lb of Uranium from Kazatomprom, the Kazakhstan state mining company. The value of YCA’s Uranium increased by +11% in Q3, to $2.18bn as at 30 September 2026, reflecting the additional 1.16m lb of U₃O₈ they received and the spot price increase +5% to US$89.50/lb. They calculate their most recent NAV on 26th October as £6.65 versus a share price of £5.24p.
Readers might be unsure about owning a radioactive material. That obviously a legitimate concern, but nuclear power generates the least CO2 equivalent emissions compared to all other power sources.
Background: YCA IPO’ed in 2018 raising $200m, using the money to buy uranium oxide concentrate (known in the trade as U3O8), and then just hold it. The money went to Kazatomprom, the Kazakh state miner that produces more uranium than any single company on earth. There’s no mining, enrichment or processing. The Kakakhs dig up the metal up from a mine underground, transport it over to France and Canada, and then store YCA underground again. I came across Yellow Cake in this series by Blackwood Research, who have a fun series on unusual stocks, including Gulf Keystone and Games Workshop. I’m flagging Yellow Cake as worthy of a few hours of further investigation, but don’t own any myself.
Meanwhile Tether, the stablecoin pegged to the US dollar has amassed over 150 tonnes of gold, stored underground in Switzerland but also owns 210,000 cows — and just as many sheep. Surely “stable” coins should own horses?
Bruce Packard
@bruce_packard
Notes
This article is for educational purposes only. It is not a recommendation to buy or sell shares or other investments. Do your own research before buying or selling any investment or seek professional financial advice.