
I know this is going to make me sound like an alcoholic, but I rarely drink soft drinks. When a reader requested an overview of the soft drinks sector, I was not, therefore, particularly enthusiastic.
For me, liking the product, or at least seeing its value, is a prerequisite for investment, and, on health grounds, I have not for a long time seen much virtue in soft drinks – even fruit juice.
Soft drinks are getting healthier, though, and there are some very good businesses making them. I have taken the blinkers off and cranked up SharePad to see if we can learn anything about UK listed soft drinks companies.
Sieving for soft drinks companies
Fortunately, they are collected neatly into the Soft Drinks Subsector in SharePad:
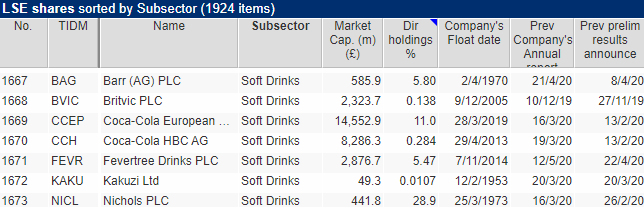
A table of all shares listed on the London Stock Exchange (LSE) sorted by Subsector, reveals seven companies. Source: SharePad.
The biggest by market capitalisation is Coca-Cola European Partners, which is part-owned by the Coca-Cola mothership. It is the World’s largest bottler of Coca-Cola brands including British brands like Schweppes, which Coca-Cola bought from Cadbury in 1999, and Costa Coffee (in a can).
The company operates throughout much of Europe and earlier this year it announced the acquisition of Coca-Cola Amatil, another large bottler operating in Asia.
The size of one part of the Coca-Cola supply chain compared to some of the British soft drink companies in the list puts the market in perspective, particularly as the second largest company in the list is another Coca-Cola bottler, Coca-Cola HBC, which operates in Ireland, Eastern Europe and Russia.
Coca-Cola European Partners claims a 31% UK retail market share of Non-Alcoholic Ready To Drink (NARTD) beverages by value, and a 21% share by volume.
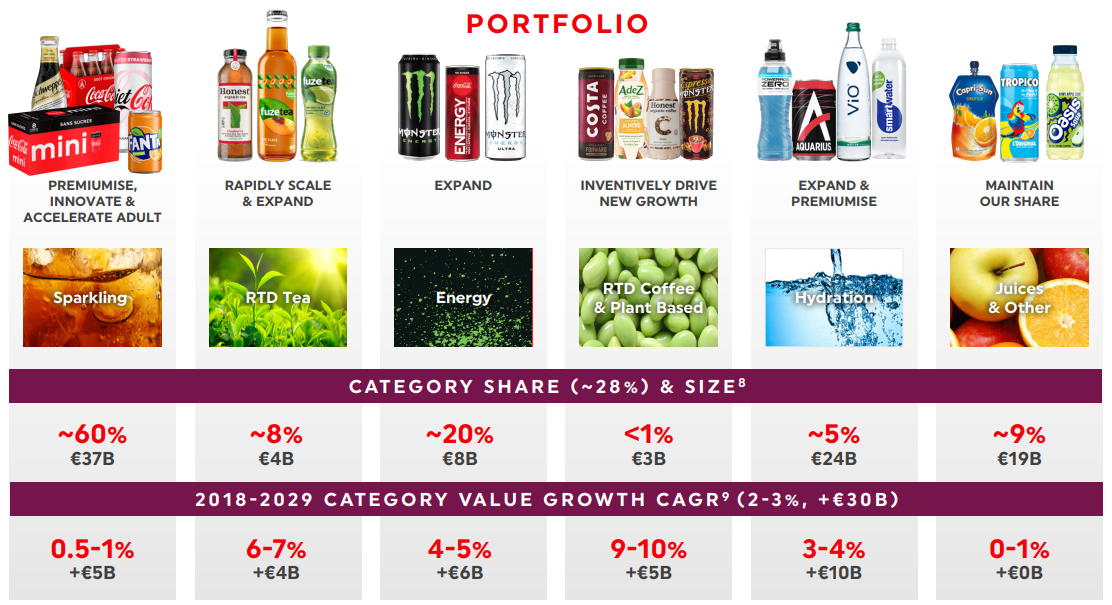
Coca-Cola European Partners bottles monster brands. Category share is share of retail sales by value. Source: CCEP Factsheet (PDF)
PepsiCo, the other soft drinks behemoth, does not have a listed presence in the UK, although Britvic bottles some Pepsi products like 7UP.
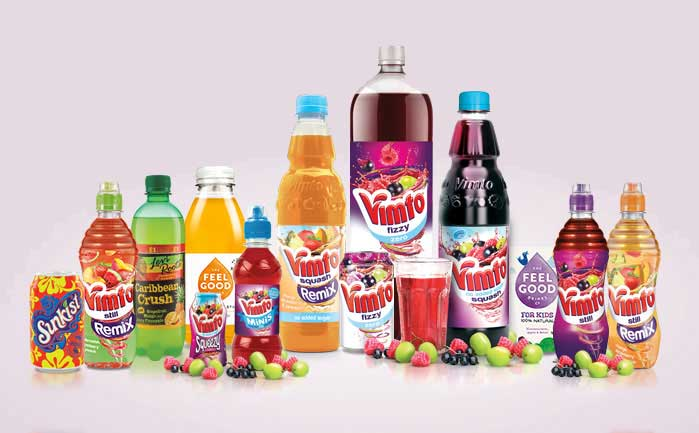
Britvic brings us to the smaller soft drinks companies with a distinctly British heritage, AG Barr, famous for Irn Bru, Nichols, famous for Vimto, Britvic, famous for J2O Tango, and Fever-Tree, which is focused on mixers for alcoholic drinks and is most famous for tonic water.
Nichols is dependent on its most famous brand, which comes in many varieties and is exported around the world. No prizes for guessing what it is. Source: nicholsplc.co.uk
Nichols, AG Barr and Britvic have appeal because they are long established businesses (although Britvic floated relatively recently). At Nichols, AG Barr and Fever-Tree the managers are also substantial owners.
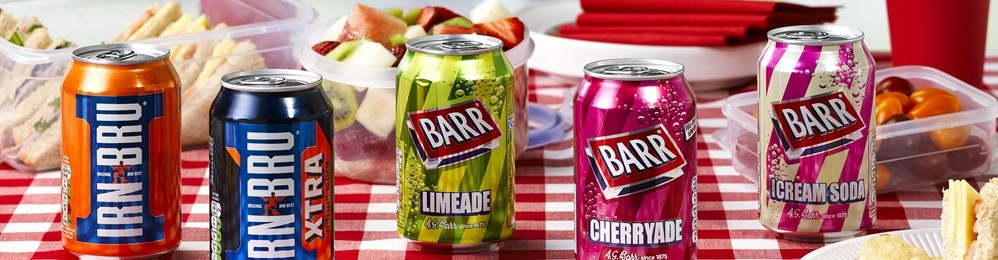
AG Barr’s biggest brand is Irn Bru. Like Coca-Cola and Vimto, the formula is secret. It does not include girders though. Source: a.g.barr.co.uk.
Judging by SharePad’s description of Kakuzi, it is a ringer. Its claim to be in the soft drinks subsector probably rests on its status as a tea grower (as well as avocados, pineapples, macadamia nuts and livestock).
It is not the kind of soft drinks company I had in mind when I started out on this particular adventure.
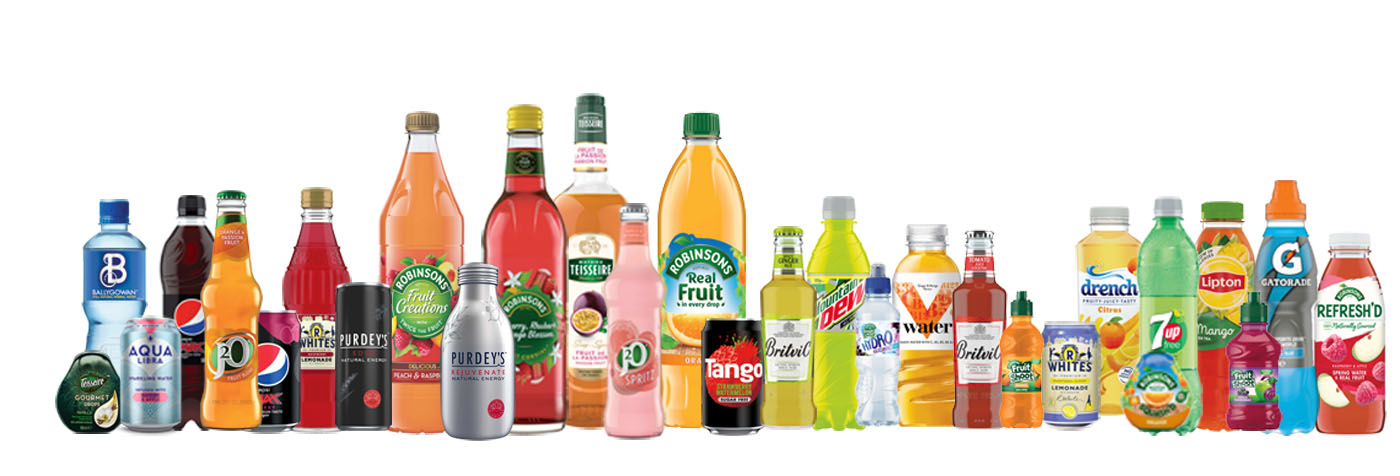
Britvic owns an array of brands including Robinsons, J20 and R Whites. It also bottles Pepsi and 7UP in Britain and Ireland. Source: Britvic, Our Brands in Great Britain
ROCE compared
I think we can put Kakuzi to one side, which means we are down to six London listed soft drinks companies.
Putting the remaining six shares in a portfolio makes the analysis easier. Then we can chart their characteristics using SharePad’s financial charting facility.
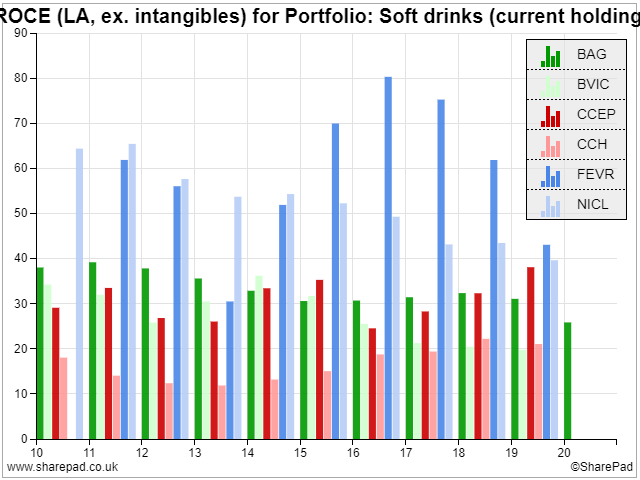
A financial chart showing returns on capital for each of the six companies in my Soft drinks portfolio. To compare all the companies in a portfolio using Financial charts, make sure the portfolio is active and select list instead of instrument in the row of buttons along the top of the chart.
**SharePad & SharePad Pro users can copy my chart setup by following the instruction below this article**
I have reached for Return on Capital Employed because of all the statistics at our disposal, I think it tells us most about a business. The primary purpose of a for-profit business is to generate a return, profit, on the money it has invested, capital employed.
The more return on capital the better, as long as the company is treating employees, customers, suppliers and other people and organisations it comes into contact with well, so they will continue to help it earn outsized profits or at least not try and stop it.
In addition, I have chosen normalised, lease-adjusted return on capital employed excluding intangible assets. It is a bit of a mouthful, but these adjustments reduce disparities due to the way companies account for exceptional costs (and gains), how assets were financed, and whether they were acquired or developed internally.
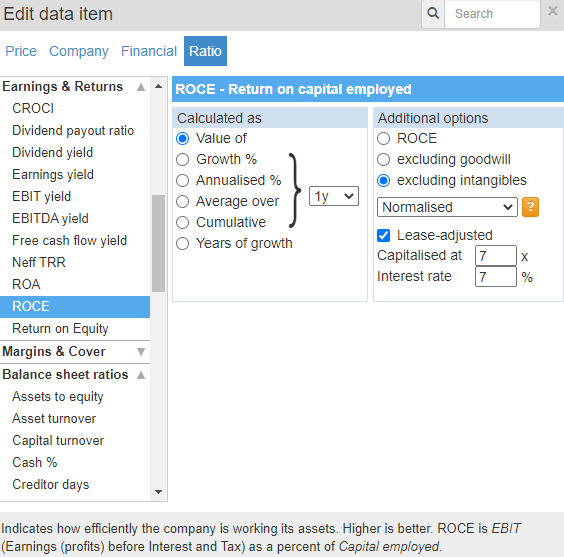
When we choose a data item, we must decide how it is measured. Source: SharePad
It looks as though the soft drinks business is a good one. The standout shares are the blue ones, Fever-Tree, which is highly profitable but a bit erratic, and Nichols which is highly profitable but less so than it once was.
The greens, AG Barr and Britvic are no slouches, and the big surprise, to me at least, is the reds. Even the Coca-Cola bottlers earn decent returns on capital, especially Coca-Cola European Partners.
Considering Coca-Cola owns the brands you might think it would take much of the profit, but the relationship may be more equal than that. Given the scale required to bottle and distribute Coca-Cola across a continent, it is hard to imagine there are alternative bottlers Coca-Cola could just switch to.
Growth…
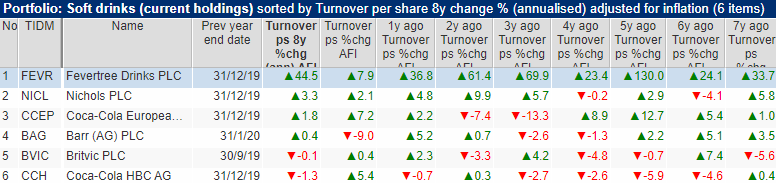
Inflation adjusted growth in turnover per share. The first column of turnover growth shows the annualised turnover growth per share over the last eight years. The columns to the right show turnover growth in each of those years. Source: SharePad
The fact that Fever-Tree has achieved eye-popping rates of growth since it floated in 2014 in addition to being the most profitable soft drink company goes a long way to explaining its popularity among investors. The company has been profiled by two of my co-contributors at SharePad, Maynard Paton and Bruce Packard.
Otherwise, only Nichols has really grown convincingly, at an annualised rate of 3.3% above inflation over the period in question.
Historic growth in turnover is not the be-all-and-end-all. Companies can grow profit without growing turnover, and turnover can be reduced by divestments and improved by acquisitions which do not necessarily reflect how well a business is performing.
And what might be stopping it…
Nevertheless, if we are to invest in companies that have struggled to grow in the past, we need to understand the reasons why and what might change in the future. Though companies can cut costs to make more profit, it is hard to sustain profit growth for long periods of time without revenue growth.
Fever-Tree is a special case, a new premium brand that has piggy-backed on the popularity of gin and caught the public imagination. This may have allowed it to rise above wider trends holding soft drinks companies back.
It seems likely that the justifiable demonisation of sugared water because it rots our teeth and makes us fat has affected sales and forced soft drinks manufacturers to innovate products made from healthier ingredients. These formulations may not be as popular and as profitable as drinks pumped full of sugar have been.
There has also been an explosion in independent and supermarket own brands. People may be less loyal to big brands than they used to be, and while individually few of the challengers may grow to rival established brands, collectively perhaps they already do.
Investing for the future?
How brands respond to challenges like these will determine their suitability as investments for the future.
Though return on capital at Fever-Tree and Nichols, the companies that have grown profitably, has declined in recent years, profit margins have remained high.
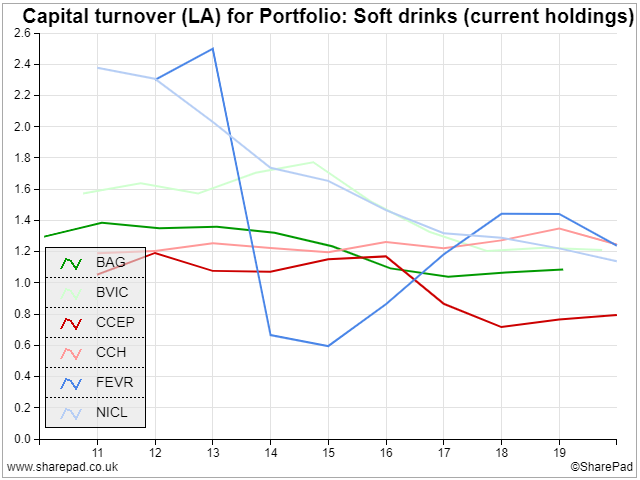
That puts the spotlight on the other ratio that explains return on capital, the ratio of turnover to capital (capital turnover), which has declined.
Return on capital is the product of the profit margin and capital turnover. For an explanation see this article on DuPont analysis.
**SharePad & SharePad Pro users can copy my chart setup by following the instruction below this article**
It looks as though Nichols and Fever-Tree are using more plant and equipment to generate turnover and while it is disturbing to see any chart sloping downwards, this is not necessarily a bad thing.
Companies invest in new capital to increase capacity or provide the facilities to produce new products, which can reduce their capital efficiency temporarily.
Of course, there could be something else going on, but I find it somewhat reassuring that the companies that have grown and earned the highest returns appear to have increased investment.
Richard Beddard
Contact Richard Beddard by email: richard@beddard.net or on Twitter: @RichardBeddard
**Import Richard Beddard’s custom Financial charts**
Follow the instructions below to import the custom Financial charts used by Richard in this article straight into your own SharePad
- Open SharePad
- Open the Chat room window:
- Desktop: Click on the Chat room button (The speech bubble icon in the top right hand corner of SharePad)
- IPad / Mobile device: Click on setting menu (cog symbol in top right hand corner of SharePad) and select ‘Toggle chat window’
- The chat room window should appear in the bottom left hand corner.
- At the top right of the chat room window – click on ‘Change’ followed by ‘Search for a chat room’
- Type “Richard” in the search box and shouldn’t take long to see “Richard Beddard’s Financial Charts” appear below – click on this and hit the ‘select’ button
- The ‘Richard Beddard’s Financial Charts’ chat box will open and in it you will see at the start of this chat that Richard has kindly shared the charts mentioned in his article. (NOTE: you may need to click “Show earlier messages” at the top of the chat window to display all of the charts)
- Click on the Green download arrow next to each chart you wish to download. SharePad may ask you if you wish to “Change current share to see this downloaded chart?” – This just means it will select the share attached to Richard chart before it opens so, click ‘Confirm’.
- Once the chart opens, in the bottom left corner of your Financial chart window you will see a red triangle with the words “Chat chart” – click on this triangle NOTE: Do not click on ‘?’ in Triangle this will only take you to related help.
- You will then be asked “Would you like to import this chat chart into your settings?” – click confirm.
- The custom chart has now been added into the “Setting” menu at the bottom of the financial chart window for you to open whenever you like.
- If you wish to rename the custom chart in the “Setting” menu just open the setting menu and near the bottom of the pop-up menu you will find “Rename this setting”.
This article is for educational purposes only. It is not a recommendation to buy or sell shares or other investments. Do your own research before buying or selling any investment or seek professional financial advice.


