
The conclusion of my last article on finding companies with strong finances contained two caveats. Companies with seasonal cash flows can look like they have strong finances at the end of the financial year, when they report, but be weaker at other times during the financial year. Also, strong finances are not necessarily the result of cash generated by a strong business. A company may have lots of cash, simply because it has raised money from investors. Today we will incorporate interest cover and the share count into a filter that may bring us closer to the holy grail: financial fortresses.
My inspiration for this article is Howden Joinery, a company I admire. Howdens supplies fitted kitchens to small builders, and its annual report includes the following statement:
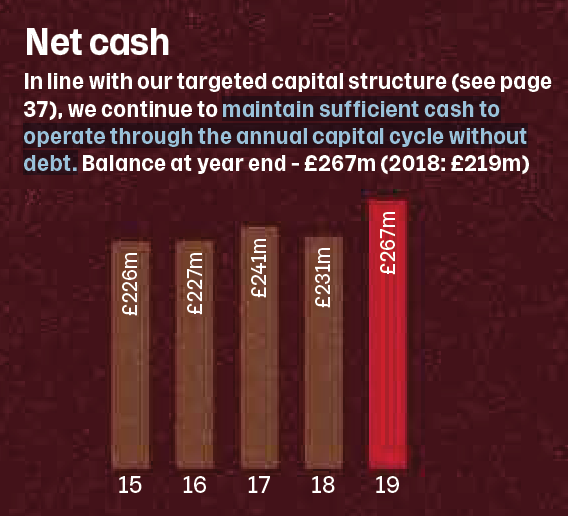
Source: Howden Joinery Annual Report, 2019
Presumably, lots of people want new kitchens in time to roast the Christmas turkey because Howdens’ goes into overdrive in “Period 11”, the last weeks of October and the beginning of November. Sales are high in Period 11, which means the company must fund twice as much stock as usual and that puts demands on its finances because Howdens does not ask customers to pay before they pull away from the depot with a van load of cabinets. One of the reasons Howdens is the dominant supplier of kitchens to the trade is that it allows builders time to fit the kitchen and be paid for the job, before they pay Howdens. A financially weaker business would not be able to fund its customers “through the annual capital cycle”, so Howdens has found a way of turning strong finances into a competitive advantage.
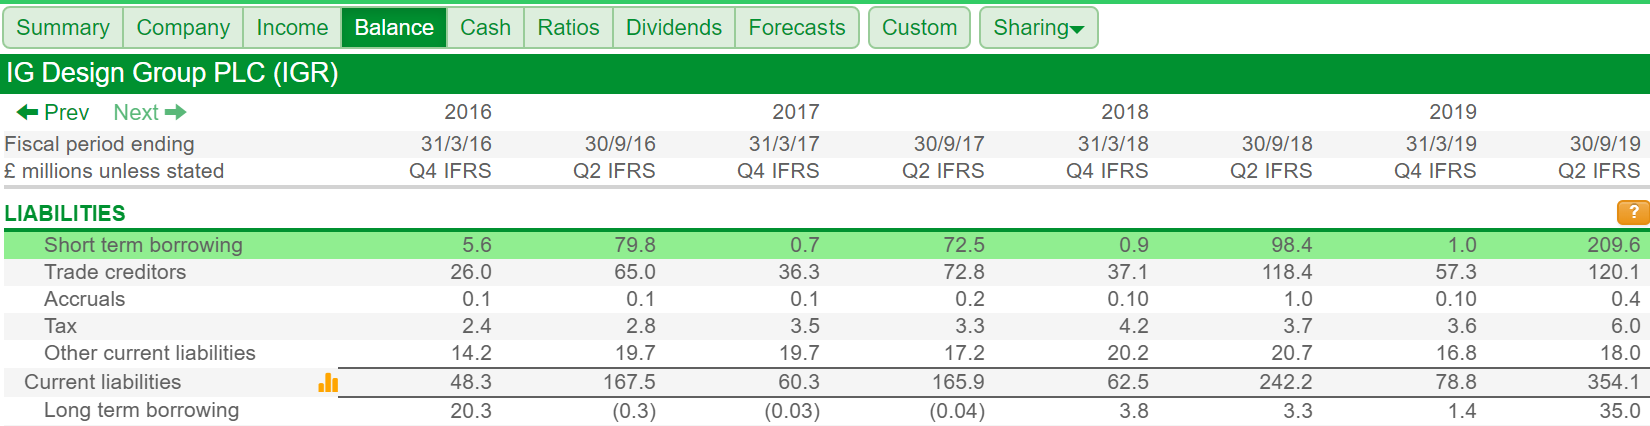
IG Design Group, another admirable business, is even more seasonal. It sources and makes greetings cards, giftwrap, Christmas crackers and an increasing range of stationery and giftware. Design Group has taken great strides to reduce its year-end long-term borrowing, but the year-end in March is after its peak selling period (the run up to Christmas) so the company reports just after it has received lots of cash, and just before it buys in products and raw materials to ramp up production and distribution for the following year. I don’t know if borrowing peaks in September, when Design Group publishes half-year results, but you can see the seasonal fluctuations in short-term borrowing in the Balance tab in SharePad, by comparing the figures for each March result with the subsequent September:
Unlike Debt to Capital, which like other gearing ratios tells us what proportion of a company’s capital or assets are funded by borrowing, the interest cover ratio tells us how affordable the debt is. It compares profit (earnings before interest and tax) earned in a year to the net interest paid during the year. Net interest is interest paid less interest earned, for example from cash deposits at banks. If a company earned £10m profit and paid £1m in interest (net) in its most recent financial year, its interest cover is 10. If profit were to halve, it could still pay the interest comfortably enough (assuming a stable interest rate), because profit would be five times its net interest payments.
As Design Group paid off its long-term borrowings, the company’s interest cover improved as we can see in SharePad’s ratios tab:
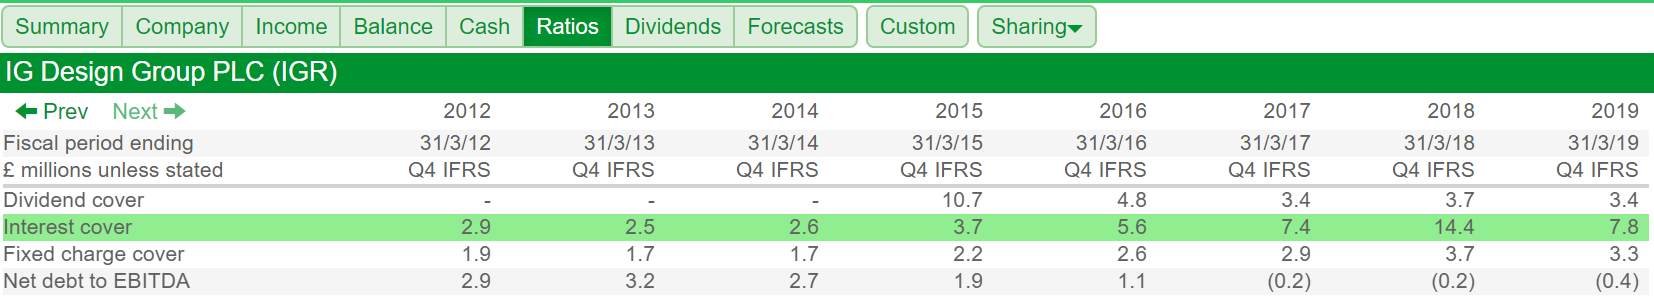
By 2018, interest cover was 14.4, and Design was beginning to look like a financial fortress but since then the company has made a couple of big investments, funded by increased borrowings and funds from investors. Interest cover fell to 7.8 in 2019.
The higher interest cover, the more affordable the debt and, crucially, interest cover reflects the amount of interest paid throughout the year, including times when the company was more indebted than it was at the year end. It also tells us the business was profitable during the year, and in such cases a good financial position may be the result of a good business.
To reassure us about the source of a company’s strong finances we can determine whether it is likely to have raised money from shareholders recently by comparing the amount of shares in issue in its most recent financial year to the amount of shares in issue a number of years previously.
A financial fortress filter
I have combined these two statistics in the filter and table below:
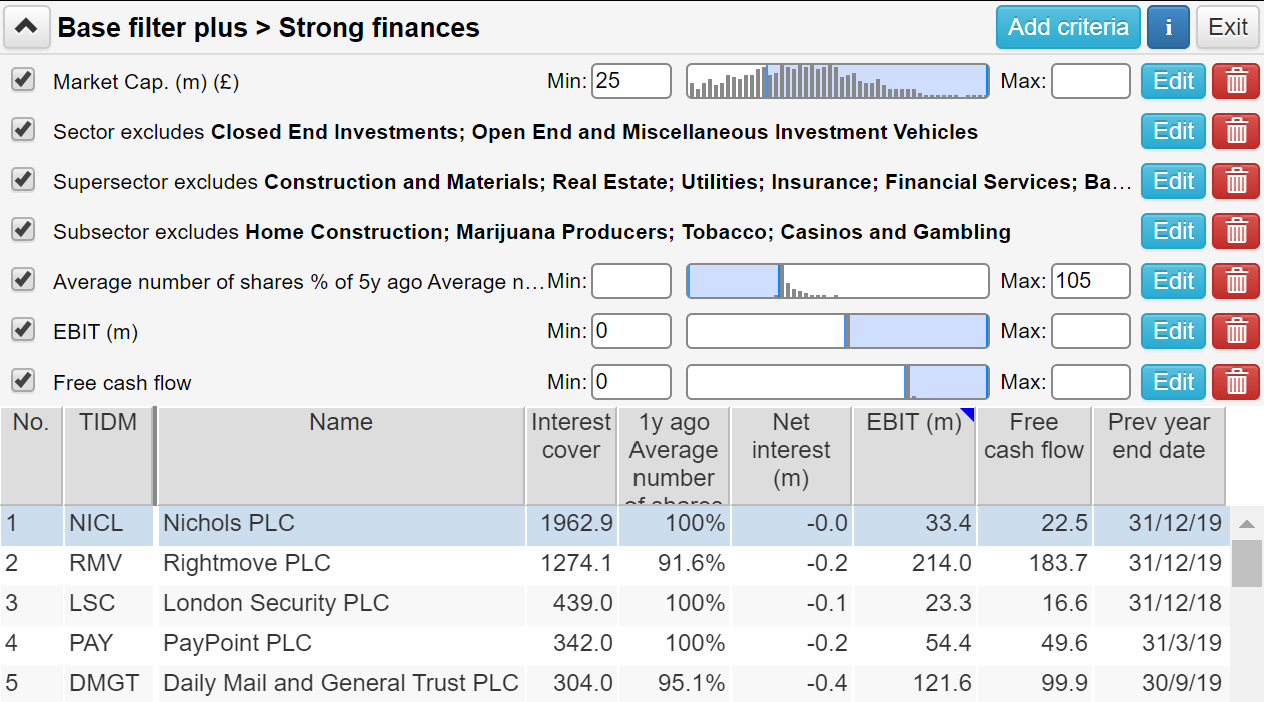
To create this filter, I copied my Base filter, which excludes really tiny companies and companies in sectors I do not research.
(You can find this base filter in the Filter Library in SharePad. Simply go to: Filter -> Apply filter -> Library -> ‘Richard Beddard 15/04/20: Filtering for financial fortresses’.)
I then added three new criteria. The first calculates the average number of shares in issue in the most recent financial year as a percentage of the average number of shares five years earlier. If the share count has increased by more than 5% (it is more than 105% of what it was five years ago) the share will be excluded from the filter. We also need to make sure the company made a profit in the year, for reasons I will explain below.
When we create a filter in SharePad, the software makes a table for us automatically using the filter criteria. To make things clearer, I have excluded some of the filter columns in the table (the ones relating to my Base filter) and included additional columns of data by creating a new table in settings at the bottom of the screen:
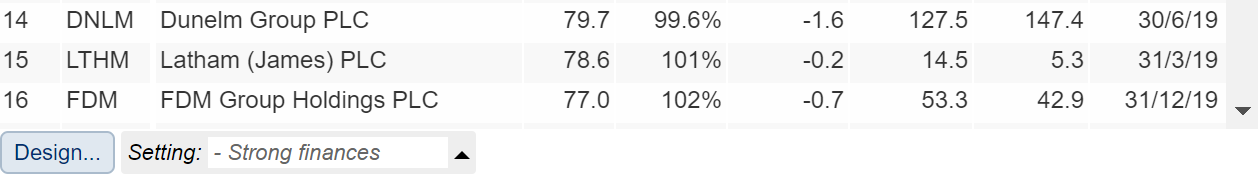
The first column in the table is interest cover, which I have used to sort the table. The companies near the top of the list have high levels of interest cover. But we are also interested in the companies at the bottom of the list, not because they have low interest cover, but because they have no interest cover.
There can only be two reasons for this, either net interest paid was zero or positive (i.e. the company earned more interest than it paid), or the company made a loss. A surfeit of interest is an even stronger indicator of financial strength than a high level of interest cover. In 2019, Howdens paid £0.4m in finance costs (relating to its pension fund rather than bank debt) but earned £1.1m in interest, giving net interest paid of £-0.7m. I didn’t include interest cover in the filter because filtering for high interest cover would have excluded these potential gems.
We don’t want these results polluted by loss making companies, which also have no interest cover, so that is why the filter requires profit (EBIT) to be positive.
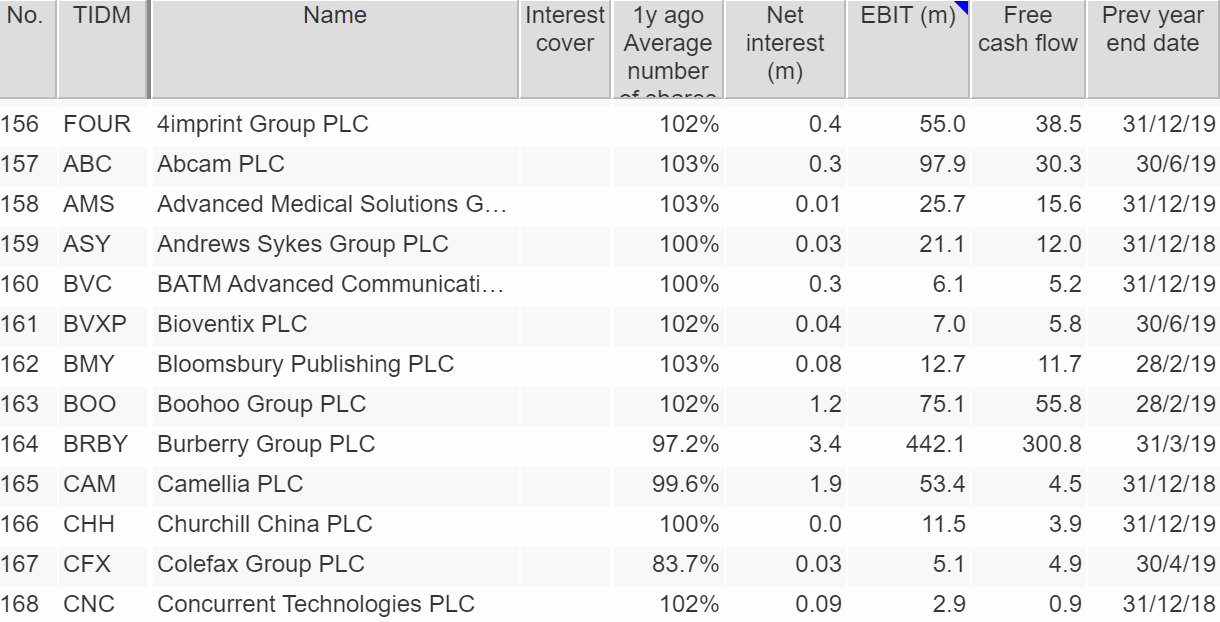
The bottom of the list, therefore, is even more interesting than the top of the list! Here are the first of them, the A’s to C’s:
My kind of share
I either own these shares (Bloomsbury Publishing and Churchill China), have owned them (Colefax, Camellia), have come close to owning them (Abcam, 4Imprint, Andrews Sykes, Bioventix, Burberry), or have no idea how they have evaded me! These are my kind of share, and I like the economy of the filter too: Just two statistics, interest cover, and the change in the share count, are doing the heavy lifting.
The other columns are there to show us what is going on. Net interest (m) and EBIT (m) are the components of interest cover. Free Cash flow is perhaps the sternest test that a company is actually making money, so I look at that too.
Finally, I have included the previous year end date because of the introduction of a new accounting rule, IFRS 16. This requires companies to count their operating leases as assets financed by borrowing and apportion part of their rental payments to depreciation of the rental asset and part to interest.
A twist in the tale
Companies with latest financial year ends in 2019 (most companies) will probably not have reported full-year results under the new accounting standard, which is only compulsory from 2020.
But as 2020 and 2021 progress, more and more companies will conform. Generally speaking, their interest cover will fall, since most companies lease some property that must now be accounted for as debt.
This is a good thing, it will make comparing companies that predominantly own their assets and companies that rent more meaningful. But until all companies report to the same standard it introduces a new kind of cloudiness – between companies that report under the old standard and companies that report under the new one.
In the meantime, we can check the output of the filter for hidden debt.
Richard Beddard
Contact Richard Beddard by email: richard@beddard.net or on Twitter: @RichardBeddard
This article is for educational purposes only. It is not a recommendation to buy or sell shares or other investments. Do your own research before buying or selling any investment or seek professional financial advice.


