
Funny thing (peculiar, not ha! ha!). Search SharePad news for the phrase “strong balance sheet” and there are dozens of companies every day confirming their finances are strong as they reflect on the prospect of reduced, or in some cases, no revenue for a while.
Search SharePad news for the phrase “weak balance sheet” though and there are only a few investment companies per month explaining why they have sold shares in companies with poor finances. Evidently, a weak balance sheet is something businesses don’t want to confess to, and perhaps we need to determine for ourselves whether companies we own, or might own, have strong balance sheets.
If the worst happens and a company is unable to bring in more cash than it spends, it must rely on its own resources as it muddles through, and the goodwill of lenders, which is why, in their stockmarket updates, virus stricken firms are talking about cash balances and “financial headroom”, how much more they can borrow in principle under their existing agreements with banks.
In these circumstances, companies with lots of cash and little debt are most likely to survive, and ultimately prosper.
Debt to capital
Sharepad has numerous ways of measuring a company’s indebtedness, but my favourite is debt to capital.
To explain why, let’s take a look at the components of debt to capital, which are total borrowings as a percentage of capital employed. These are the options SharePad offers when we add a new column or create a filter:
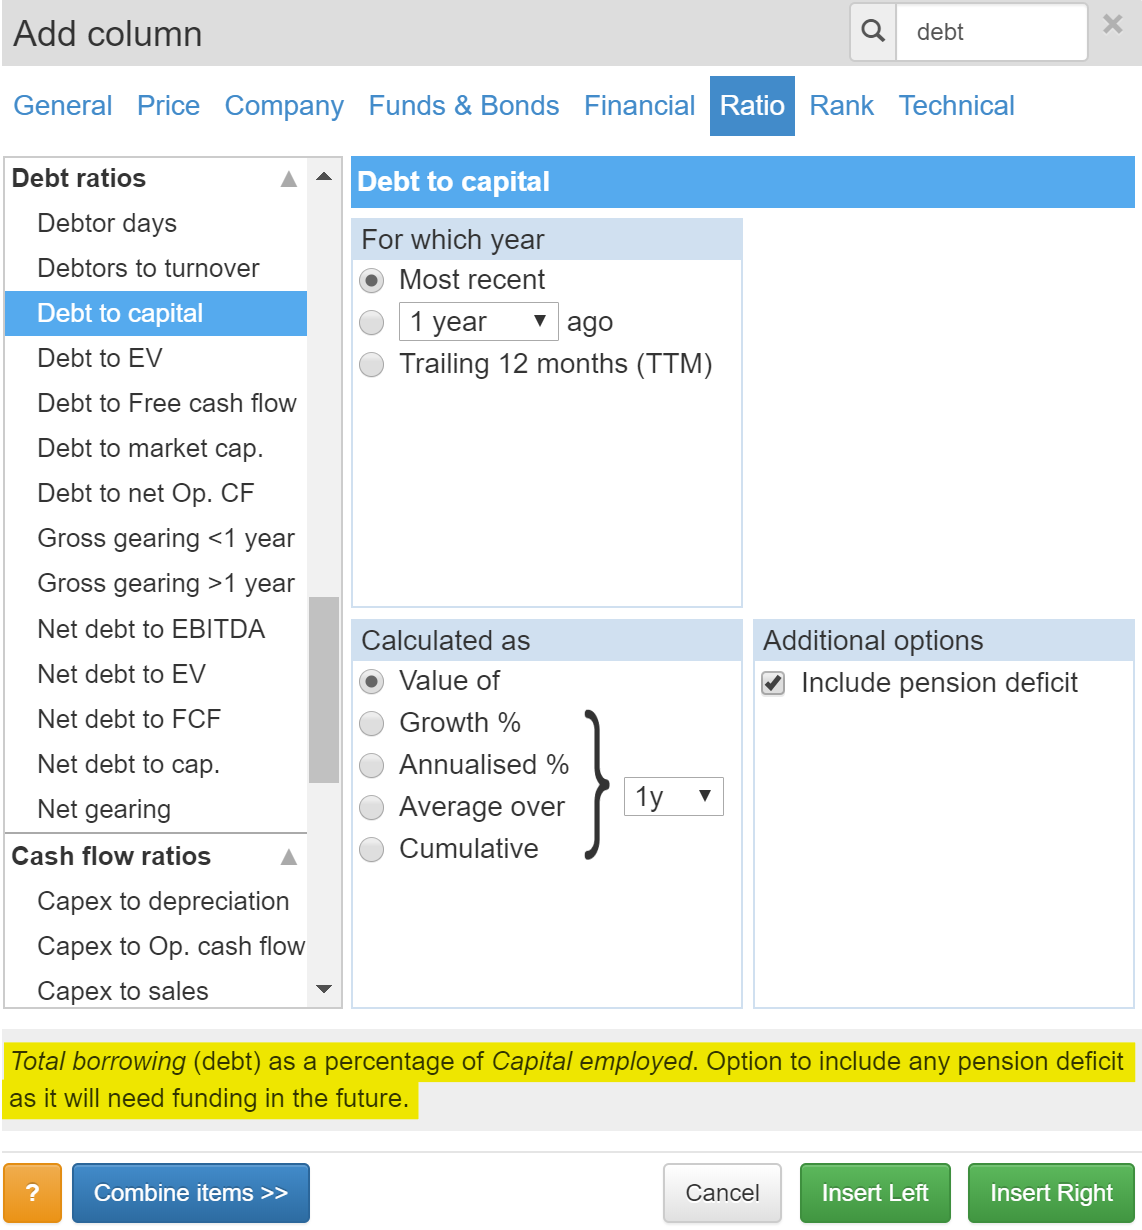
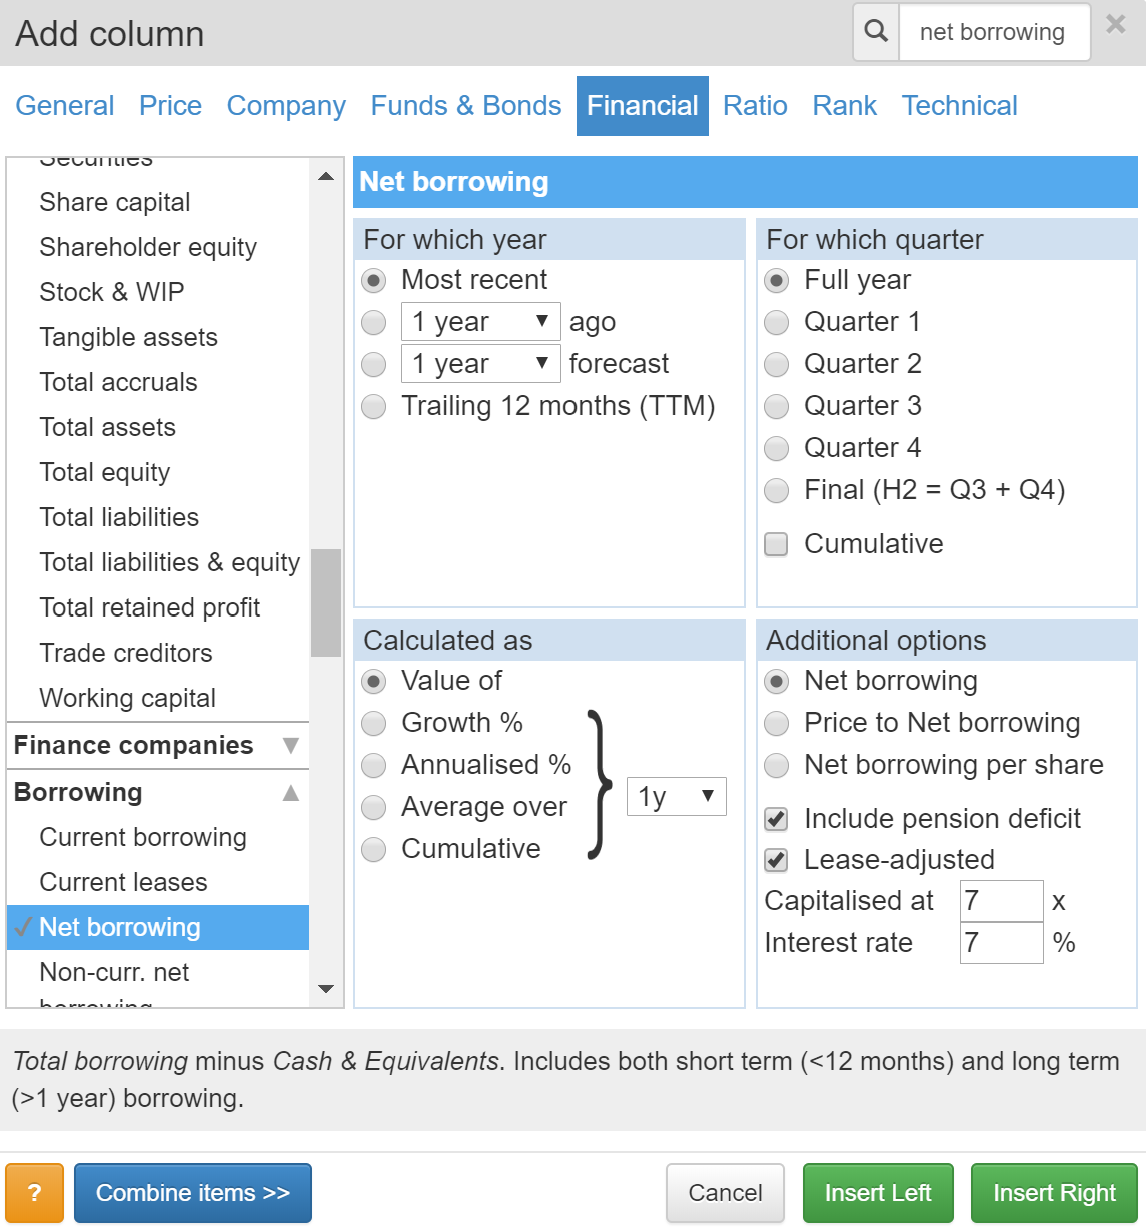
Total borrowing is the sum of short-term borrowing (principally overdrafts, and loans repayable within one year) and longer-term loans, but I have chosen to include a company’s pension deficit (if it has one) so our definition of debt is a more comprehensive measure of a company’s financial obligations. The deficit is money owed to the company’s pension fund.
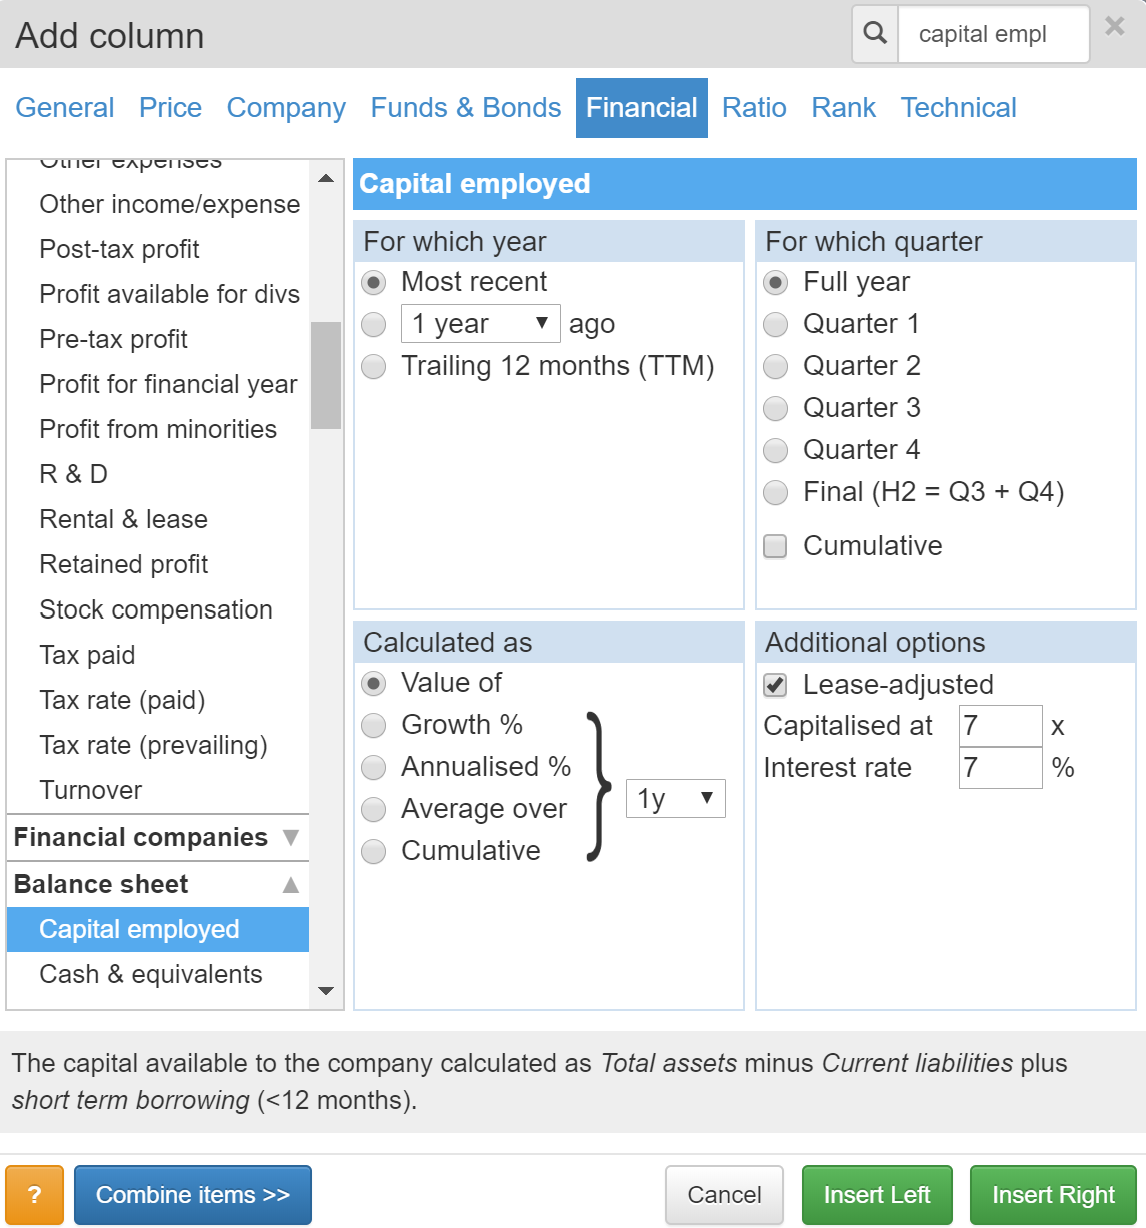
Capital employed is a measure of the funds used by a business to generate a profit. It’s total assets minus current liabilities plus short-term borrowing. Total assets is the value of everything the company owns, stock, buildings, equipment and so on. These assets are funded by liabilities, which are what the company owes to lenders, and equity belonging to shareholders. The value of total assets and total liabilities must balance, which is why the financial statement that records them is commonly known as a balance sheet.
In a sense, total assets is the capital employed by a business, but most definitions exclude non-interest bearing capital employed. Think of it this way, at any point in time companies will owe suppliers (trade creditors) money because they do not pay invoices immediately, employees will have earned part of their bonuses already, but they won’t be paid until the end of the year (a liability accounted for in accruals), companies will also be accruing a tax liability to be paid later. Liabilities like these are obligations companies will have to pay but unlike bank debt which comes at a cost (interest), these liabilities are free capital.
Debt to capital, therefore, tells us how dependent a company is on external finance (debt in one form or another). The more dependent it is, the more uncertain its prospects when business dries up.
We can use the debt to capital ratio in tables to check the shares in our portfolios or watchlists, or in filters to find companies. If the percentage of debt to capital is zero it means a company has no borrowings. The higher the number, the less conservative the financing.
I use a more refined measure of debt to capital (akin to the one described below), and very rarely own companies with a debt to capital ratio of more than 50%. Typically, companies in my portfolios have no debt, or much lower debt to capital ratios…
A more refined net debt to capital ratio
The standard debt to capital ratio can be enhanced by adjusting it for:
Operating leases. This is another kind of financial obligation, owed to the owners of property and equipment rented by a company. Like the pension deficit we can add the lease obligation to debt and also to capital employed. We include these financial obligations because there are costs, akin to interest costs, associated with them.
Cash. Companies sometimes maintain high levels of cash because they are saving for a rainy day. These companies are in a stronger financial position, so we can net off the cash against the debt.
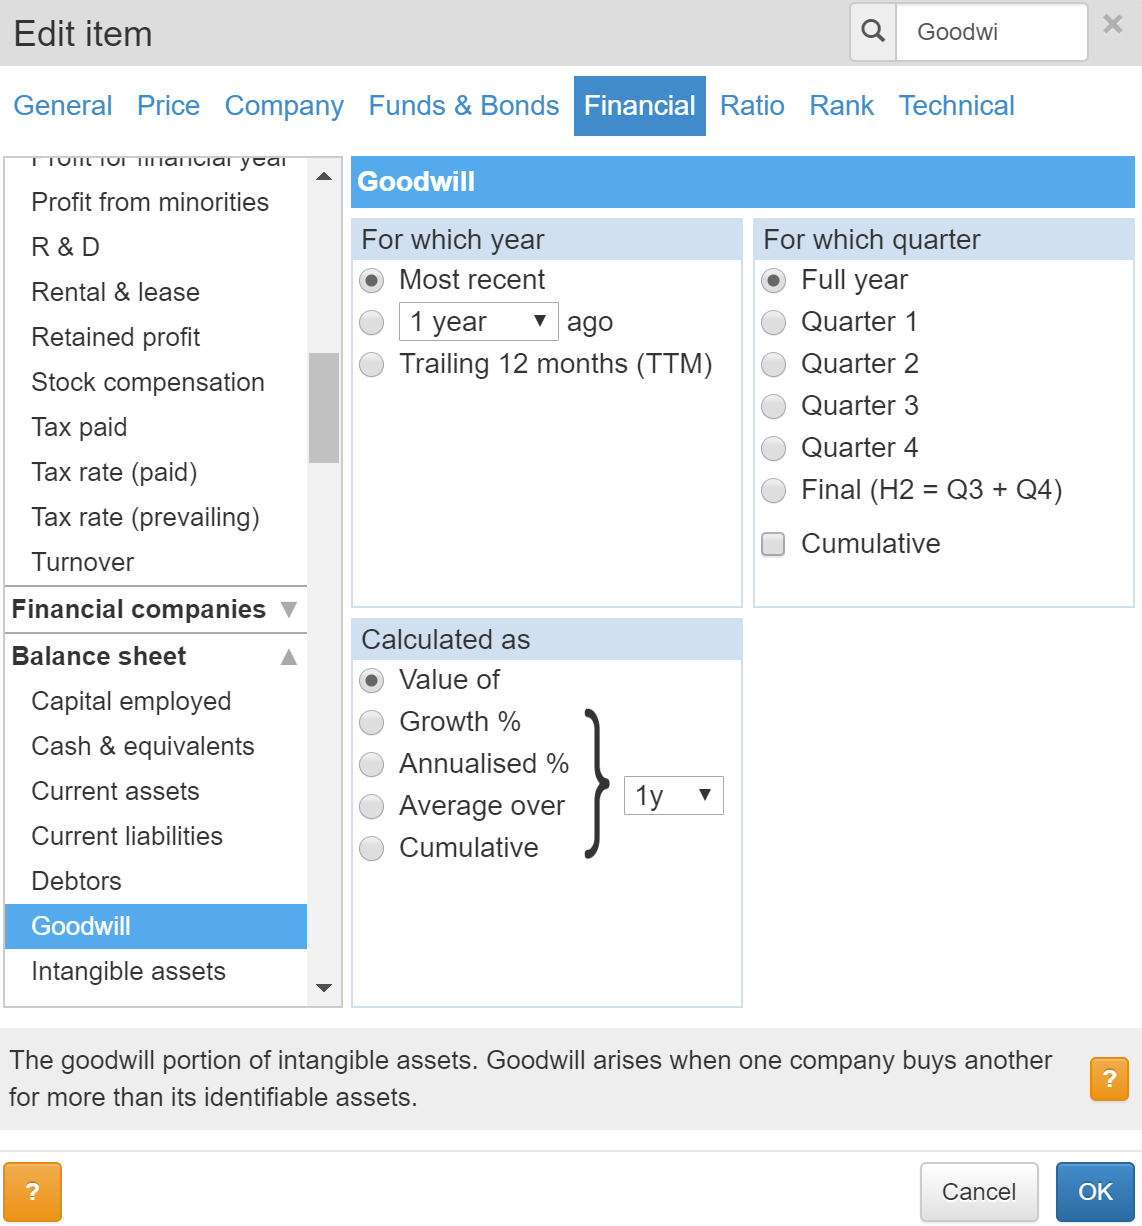
Goodwill. Goodwill is an historical use of capital: the extra paid by a company when it acquires another company over the value of its net assets. When companies get into difficulty the goodwill is often written down, reducing total assets and therefore capital employed. To be conservative and see how dependent a company’s operations are on debt, we can deduct goodwill from capital employed.
Sharepad can do most of the work to calculate this refined ratio, but we’ll need to do the last bit of arithmetic in a spreadsheet. To collect the data, we’ll create a table we can apply to any list of shares, for example a portfolio or the results of a filter.
Apart from the name of the company, the table needs two columns of data:
1. Net borrowing (lease adjusted, including pension deficit)
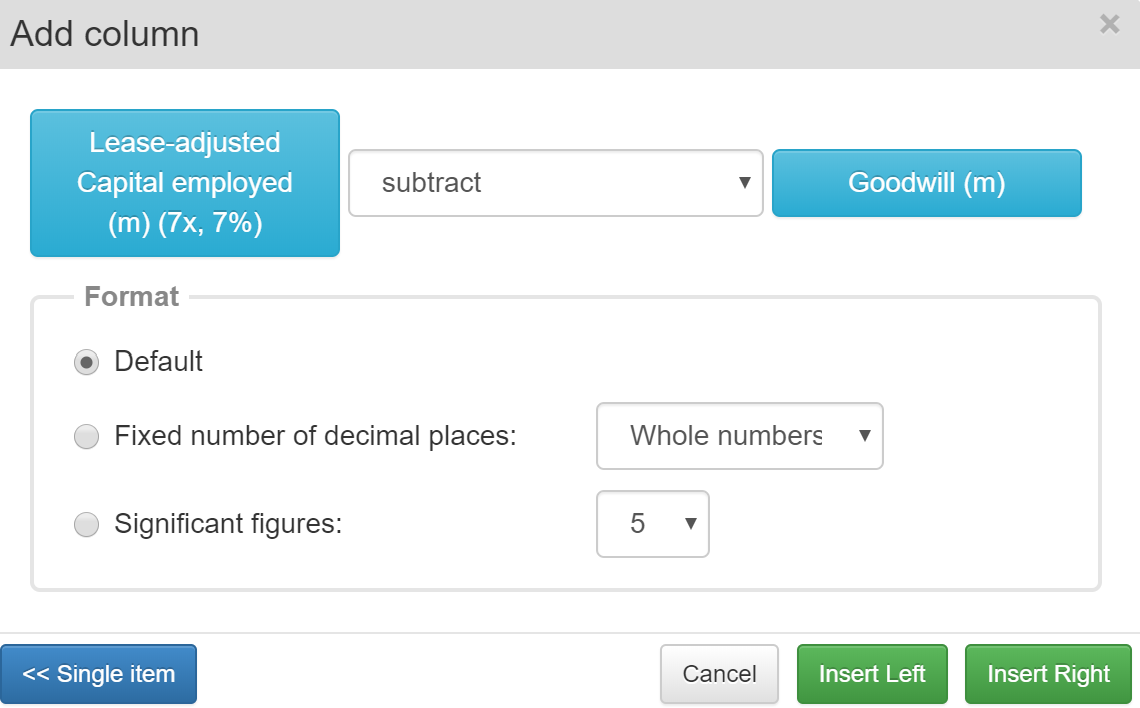
2. Capital employed (lease adjusted) subtract goodwill. This column is the result of a combination of the two items. To combine items, we need to select the first item, in this case capital employed:
Now instead of clicking one of the green Insert buttons, we click the blue Combine items >> button.
The screen should look like this:
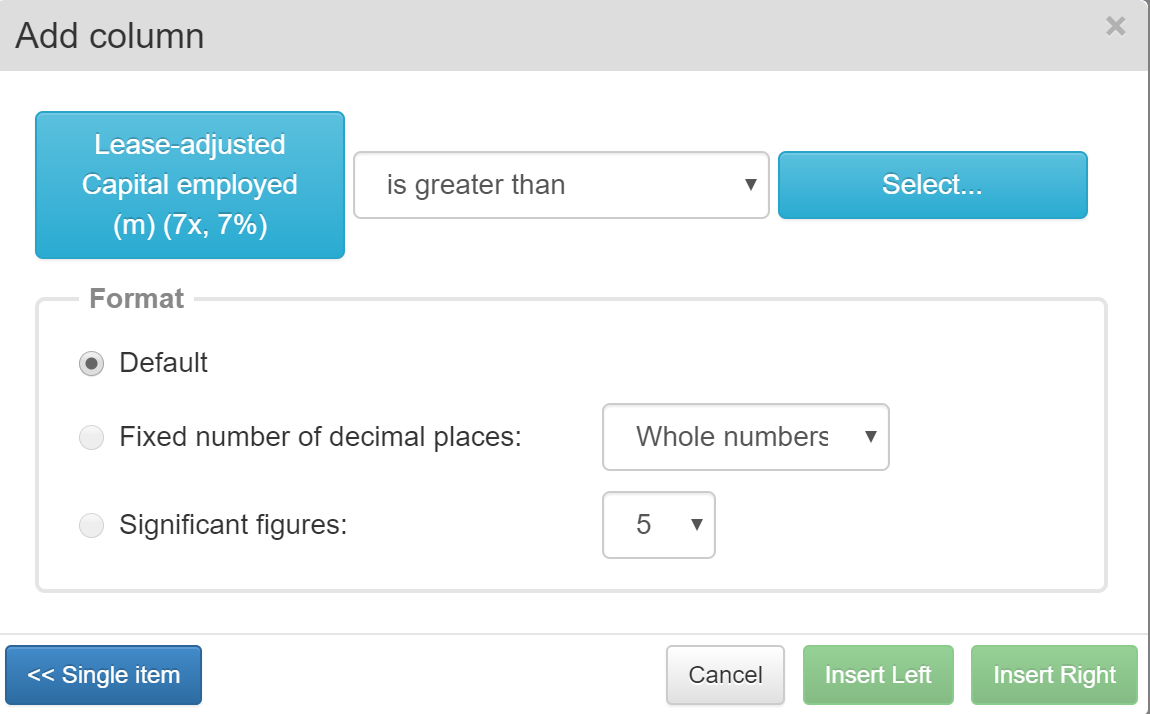
We need to subtract goodwill from capital employed by changing the operator from is greater than to subtract. We then click on Select… to specify it is goodwill we wish to subtract:
When we click on OK, this is the combination we should see:
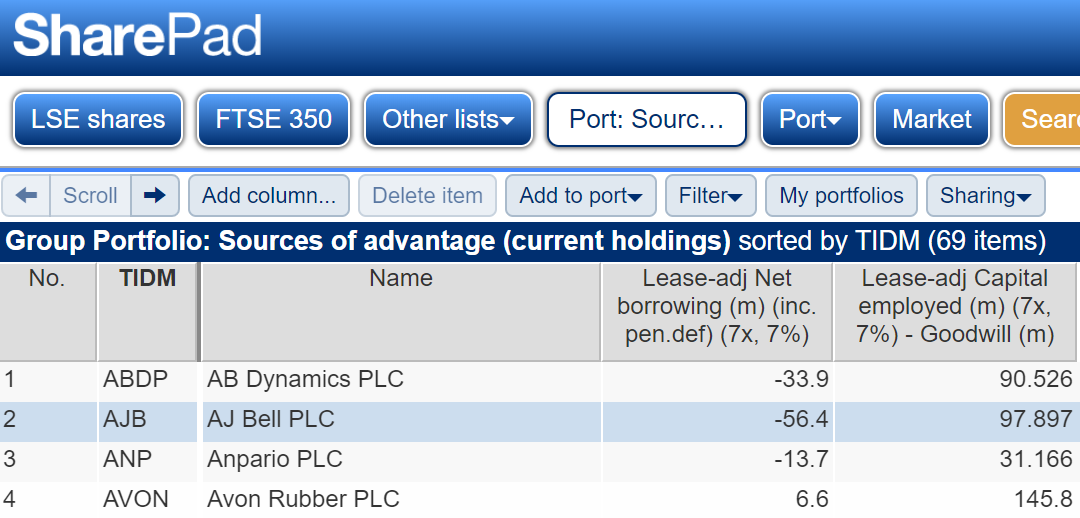
And when we insert the column, our table will be complete. I have chosen to apply this table setting to one of my watchlists, a list of companies that I believe have competitive advantages (but that is incidental, we could apply it to any list):
Here are the A’s:
Next we click on Sharing, the last item in the pale blue menu above the list, and then Export table…, so we can work out net debt as a percentage of capital employed in a spreadsheet:
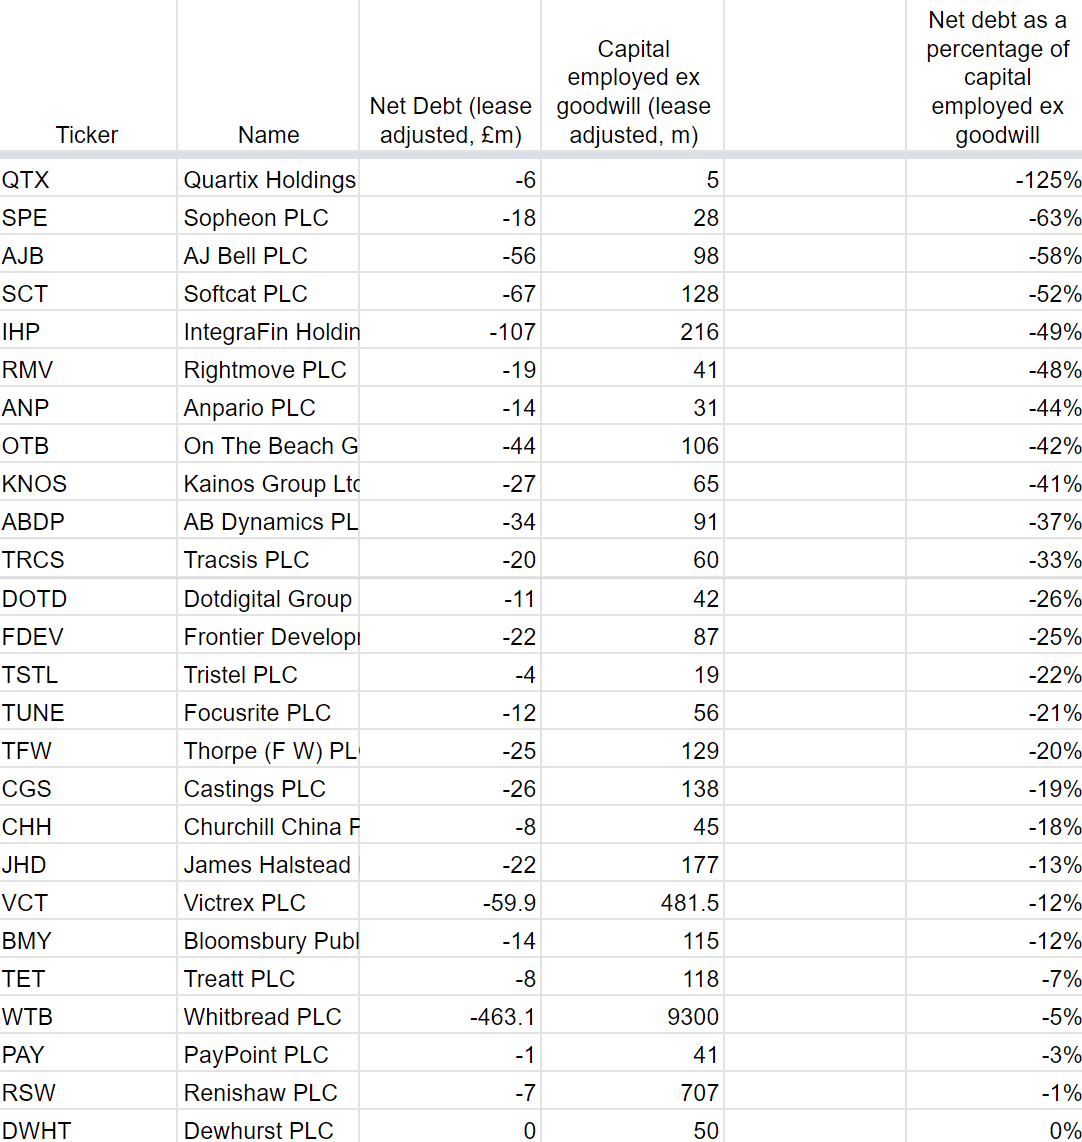
The four columns on the left hand side are the data from SharePad and the column on the right divides the third column (net debt) by the fourth column (capital employed) to give us the more refined net debt as a percentage of capital employed figure.
I have sorted the table to show the least indebted companies first. The numbers are all negative because most of these companies have no or modest amounts of debt and lots of cash (i.e negative net debt or net cash). Space precludes a screenshot of the full list, which includes indebted companies, but you can see all the companies in my spreadsheet here (you can also make a copy of the spreadsheet for your own purposes).
A pair of caveats
The debt to capital ratio in any of its guises should help us find safer companies to invest in and detect weaker shares in our portfolios and watchlists.
No ratio is infallible though, and in common with other measures of financial gearing, debt to capital only provides us with an indication of the company’s financial strength at the end of the financial year. Levels of cash and debt can vary considerably during the year, especially for seasonal businesses, and companies often choose a year end that will show their finances in a good light.
A strong balance sheet is not necessarily the mark of a good business, we need also to consider how the balance sheet came about and whether the company will ever make good money. For example, a company that has just raised money from shareholders might have a strong balance sheet but it may not have made good money in the past, and it may not spend the cash wisely in the future.
For more on using SharePad’s built in ratios to judge a firm’s balance sheet, see here.
Richard Beddard
Contact Richard Beddard by email: richard@beddard.net or on Twitter: @RichardBeddard
This article is for educational purposes only. It is not a recommendation to buy or sell shares or other investments. Do your own research before buying or selling any investment or seek professional financial advice.


