
‘Run your winners’ is popular stock-market advice.
Great companies often remain great investments for a lot longer than most people expect…
… and can deliver life-changing rewards to anyone who refrains from selling out too soon.
Where can we find potential winners to run? I thought the best performing shares of 2019 would provide a good starting point.
I then trimmed the 2019 winners by rejecting those that did not appear to be great companies. I screened on forecast earnings growth, dividend history and net cash to leave us with a higher-quality shortlist.
The exact SharePad criteria I used were:
* 2019 share-price performance of at least 0%;
* Forecast earnings per share growth of at least 0%;
* A minimum 15-year history of dividend payments, and;
* Net borrowing of no more than zero (i.e. net cash).
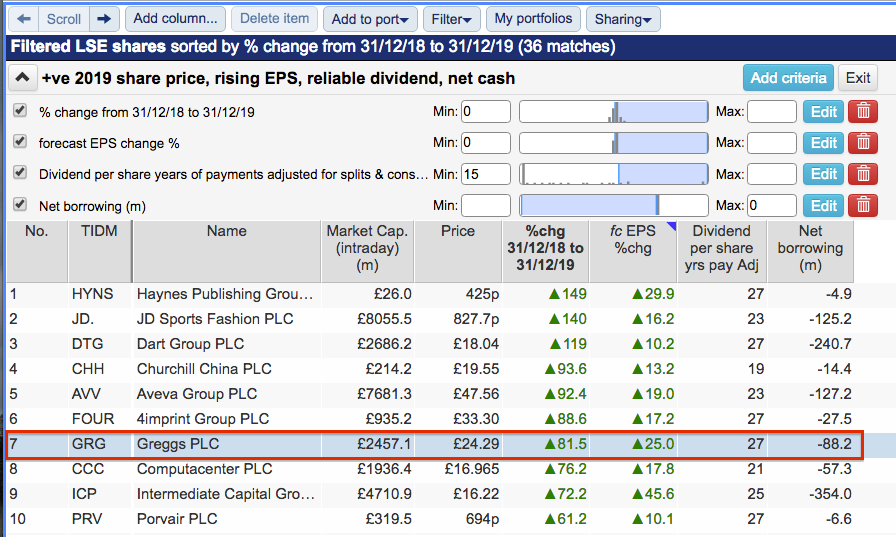
(You can run this screen for yourself by selecting the “Maynard Paton 24/01/20: Greggs” filter within SharePad’s comprehensive Filter Library. My instructions show you how.)
SharePad gave me 36 shares, including JD Sports Fashion, PayPoint and Victrex.
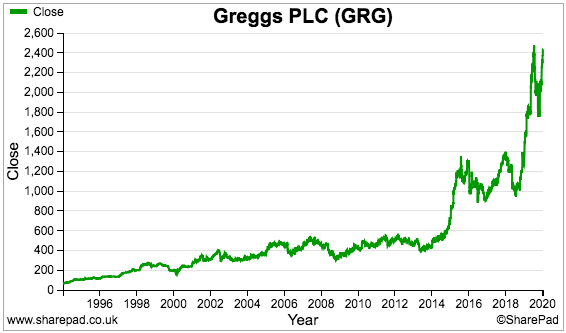
I selected Greggs, the well-known bakery chain, which saw its shares rocket more than 80% last year.
This company is actually a textbook example of ‘running your winners’. The shares floated during 1984 at 13p — and had already zoomed 100-fold to £13 before last year’s price surge:
Let’s take a closer look at the company.
The business of Greggs
Greggs has come a long way since John Gregg rode his bicycle to deliver fresh eggs and yeast during the late 1930s.
By 1951, Mr Gregg had opened a shop in Gosforth, Newcastle, with a bakery at the back. The business remained a single-shop operation until son Ian took charge. During the 1960s and 1970s, Ian expanded Greggs away from its north-east base by acquiring established regional bakers.
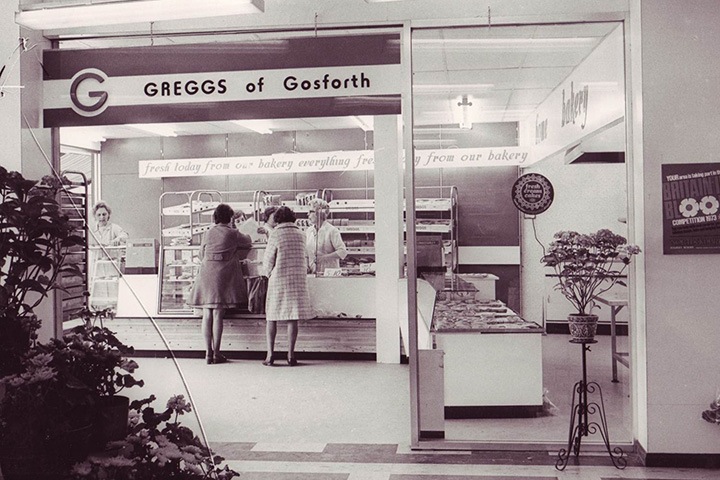
When Greggs floated during 1984, the chain operated 260 shops that produced sales of £37m and a profit of £2m. The purchase of rival Bakers Oven during 1994 doubled the group’s size and gave it a presence in south-east England.
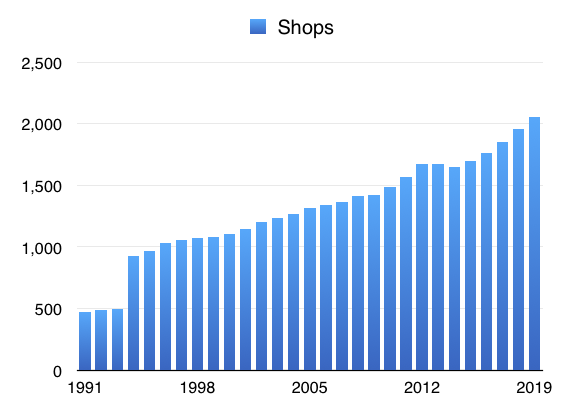
These days some 2,050 outlets— of which 302 are franchised — sell a wide range of sandwiches, savouries, snacks, cakes and drinks. My spreadsheet chart below tracks how the number of shops has advanced since the early 1990s:
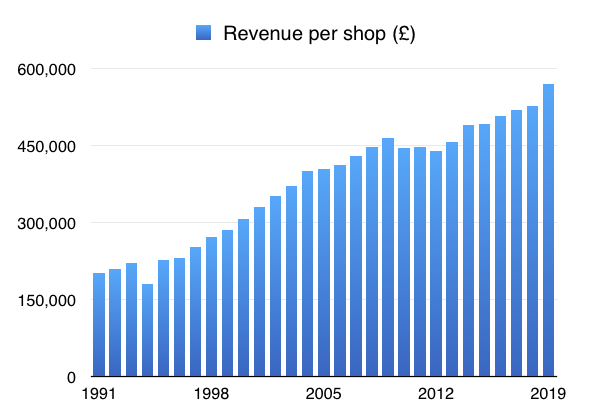
This next chart is particularly impressive. Revenue per shop has increased by approximately 3% per annum over the last two to three decades:
The group’s success boils down to the power of vertical integration and the power of employee culture.
Greggs operates its own manufacturing and delivery facilities, which allows the chain to sell freshly baked food and therefore differentiate itself from competitors and still thrive on fading high streets.
Tip-top service from a workforce motivated by a 10% profit share is another competitive advantage.
Initiatives supporting the chain’s recent growth include £2 breakfast meal-deals, wider food ranges — including salads and pastas — and an increasing presence in retail parks, industrial estates and motorway services.
Current chief executive Roger Whiteside led the recent growth initiatives following some lacklustre years during the early 2010s. Mr Whiteside was appointed during 2013 and had been a Greggs non-exec since 2008.
I should add that Ian Gregg stepped down from executive duties in 1993 and left the board during 2007.
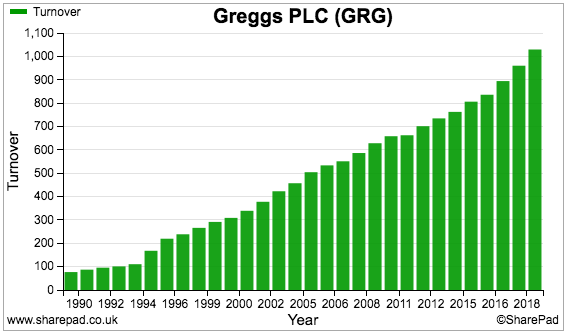
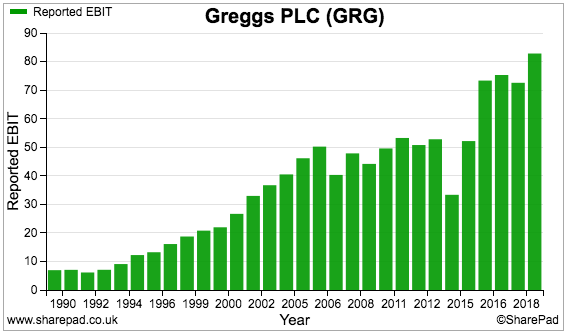
SharePad shows both revenue and profit moving higher over time:
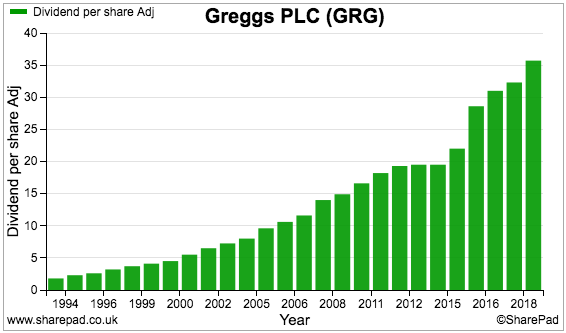
Loyal shareholders have collected a rising payout for more than 20 years. The payout has in fact never been cut since the 1984 flotation:
Greggs’ SharePad Summary
The SharePad Summary for Greggs is shown below:
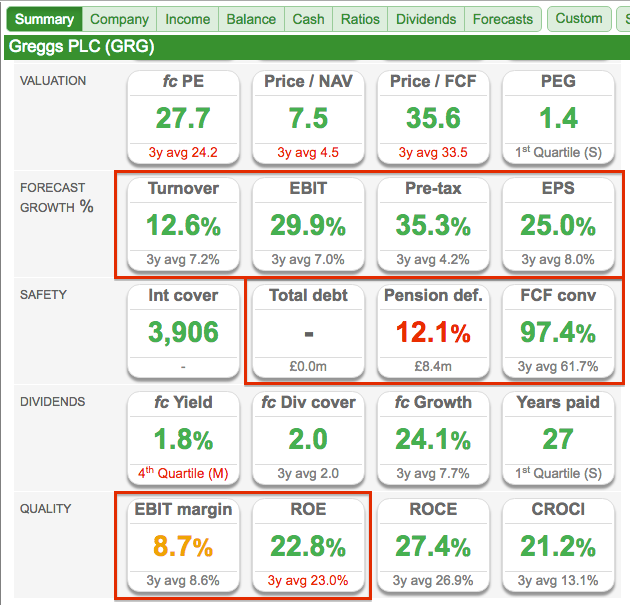
The important points are:
- Very positive forecasts for the current year (second row);
- No debt, a minor pension deficit and super cash conversion (third row), and;
- The modest margin and appealing ROE (fifth row).
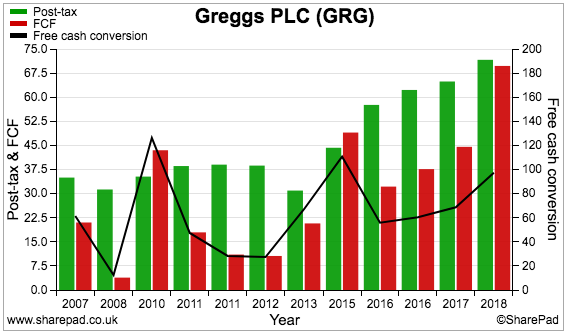
Let’s start with the cash conversion.
Cash conversion and capital expenditure
Greggs’ cash-conversion percentage (black line, right axis) has not always been as high as the 97% reported for 2018:
My Renishaw write-up explained how cash conversion is often held back by:
1) Additional working capital absorbing significant amounts of cash, and;
2) Expenditure on tangible and intangible assets substantially exceeding the associated depreciation and amortisation charged against profit.
The following chart compares Greggs’ earnings to additional working-capital cash and ‘excess’ capital expenditure:
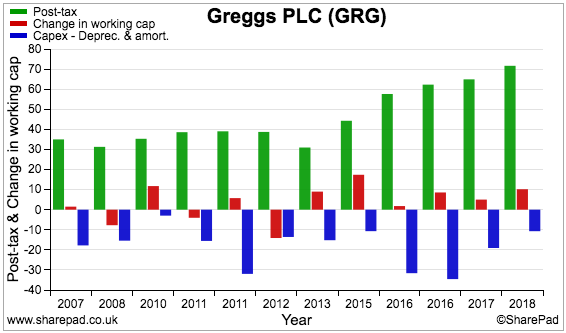
The ‘excess’ capital expenditure (blue bars) has at times consumed substantial amounts of cash flow.
This next chart shows the difference between depreciation/amortisation (green bars) and capital expenditure (red bars):
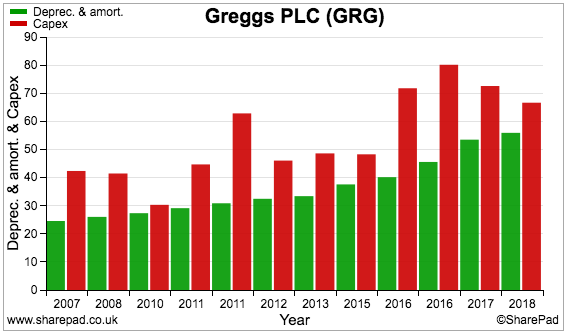
Between 2009 and 2018, some £170 million was spent on capital expenditure that was not charged against earnings as depreciation or amortisation
Still, the hefty capex — used to open new shops, refurbish old ones and overhaul outdated manufacturing facilities — appears to have been justified given the group’s rising sales, dividend and share price.
This next chart is particularly reassuring. Revenue has consistently represented approximately three times tangible assets (black line, right axis):
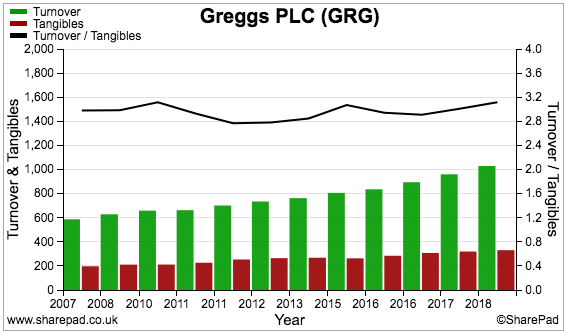
All too often, companies struggle to generate the same level of sales from their capital expenditure as they once did. (Victrex is an example). Not so with Greggs.
Very commendably, the sales return from the chain’s fresh capex appears just as good as that from more established assets.
Note, too, that Greggs carries intangible assets:
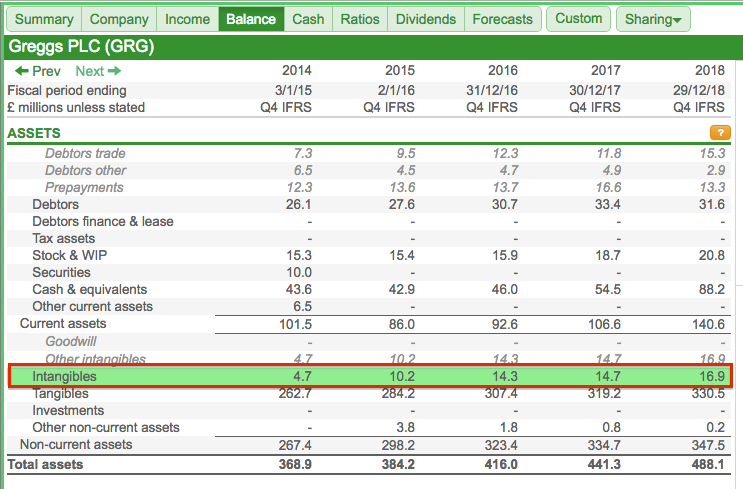
The intangibles relate entirely to software projects. Although such expenditure is not obviously associated with making sandwiches, the new IT has apparently been very helpful to the company’s progress.
Working capital, cash and dividends
Let’s revisit an earlier chart:

This time the red bars are of interest. They represent the net cash changes to working capital — and typically show positive movements.
(Retailers such as Greggs should enjoy favourable working-capital movements, as customers (debtors) pay immediately while suppliers (creditors) can be paid weeks or months after delivering their goods.)
The chart below is exemplary. The lines represent stock, trade debtors and trade creditors as a proportion of revenue:
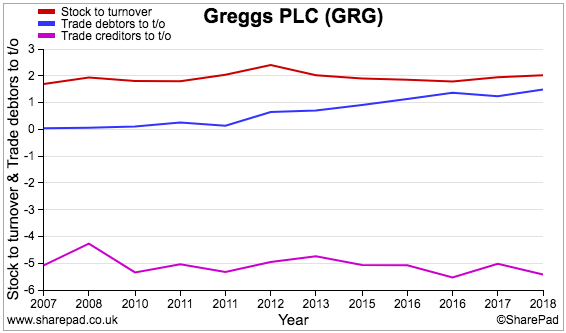
The lines show outstanding working-capital consistency, and suggest Greggs’ day-to-day finances are controlled exceptionally well.
The amounts are pleasingly small, too. Stock is just 2% of sales, while trade creditors represent 5%. I believe trade debtors (blue line) has moved from zero to 1% of turnover because of the growing franchise operation and the fees owed by franchisees.
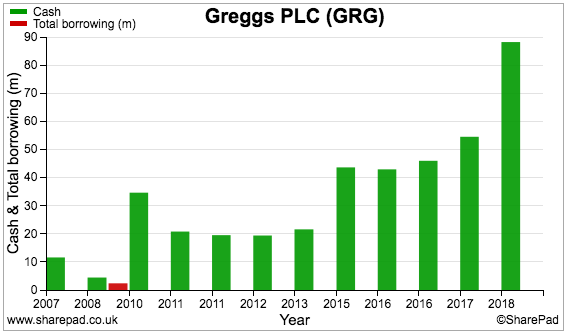
The cash generation has meant cash in the bank has piled higher and debt has not been needed since 2008:
Greggs has spent its surplus cash mostly on dividends (pink bars):
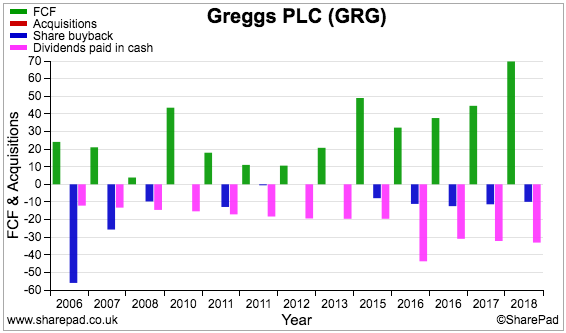
The share buyback (blue bar) of 2006 purchased 8% of the group’s equity at 380p — a great investment in hindsight. Recent buybacks have been used to settle staff share awards rather than to permanently reduce the share count:
By the way, no cash has been spent on acquisitions since the mid-1990s — making Greggs’ growth history all the more impressive.
SharePad’s Dividends tab reveals Greggs has declared special dividends (blue bars) of 20p and 35p per share:
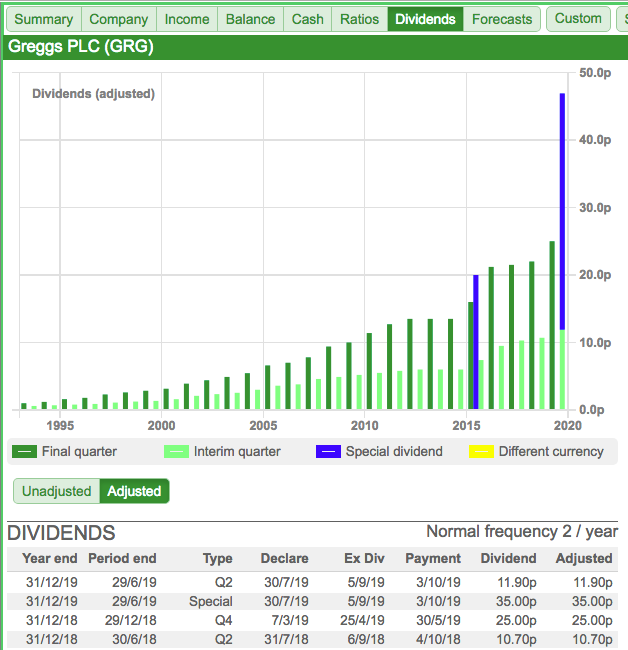
Special payouts often bode well for investors, not least because they imply the directors have a sensible approach to managing ‘surplus’ company money!
Margin, ROE, pension deficit and exceptional items
At 9%, Greggs’ operating margin does not indicate the wide business ‘moat’ enjoyed by the likes of Hargreaves Lansdown and Rightmove.
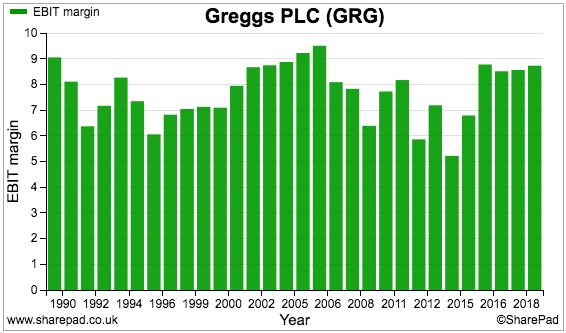
I suppose selling sandwiches and cakes does not lend itself to a powerful ‘network effect’ or immense economies of scale.
Nonetheless, a 9% margin appears relatively sound given the multitude of other retailers — from supermarkets to small cafes — that also sell rolls and coffees at modest prices.
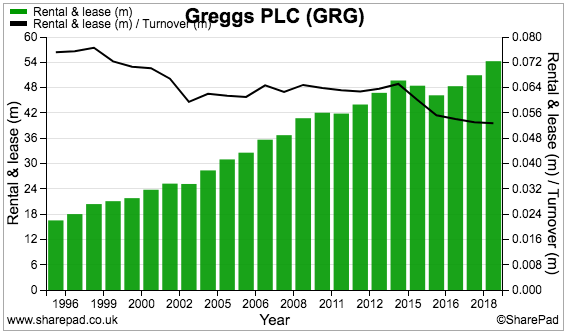
Greggs’ has supported margins by keeping lease costs under remarkable control. The chart below shows the annual rent bill (green bars, left axis) and rent as a proportion of revenue (black line, right axis).
A delightful trend line is sales per employee (black line, right axis).
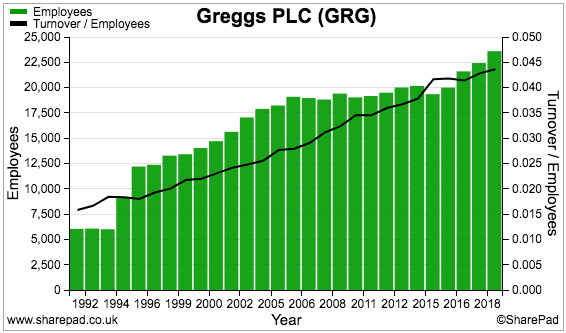
Rising sales per employee is further evidence of a business managed exceptionally well.
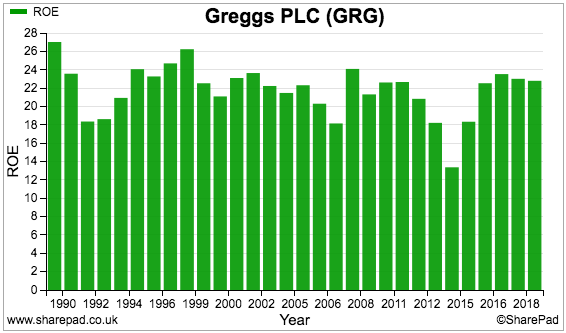
Return on equity has continued to top a welcome 20%, implying the recent hefty capex is earning a good return:
I must point out that Greggs commendably provides a calculation for return on capital within its annual report:
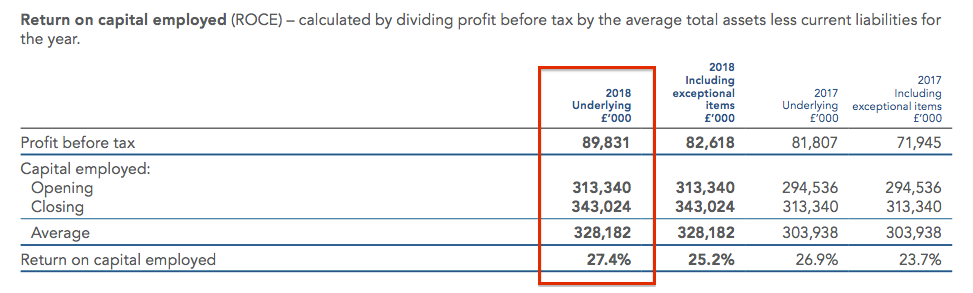
(Return on capital is a measure similar to return on equity. Greggs’ calculation divides pre-tax profit (rather than post-tax profit) by shareholder equity adjusted for government grants, various provisions and the pension deficit (rather than unadjusted shareholder equity). The group’s 27.4% figure matches SharePad’s calculation.)
Greggs’ pension deficit is small compared to earnings:
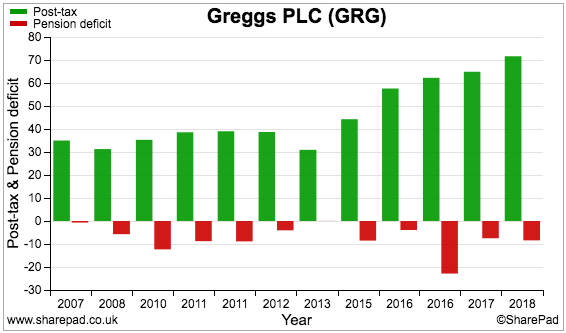
At the last count, annual final-salary benefits of £3.3 million had to be generated from scheme assets of £105 million. The assets appear high enough to me to justify the absence of employer contributions since 2010.
A niggling accounting feature is exceptional items.
The chart below compares Greggs’ post-exceptional earnings (green bars) to pre-exceptional earnings (red bars, when declared):
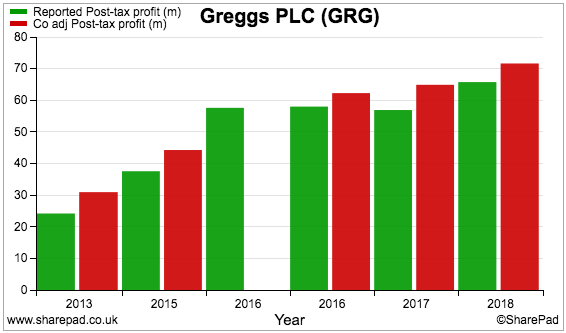
‘Exceptional’ restructuring costs have occurred during 2013, 2014, 2016, 2017 and 2018 (and will again occur within the full 2019 results). Those costs have totalled £39 million — equivalent to 9% of aggregate pre-exceptional profit.
Factor in the exceptionals, and the operating margin drops from 9% to 8% while return on equity declines from 22% to 20%.
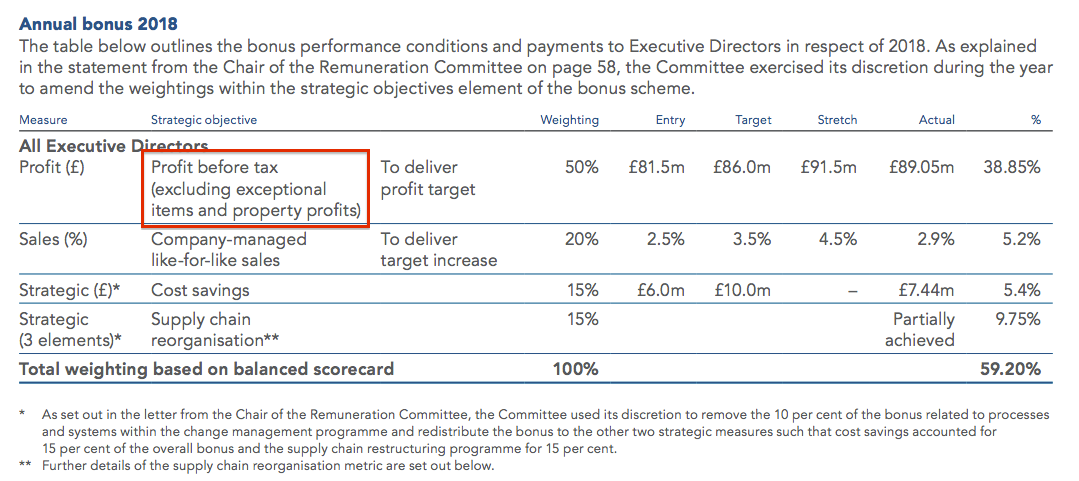
The board’s bonuses and performance share plans are of course based on profit excluding the exceptional costs:
Iconic sausage roll, forecasts and summary
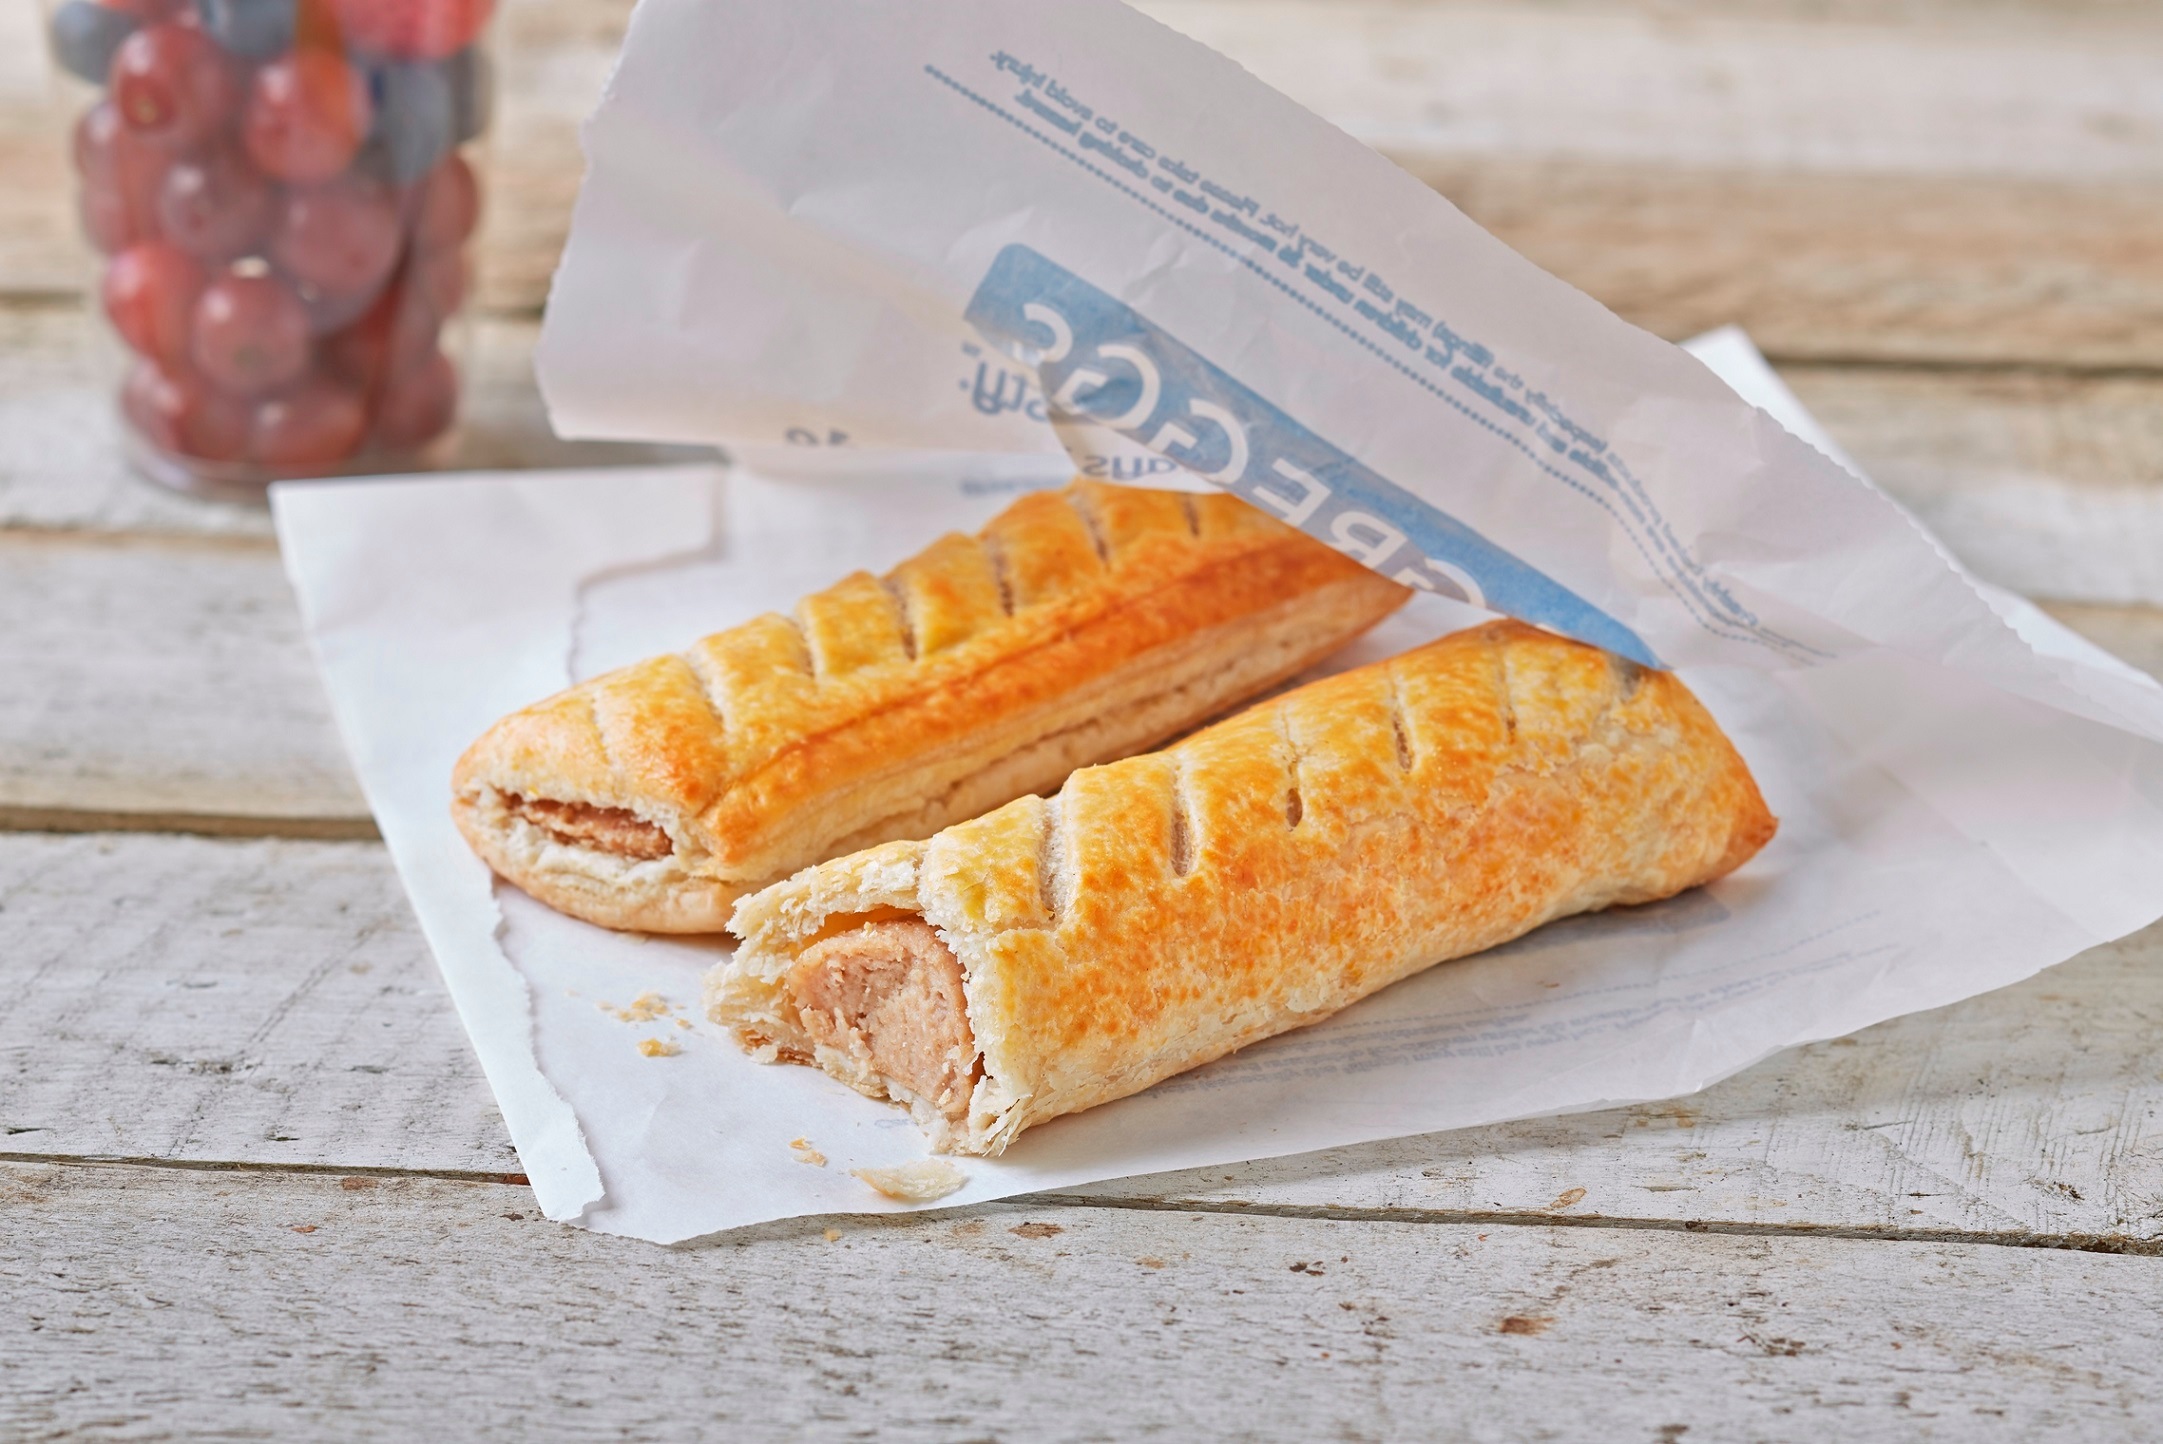
A series of upbeat trading statements underpinned 2019’s share-price surge. Trading was bolstered in particular by the launch of a vegan-friendly sausage roll.
This time last year, the chain revealed the new roll had proven “very popular with a with a broad range of customers” — which prompted a lift to 2018 profit guidance.
By February, Greggs’ had already anticipated its 2019 profit would be ahead of expectations due to the “extensive publicity surrounding the launch of the vegan-friendly sausage roll”.
Greggs claimed the “extraordinary level of social and general media coverage that followed [the launch] attracted additional visits to our shops, offering a great opportunity to showcase the many improvements that have been made to our shops and product offering in recent years.”
A “materially higher” profit upgrade was then issued in May and another upgrade was revealed in November.
And just the other week, Greggs announced its 2019 profit would be “slightly higher” than what had been expected in November.
Like-like-like sales growth for last year was confirmed at 9.2% — the highest level for at least 20 years:
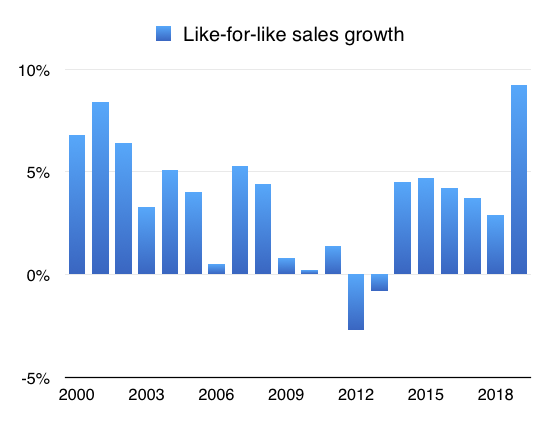
(Like-for-like sales growth represents the underlying turnover improvement at established shops and can indicate whether the retail format remains popular or not. Declining or negative like-for-like sales could mean fading popularity.)
The company also upgraded its description of the vegan sausage roll from “famous” to “iconic”.
SharePad tracked the profit upgrades throughout last year:
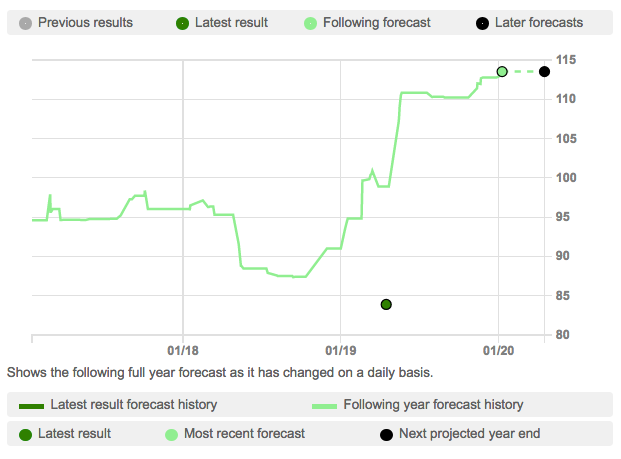
And SharePad’s present forecasts look like this:
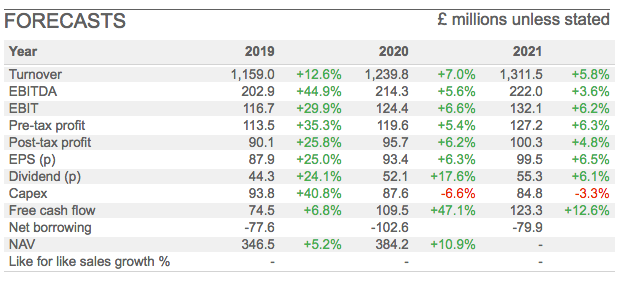
Alongside the sausage-roll success, the bumper 2019 growth rates reflect subdued trading during 2018 due to adverse weather.
Mind you, the single-digit growth rates expected for 2020 and 2021 do seem understated.
A company presentation from last year indicated approximately 95 new shops would open every year until 2022:
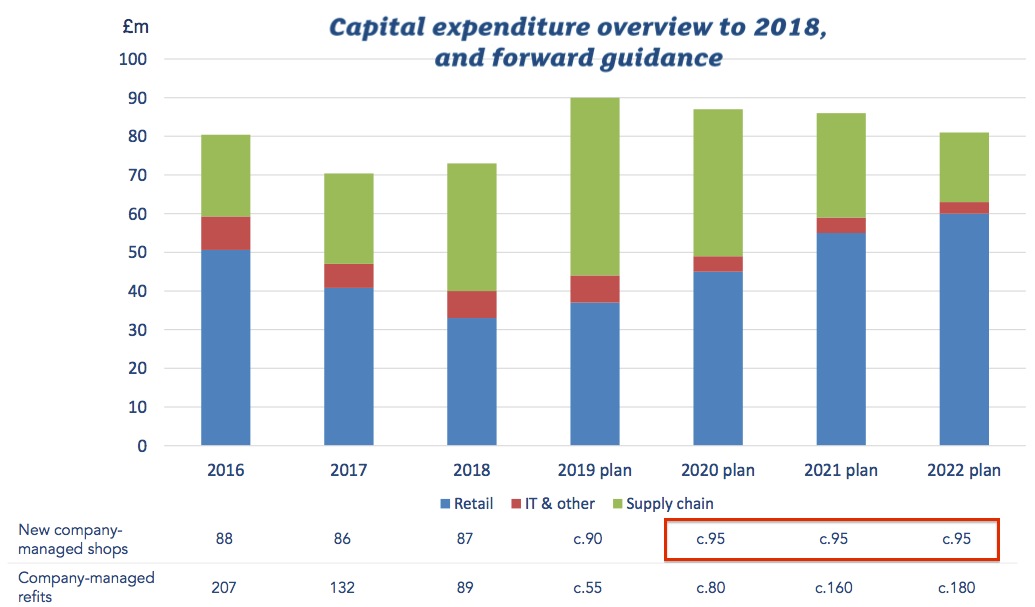
The extra outlets should increase the estate by almost 5% a year.
If brokers are expecting total turnover for 2020 and 2021 to increase by nearly 7% per annum, then projected like-for-like sales growth must therefore be approximately 2%.
For context, like-for-like sales growth averaged 4% between 2014 and 2018.
The surging share-price has left the shares trading at approximately 35 times trailing earnings:
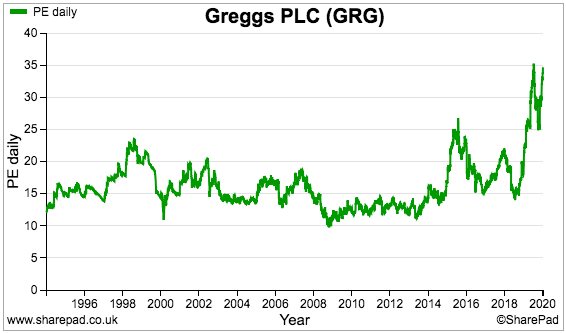
The forecast multiple based on the earnings expected for 2020 is 26.
The premium valuation is no doubt due to investors extrapolating further expansion well beyond 2022.
Indeed, Greggs reckons its in-house supply chain will soon have the ability to serve 2,500 shops — which could be reached by 2025 at the current opening rate.
Given the lofty rating and last year’s share-price leap, the temptation to bank a profit must now be considerable for current investors.
Mind you, those shareholders already sitting on 10-fold, 20-fold — even 100-fold — gains will fully appreciate the rewards from holding tight and running this particular winner.
Until next time, I wish you happy and profitable investing with SharePad.
Maynard Paton
Disclosure: Maynard does not own shares in Greggs.
This article is for educational purposes only. It is not a recommendation to buy or sell shares or other investments. Do your own research before buying or selling any investment or seek professional financial advice.


