
Michael Taylor examines whether soaring US valuations are flashing warning signs of a market bubble, and what it could mean for UK investors. From the Buffett Indicator to AI-fuelled exuberance, he explores the risks, the bull case, and why concentration in the Magnificent Seven matters more than ever.

I trade UK small-caps for a living. Not US large-caps. So when people ask me whether the US is in a bubble and if the market is going to crash, I have no idea.
Nobody does. People can pretend to, and they’re often wrong.
Even Michael Burry, who successfully shorted the housing market in 2008, is often wrong.
And it’s worth noting that he was several years too early, and because he was wrong for so long he had to gate his fund to stop investor redemptions at the time.
So even though he was right eventually, his timing was far from perfect.
As UK traders, we cannot afford to ignore the US. When the US takes a bath, UK small caps are often marked down and people sell.
Not because anything fundamentally has changed, but because Wall Street has had a wobble.
Even if you never buy US stocks (I don’t) you still need to be aware of the situation. There are several warning signs flashing, and you need to know how to protect yourself.
The indicators are screaming
The first is the Shiller PE, also known as the CAPE ratio (Cyclically Adjusted Price-to-Earnings ratio).
It takes the S&P 500 price and divides it by the average inflation-adjusted earnings of the last 10 years. The point is to smooth out the noise.
As of May 2026 it sits at 41.
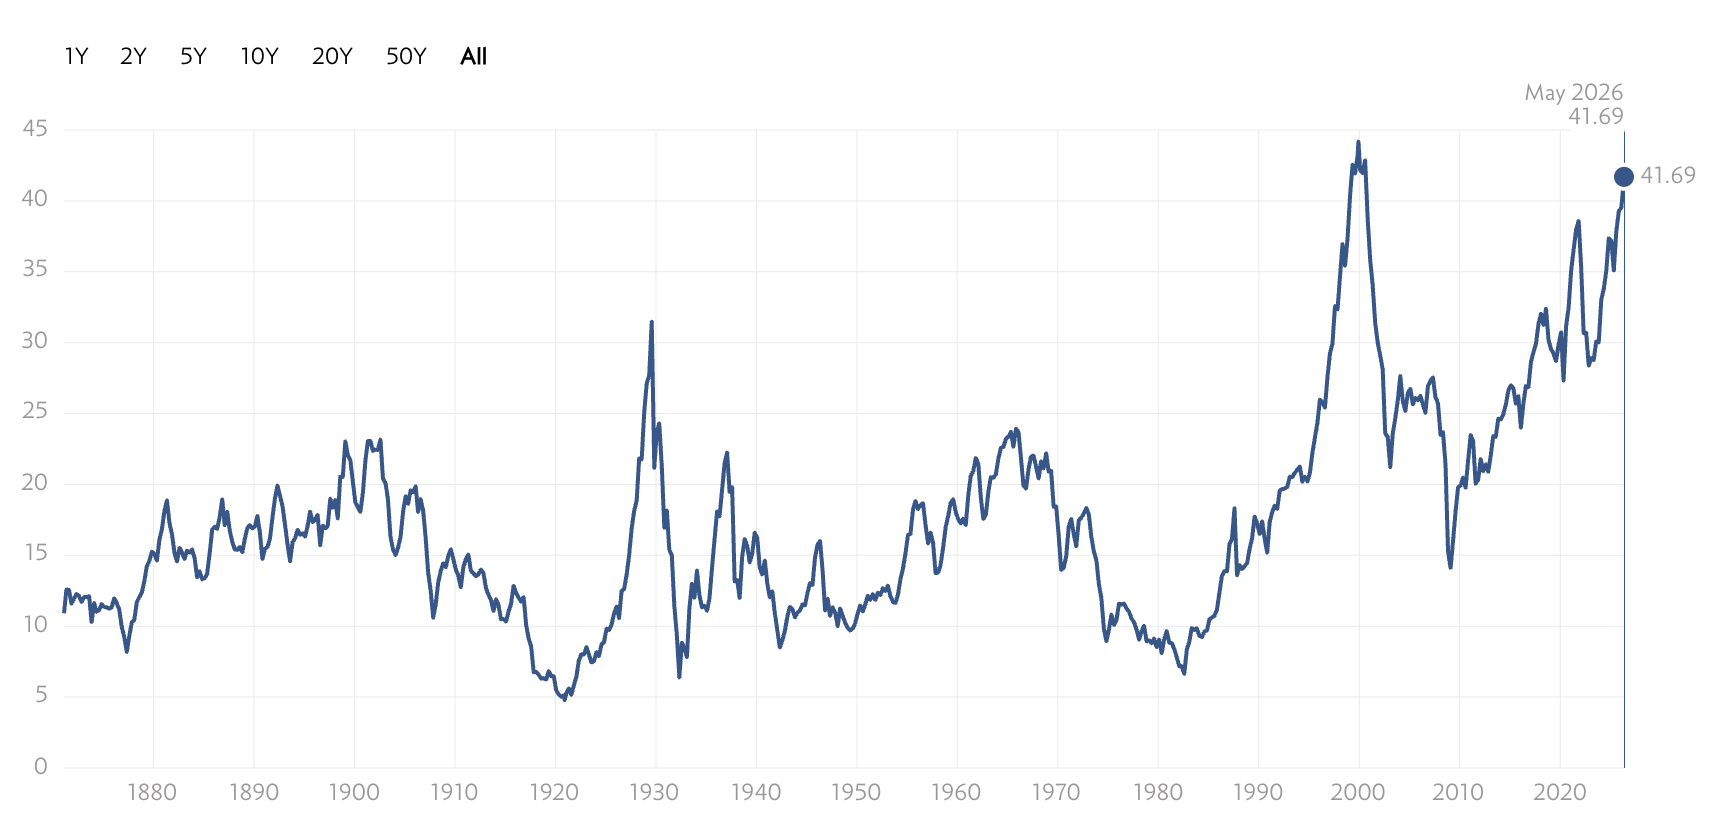
The only time in recorded history this number has been higher was December 1999. The ratio hit 44.19, and not long after the Dotcom bubble burst.
The second is the Buffett indicator. This is the total US stock market cap divided by US GDP.
Warren Buffett himself called it “probably the best single measure of where valuations stand at any given moment.” And if it’s good enough for him, it’s probably good enough for me.
He said anything over 120% means the market is overvalued. As of May 2026 it sits at around 230%. That’s the highest reading on record.
Higher than the Dotcom peak of 146%, and higher than the 109% before the 2008 financial crisis. About 2.4 standard deviations above its long-term trend, apparently.
And finally we’ve got concentration. I’ve talked about this at length in a YouTube video but as of April 2026, the so-called Magnificent Seven (Apple, Microsoft, Nvidia, Amazon, Alphabet, Meta, and Tesla) make up 33.7% of the entire S&P 500.
In 2016 they were 12.5%. In 2025 alone they were responsible for 42% of the index’s total return.
When money flows into ETF trackers – that money is buying a big chunk of seven companies, and the remainder goes to the other 493.
The bull case
Now in fairness, the bull case isn’t stupid. Mag 7 earnings are real.
These are not pets.com duffers.
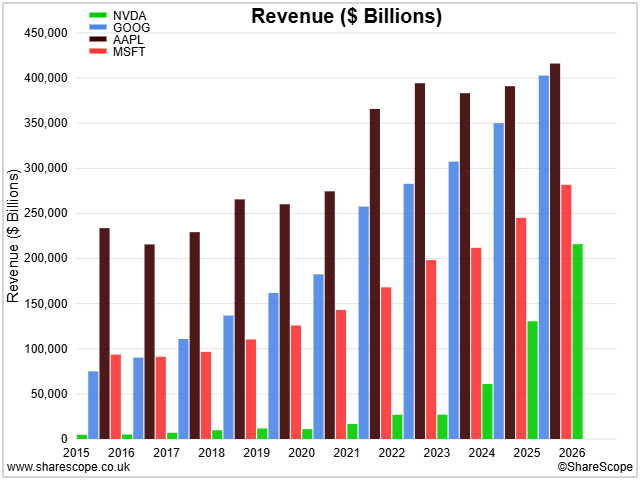
Apple, Microsoft, Alphabet and Nvidia generate trillions in combined revenue, much of it recurring (there is an argument that some of this revenue is circular in nature, but the revenue does actually exist).
Profit margins on the cloud and software businesses are genuinely extraordinary.
Compare that to 1999, when the index leaders included companies that had never made a penny.
The Buffett indicator is also a bit unfair to the US. Roughly 40% of S&P 500 revenue comes from outside the US, but US GDP only counts what is earned domestically. That distorts the ratio upwards.
And these indicators have been screaming for ages.
The Buffett indicator hit 200% in 2021. Anyone who shorted the market on that signal got steamrollered until the wheels started to fall off in 2022.
“Markets can stay irrational a lot longer than you can stay solvent” is a quote generally attributed to Keynes.
He’s right, and in the case of Vincent van Gogh, I’d even argue markets can remain irrational longer than you can remain alive.
So is the US in a bubble? Honest answer: I don’t know, and anyone who tells you they do is selling something. But we definitely should take note.
However, there are a few more things to consider…
First, the AI capex numbers. We can’t ignore these.
The five biggest hyperscalers, so that’s Microsoft, Amazon, Alphabet, Meta and Oracle, have guided combined capex of around $700 billion for 2026. That is a 36–64% increase on 2025 depending on how you count it.
Roughly 75% of it is for AI infrastructure.
Big Tech is on track to need around $1.5 trillion of new debt to finance this build-out, according to estimates from Morgan Stanley and JP Morgan. McKinsey projects $6.7 trillion of global AI capex by 2030. It’s an eye-watering amount.
Now that spending might pay off. AI might be the productivity revolution everyone says it is. But it might also be the railway boom of the 1840s, where the technology also turned out to be transformational.. But the people who bankrolled it lost their shirts because the economics didn’t add up at the prices paid.
Then we’ve got the Berkshire Hathaway cash pile. Warren Buffett has basically completely capitalism. And the man who taught us to be fearful when others are greedy has sold more stock than he bought for eight quarters in a row before handing the keys to Greg Abel. Berkshire is sitting on $344 billion in cash. The most patient investor in the world is on the sidelines. That’s information. It’s fair to say that he can’t just go out and buy a lot of things because he’s too big, but it’s also true to say that if he found bargains he’d be buying.
Next we have to factor in that whilst concentration is great for building wealth, the reverse is also true. If the Mag 7 powered 42% of last year’s gains, what happens if a couple of them disappoint? You don’t need a crash. You just need Nvidia to miss. Or Apple to issue a soft outlook. Or for the AI capex story to wobble for a quarter.
The same concentration that lifted the S&P on the way up will accelerate it on the way down.
In Part II, we’ll look at the measures we can take to protect ourselves from an inflated US market deflating.
Michael Taylor
Get Michael’s trade ideas: https://newsletter.buythebullmarket.com/
Free educational YouTube content: @shiftingshares
This article is for educational purposes only. It is not a recommendation to buy or sell shares or other investments. Do your own research before buying or selling any investment or seek professional financial advice.


Look for a half decent low point Summer through to end of the year – It will form a low then rally upwards from it to most likely all time new highs in 2027 then there is another low expected in 2028, so guess what it has to do from those highs to get to a low?
I’m not talking about major lows, just some sort of decent swing low turning point – those sorts of lows don’t happen in the type of overall movement we are currently in
Something is happening this year that has happened since the USA stock markets came into being in May 1792 – It would be highly highly unlikely for it to miss a beat this time around as it has a ultra high win rate/accuracy
As this event is NOT 100% accurate, we can’t say with certainty that it will happen, but with a 95%+ accuracy rate, it’s pretty nailed on
and I have a few other completely Independent methods I use all pointing at the same time period for a low, so it should be ultra high probability
People think markets are random – 15 years of studying markets tells me otherwise
There’s a lot of bear market talk – 2022 was a bear market, so was 2023 – what people are really asking is when does the next 2000-03 and 2007-09 crashes of 50% happen along with all the economic chaos that forms after them – All I will say is that we are NOT in those types of market conditions anymore, they will repeat in the future, just not for a number of years yet
Best to think of it as being on an UP escalator and being knocked back down a few steps – the escalator is still going UPWARDS
I would urge anyone serious about understanding the stock markets to read everything they can get their hands on – I have a handful of books on trading and Investing on my bookshelf worthy of keeping, in 15 years I have read 1000’s of which 95% have been binned
One of note published in 1993 predicted this current war! What a genius that author is – a 33 year old prediction and he nailed it – his stock market timing stuff from back in 1993 would have you being able to predict/time lots of the key turning points since 1993
There is nothing new in the markets – EVERYTHING has already been published, If it were possible to time and predict price levels, then it has already been published – All you have to do is read it all and work out what is relevant and what is not, as I did back in the 2010’s – very very few of you will bother to put that kind of work in and like the author of this article, you’ll just be guessing and assume a stance that its hard and can’t be done with consistency, even when you know hand on heart that Timing the market trumps time in the market