
It’s always worth keeping an eye on the indices. They are the bellwether for the markets – whenever the Dow plunges or hits new highs then we always hear about it.
However, there is also a disconnect between the indices and the overall market.
One thing that I found a few weeks ago is that many stocks were trading below their 200 moving averages yet the indices were trading close to all-time highs.
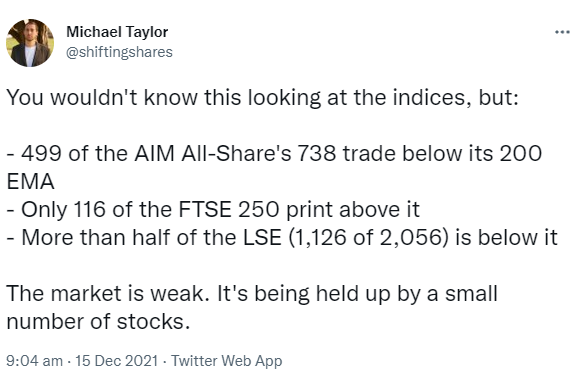
The market leaders usually set the pace for the market. Where they go, the soldiers follow. Yet in this instance, there was clear disobedience between the soldiers and the generals.
This is one problem with checking the indices to gauge the market’s health.
Indices are heavily skewed towards the largest of stocks. In risk-off markets, it’s typically the speculative stocks that are sold off first.
This explains why the majority of the AIM All-Share’s stocks traded below the 200-exponential moving average. Yet the FTSE 250, which contains many domestic names in the UK more oriented to growth, was also faltering.
My conclusion that the overall market was weak because a small number of stocks were doing the heavy lifting.
Fast forward just over a month, and the generals are starting to sag.
Here are the two main indices that people like to track.
We can see now that the markets are in a spot of bother.
Not only are both indices now trading below their 200 EMAs, but these are significant price levels that we’ve not seen this side of Vaccine Day.
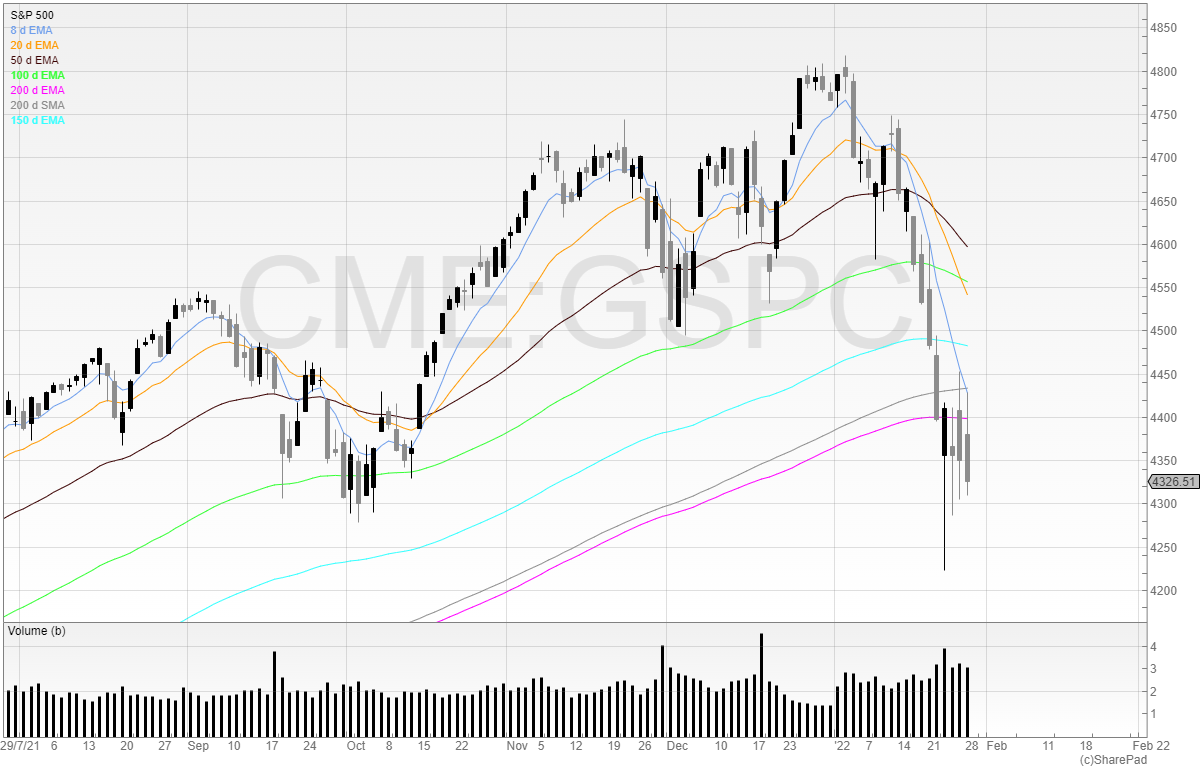
Let’s look at the S&P 500 again.
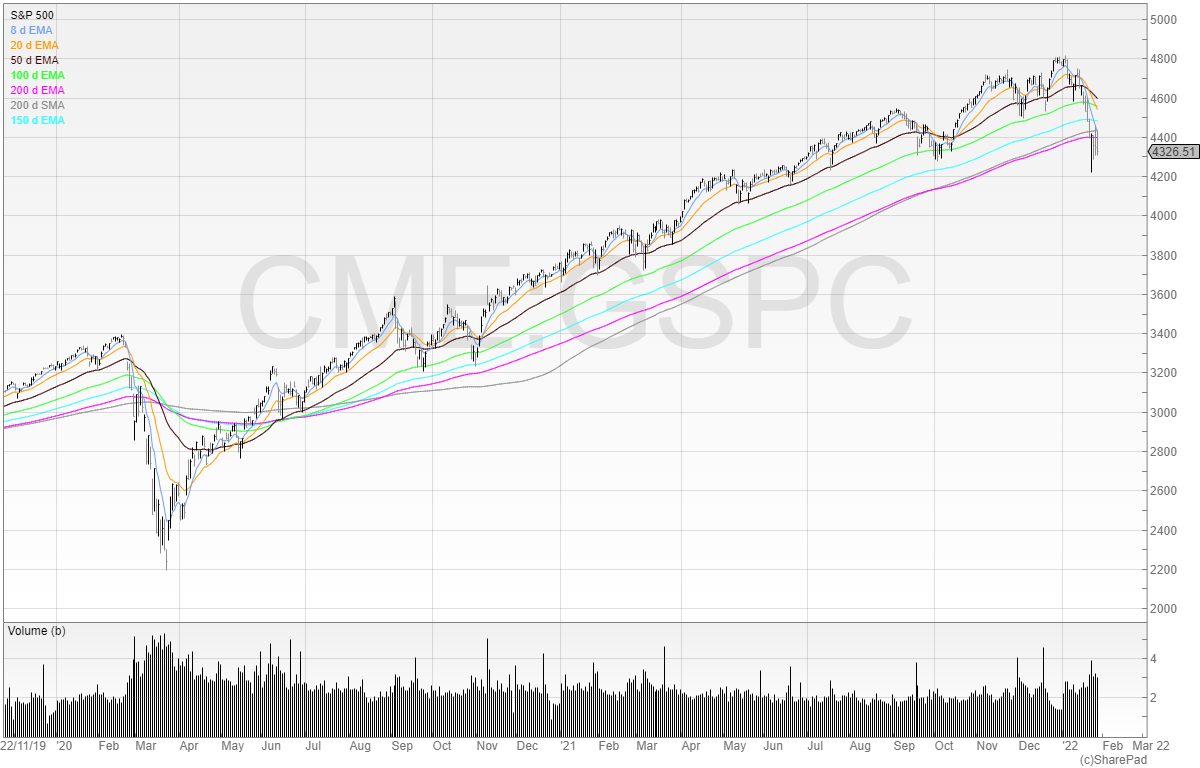
Notice how the 50 EMA (black line) has consistently provided support for the index. Earlier this month, that support was broken and the index continued to trend toward the 200 day moving averages.
That was the last bastion of hope for the bulls. It’s been breached, and the index is in a bloody struggle to regain territory. Everyone is watching these levels to see if they hold, because failure to hold here could herald the beginning of a new bear market.
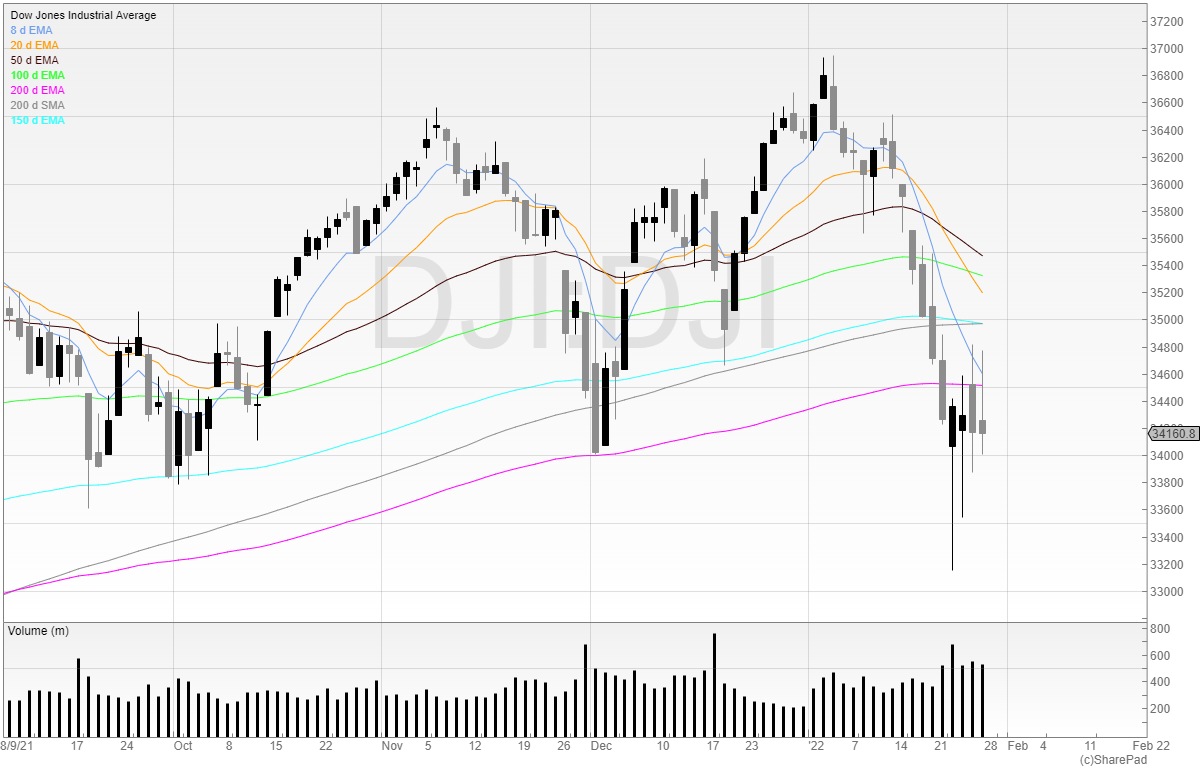
The Dow Jones Industrial Average is fairing little better.
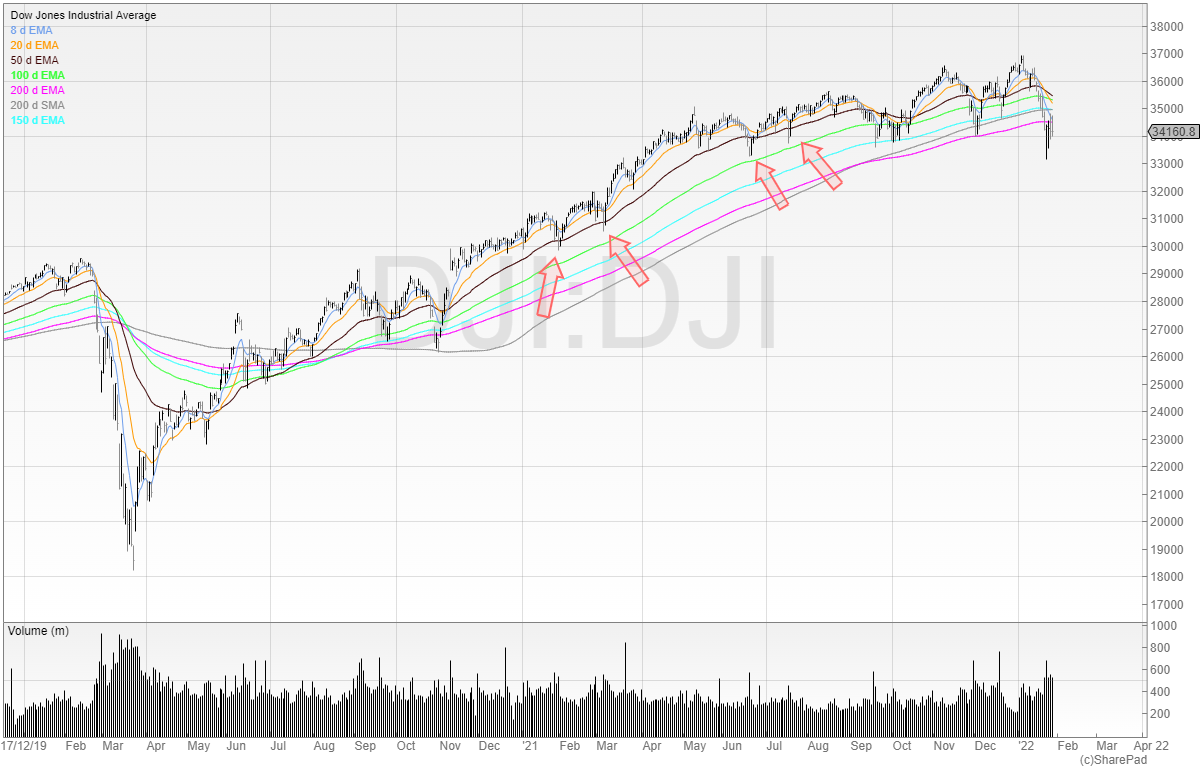
Again, we can see the 50 EMA holding out several times – reliable and consistent when called upon.
But it’s a similar chart to the S&P 500.
Let’s look at the UK indices now.
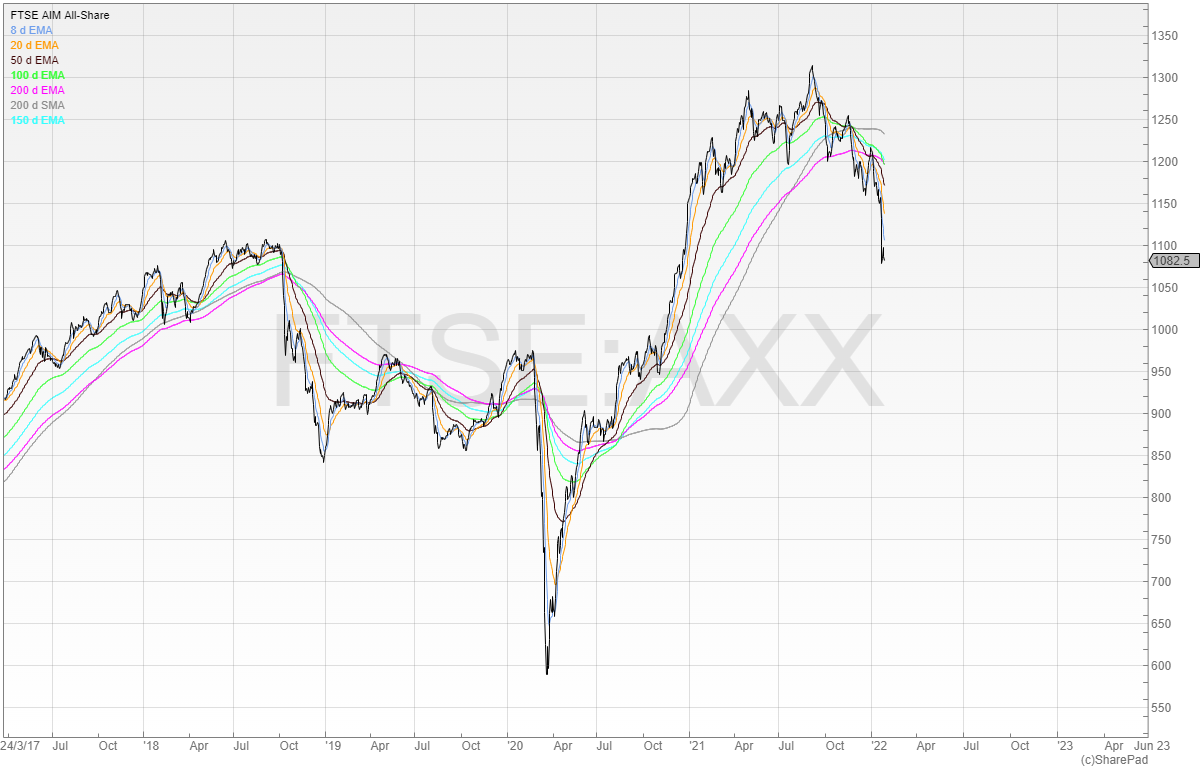
The wheels on the AIM All-Share have come off spectacularly. The 200 moving averages have been smashed to pieces and the index is now tracking downwards. The next support level looks to be around 970p.
That said, I try not to read too much into support and resistance on index charts. Support and resistance on a single stock matters much more because the stock is influenced only by the buying and selling of that security.
Sure, there may be other factors, such as others’ buying and selling in oil which affects the fundamental prospects of an oil company. But it is still the buying and selling of the oil company shares itself, and not oil, that affects the share price of stock.
That is not the case with indices. Remember, an index can be made up of hundreds of stocks and so support and resistance on indices has lots of influences.
But the index can be useful to check generally the overall trend and health of the market.
The FTSE 250 was a similar story: 50 EMA providing support, until it didn’t.
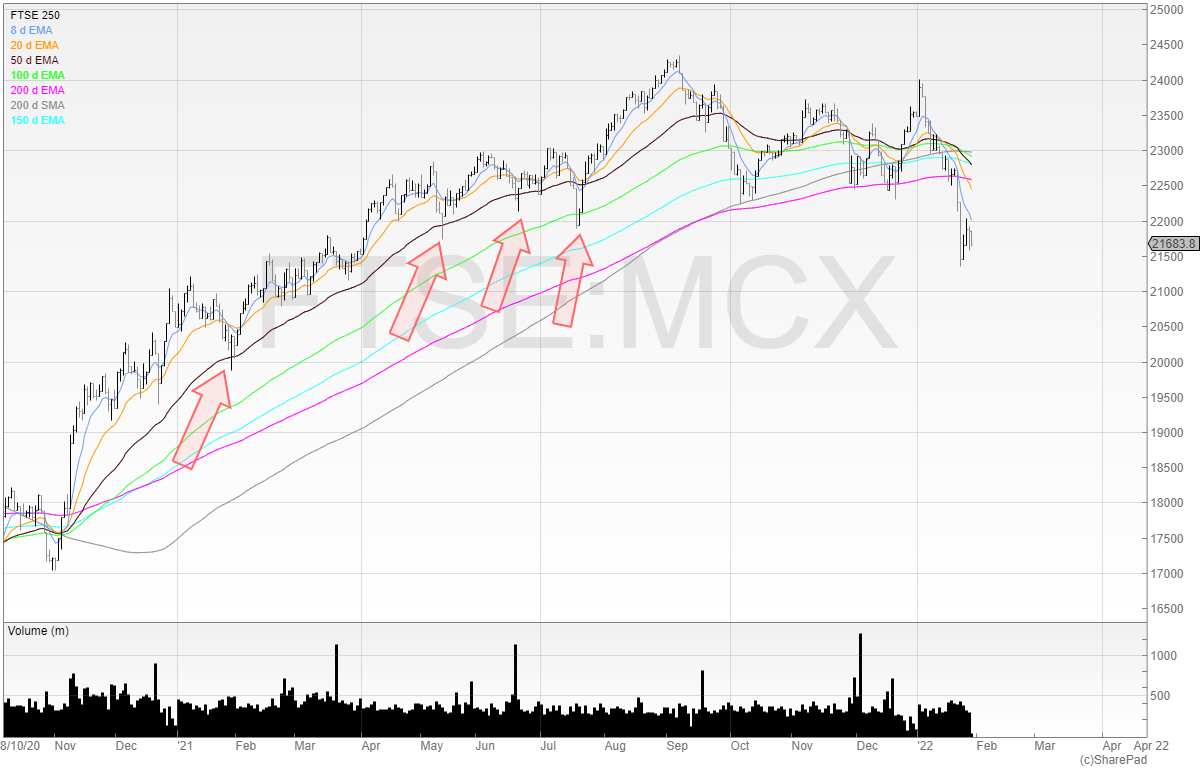
Many private investors in the UK have probably seen some of their favourite stocks hit hard.
It’s hard to point a general reason for this. Inflation? We’ve been talking about it for months.
Ukraine? Again, it’s been a worry for weeks.
The market can defy logic for long periods of time. Remember, markets were at all-time highs when Coronavirus was ripping through Italy. It didn’t price in any risk of the virus destroying livelihoods, economies, and supply chains. Then one day: plop!
However, it is the much-hated FTSE 100 index that is performing strongly.
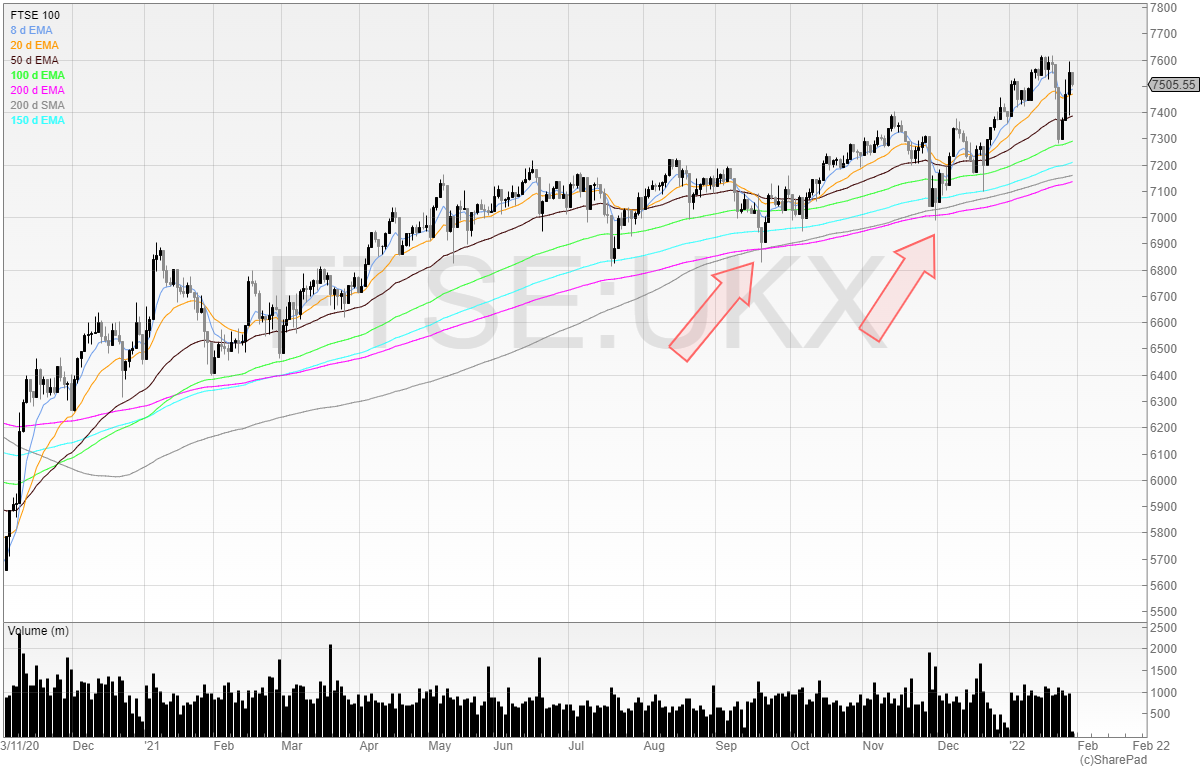
The oil price is banging on the door of $90 and two industry stalwarts in BP and Royal Dutch Shell – or Shell as it has now been renamed – are two of the FTSE 100’s biggest constituents.
The FTSE 100 has long been touted as overvalued. Is there now a pairs trade to be had in shorting the US and going long FTSE 100? I don’t know, but it’s rare to see the FTSE 100 outperforming.
I hold a short position in the FTSE 250 because I have a book full of longs. Many of the stocks I own are low PE with little market hype in the price. I believe this protects me somewhat because the ratings may not deflate as much as the larger PE stocks (although all stocks can go to 0p and a 100% loss).
But for many holding a large basket of speculative garbage, this is likely to be a painful month.
The indices are now starting to show – but it’s easy to check the underlying health of the market.
To do that, we can set up a quick filter.
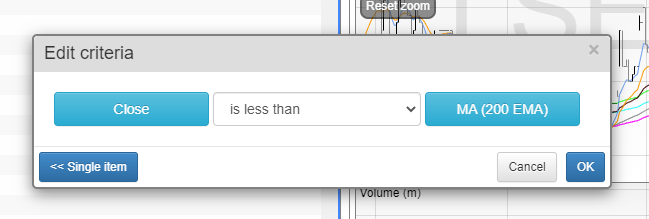
What we need to do is create a filter, then select latest close price, and combine it with a moving average. I’ve used the 200 EMA.
You can find this filter under Michael Taylor Strength in the SharePad library.
If you want to check how many stocks are above the 200 EMA, then simply swap “is less than” to “is greater than”.
The indices are always worth keeping an eye on, but from time to time I suggest checking the underlying health.
This strips out the bias that larger weightings in the indices have on the overall market.
For example, I don’t care about the prices of the FTSE 100. I barely trade them and don’t invest in them. Therefore, for me, using this filter is of more use.
Michael Taylor
Buy the Breakout trading newsletter available at: www.shiftingshares.com/newsletter
Twitter: @shiftingshares
This article is for educational purposes only. It is not a recommendation to buy or sell shares or other investments. Do your own research before buying or selling any investment or seek professional financial advice.


Michael in the Filter Library there are 8 Filters bearing your name. None of them use the word “strength”
Can you enlighten me please?
Hi Anthony, I’ll chase this up! Thanks for letting me know.
Hi Anthony – this filter is now up on the library.
Thank you Michael.
I will give it a try.
Tony aka Anthony.
In Sharescope you can graph the whole list unweighted by capitalisation (on a graph right click “choose graph shares not weighted”). If you do this with the FT100 you end up with a screen that looks very like the S&P 500.
Sorry, I can do a screen shot but I can’t get it to go here.
s7