
In this article I will continue focusing on primary and secondary trends but this time I will use moving averages to define market phases. You can also view Part 1 of this article Lessons from the Trend (Part 1): Breakouts for more primary trend details that relate to what we are talking about here. For a refresher on stock selection & lanes of investing you can also revisit my first article for ShareScope here.
Calculating Moving Averages
First let’s go back to basics and look at how a moving average is calculated as this will give us a good understanding of why they are helpful based on data and logic rather than the mystical world of technical analysis wizardry that might have you believe they possess some magical properties. The moving average is calculated by adding up the chosen lookback periods closing prices and dividing it by the chosen lookback period and this gives us a mean price. This mean price is plotted daily on a chart to display the visual trend. If the mean price is higher than the previous days mean price calculation then the average price is trending up on the chosen time period. It’s really that simple.
Choosing Moving Averages
Everybody has their own investment timeframe so choose a time frame and lookback period that suits you. You could use daily, weekly or monthly and any lookback period. If you trade longer term then a weekly or monthly setting will have less noise than a daily setting and will smooth out the day to day noise.
The three moving averages I’ve chosen for this method of trend identification can be named according to their purpose.
- 200 day SMA = Primary Trend
- 100 day SMA = Mean Trend
- 50 day SMA = Secondary Trend
Moving Averages Trends
If the moving average is rising then the trend is up and if the moving average is falling the trend is down for the chosen time period. The trend of the average is key. Is it rising or falling?
Primary Trend Period = 200 Day SMA.
- 200 Day SMA is Rising = Trend is up.
- 200 Day SMA is Falling = Trend is down.
Mean Trend Period = 100 Day SMA.
- 100 Day SMA is Rising = Trend is up.
- 100 Day SMA is Falling = Trend is down.
Secondary Trend Period = 50 Day SMA.
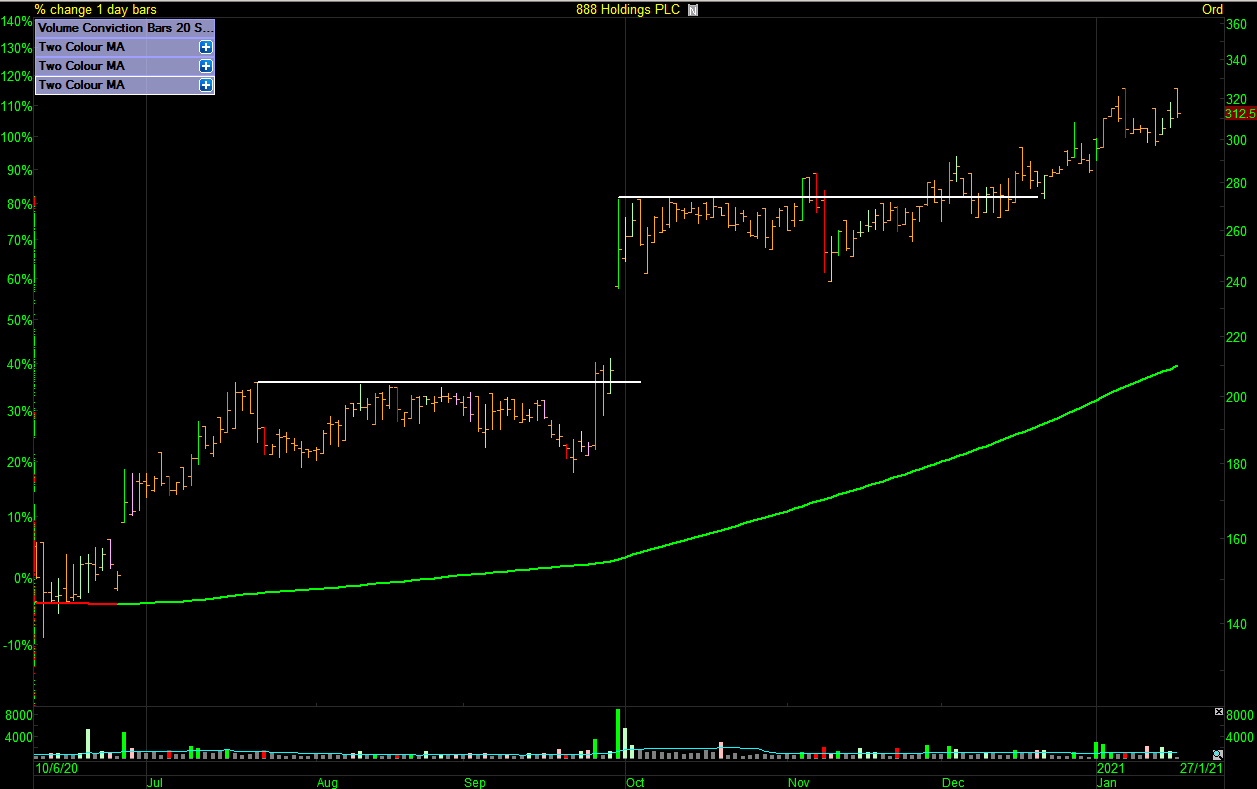
Below I’ve set the 200 day SMA to green, the 100 day SMA to orange and the 50 day SMA to blue. In ShareScope Plus & Pro you can add a ShareScript to a chart called ‘Two Colour MA’ which will highlight if the moving average is rising or falling – the averages will turn red if falling.
888 Primary Trend 200 Day SMA is Rising (Green)
(click to enlarge image)
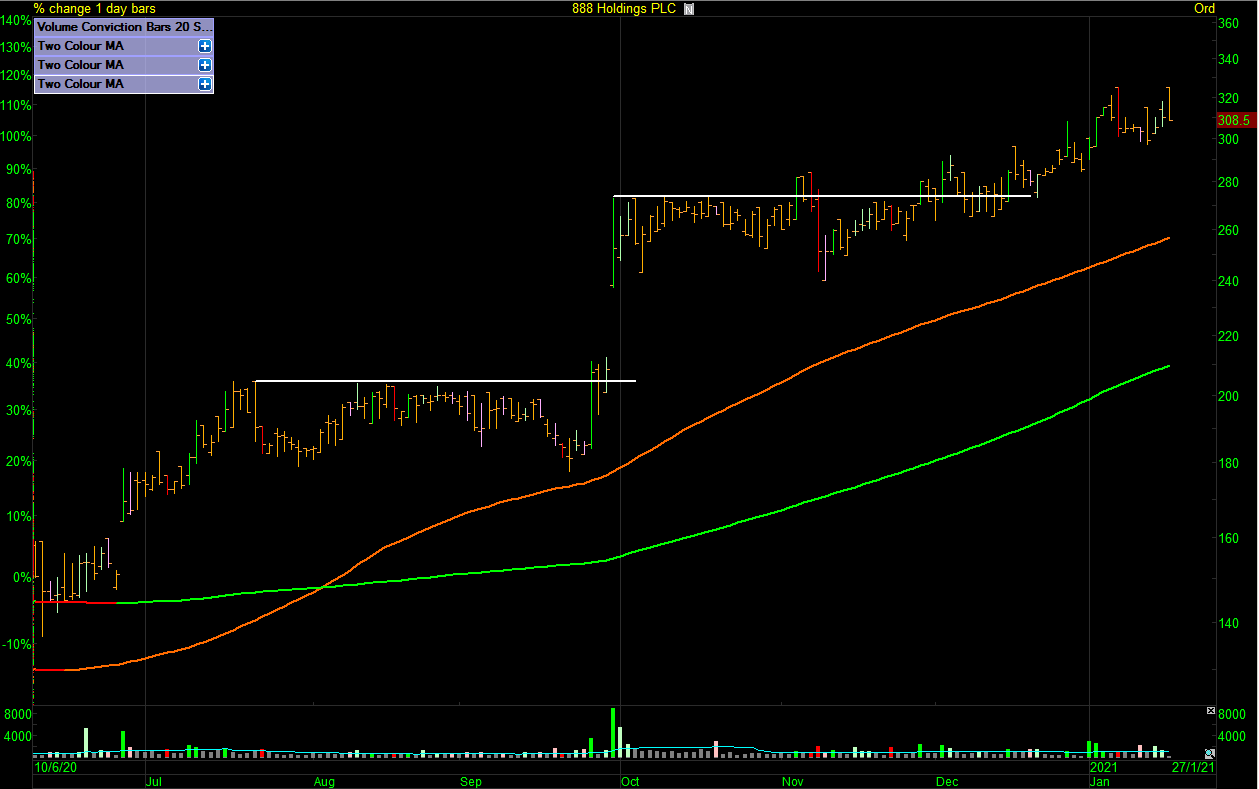
888 Mean Trend 100 Day SMA is Rising (Orange)
(click to enlarge image)
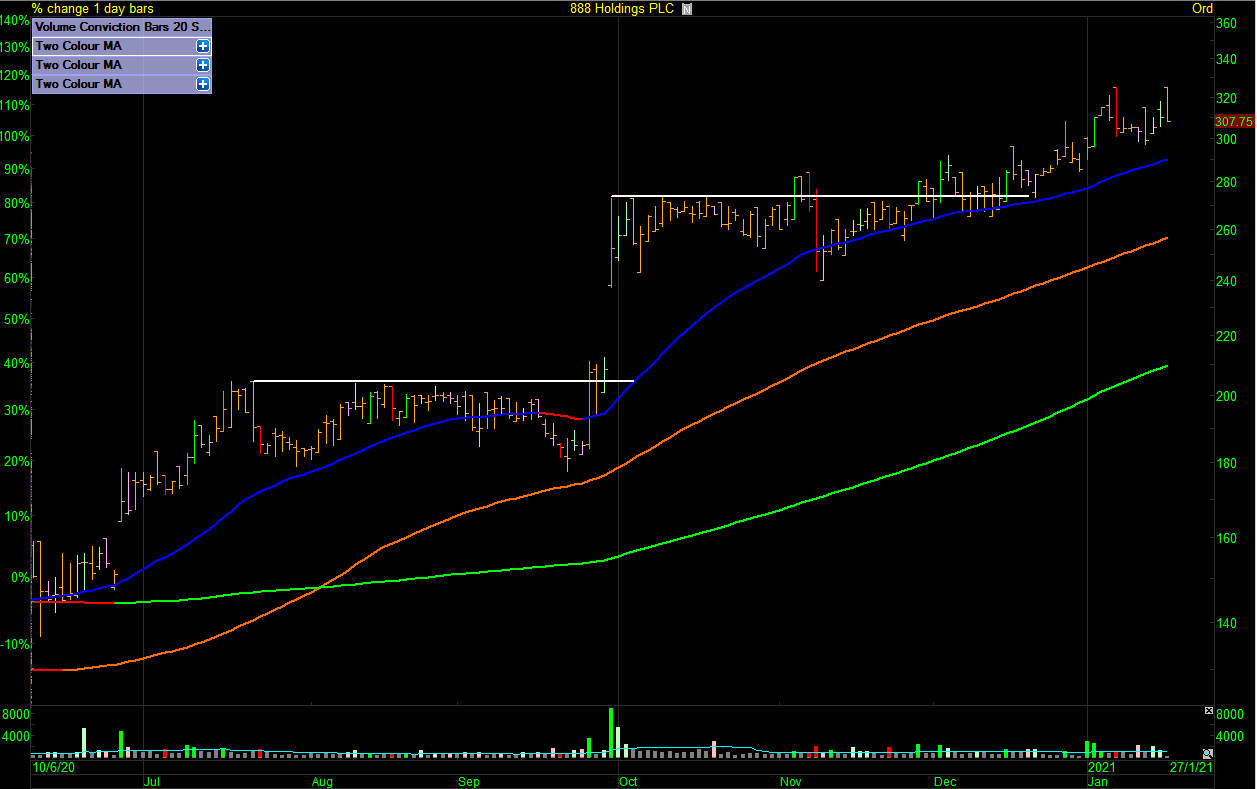
888 Secondary Trend 50 Day SMA is Rising (Blue)
(click to enlarge image)
Moving Average Phases
Using the three trend timeframes above we can arrange all stocks in the market into trend phases. If you like to focus in on recovery stocks then they will be found in the emerging bull filter. If you like to buy breakouts in trending stocks then they will be found in the trending bull filter and so on. Remember you choose your own timeframe so choose one that is meaningful to you. The key here is whether the trend is up or down on the moving average. We’re not interested in moving averages being in order or crossing over. We’re just focusing on the trend.
- Emerging Bull – 100 Day SMA is rising / 200 Day SMA is falling.
- Trending Bull – 50, 100 & 200 Day SMA’s are rising.
- Correction Bull – 50 Day SMA is falling / 100 & 200 Day SMA’s is are rising.
- Emerging Bear – 100 Day SMA is falling / 200 Day SMA is rising.
- Trending Bear – 50, 100 & 200 Day SMA’s are falling.
- Correction Bear – 50 Day SMA is rising / 100 & 200 Day SMA’s is are falling.
Trending Bear / Emerging Bull / Trending Bull

(click to enlarge image)
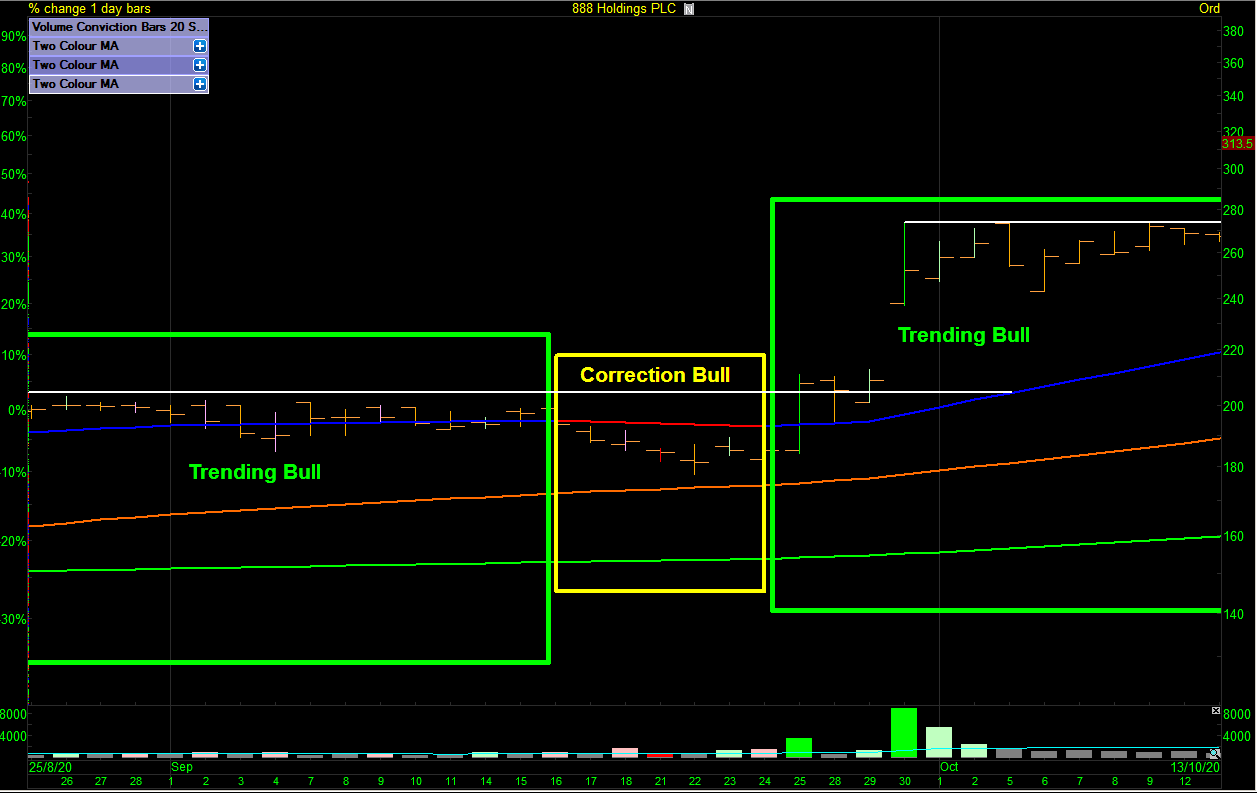
Trending Bull / Correction Bull / Trending Bull
(click to enlarge image)
888 Phases zoomed out viewpoint.
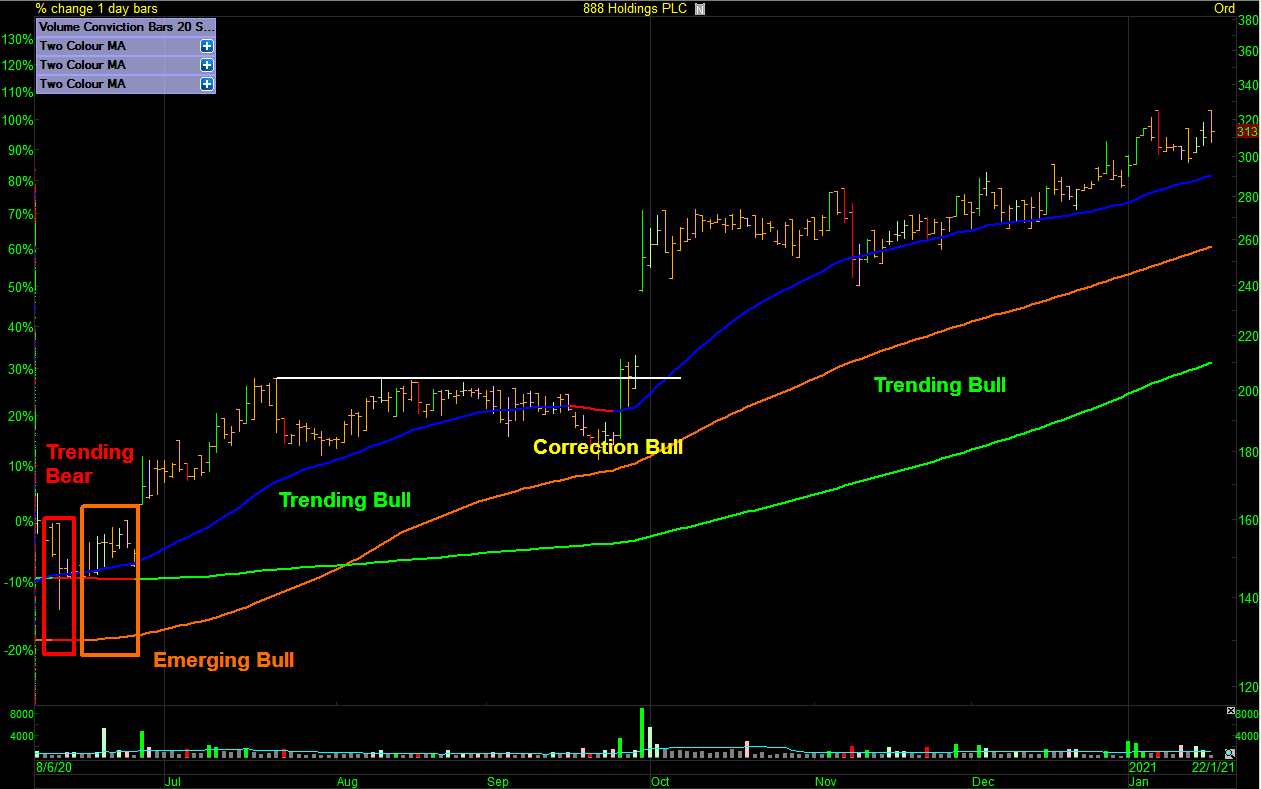
(click to enlarge image)
Note
Trend phases can be in almost any order. A trending bull that moves through correction bull into emerging bear can recover so don’t try to look for a strict order. The way to use these phases is in the beauty of knowing where to find your setup of choice.
Recovery Stocks
Recovery stocks will emerge from the depths of a bear trend so the first phase a recovery stock will visit is emerging bull. If it isn’t rising on the chosen mean trend timeframe then it isn’t recovering. Remember you get to choose your own time frame. Stocks can visit emerging bull then fade back into trending bear so you must think of emerging bull as a risky zone so choose wisely. The setups found in this zone will be breakouts with overhead supply and pullbacks. This zone can be quite volatile.
EVR Emerging Bull Phase Breakout Setup Followed By a Pullback Setup.
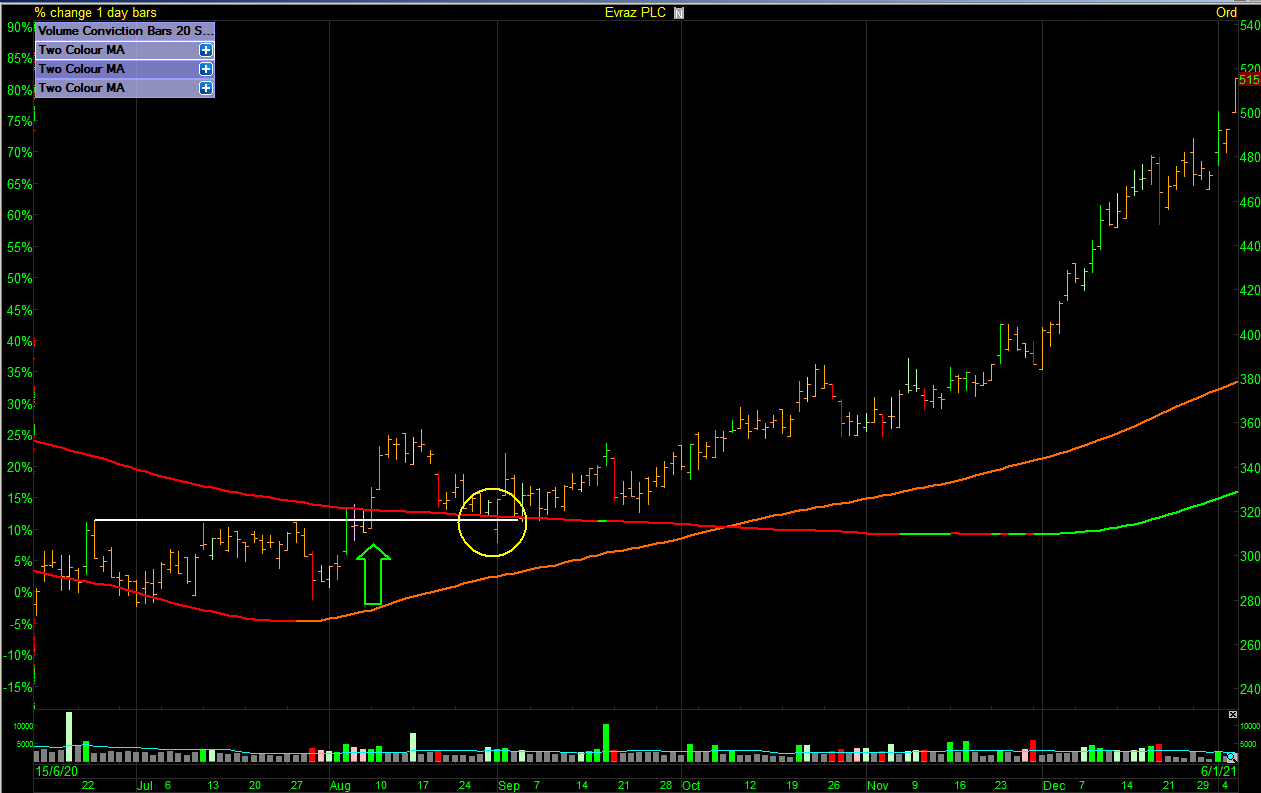
(click to enlarge image)
Trending Stocks
Trending stocks will be found in the trending bull phase. Trending stocks will have moved though the emerging bull phase or could have been launched straight into trending bull from an IPO. With the knowledge you’ve just acquired you can now see if you are early to the trend by simply looking how far it is out of the prior phase. The entry setups found in this zone will consist of shallow pullbacks and breakouts.
AO. Trending Bull Breakout Setups.
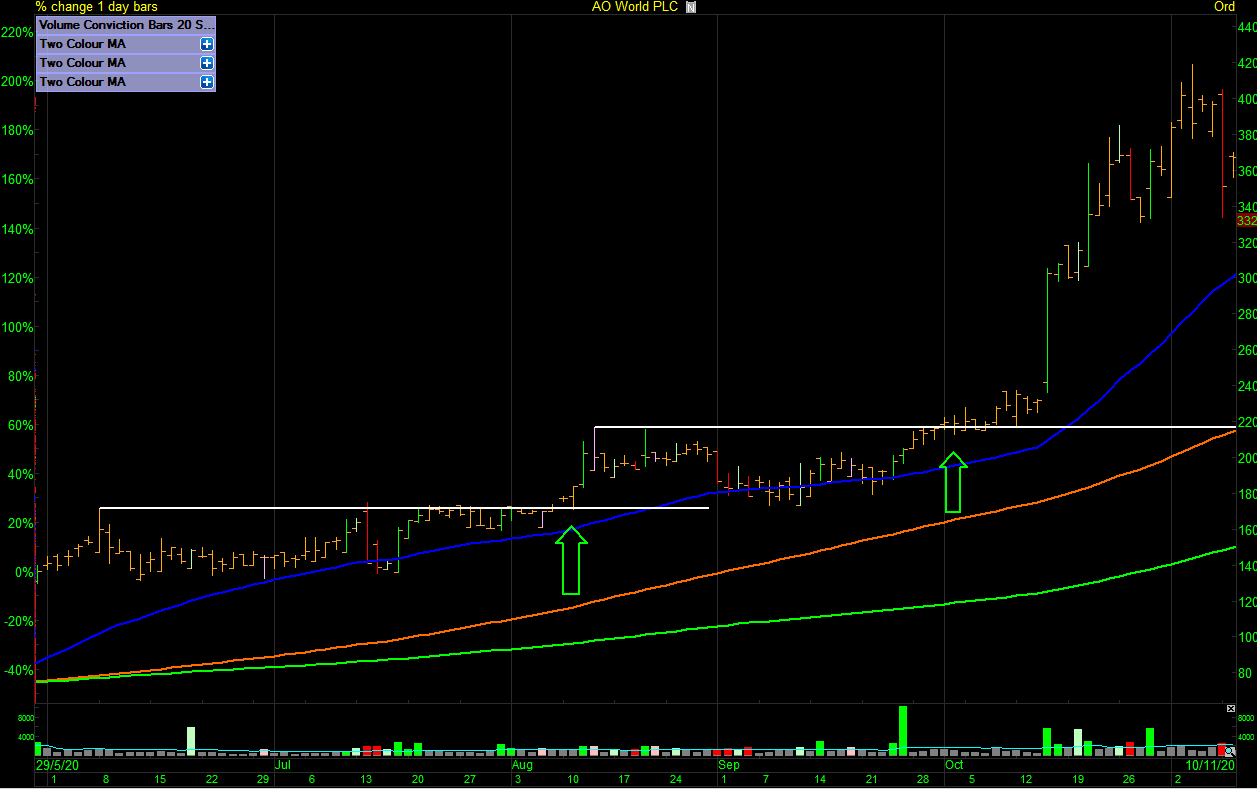
(click to enlarge image)
Pullback Stocks
Buying pullbacks is another option for getting onboard a trend. Deeper pullbacks will be found in the correction bull phase. Correction bull means it is pulling back on the secondary trend timeframe in a primary trending bull phase. The stock price could move below the mean trend average without the primary trend rolling over. This is where maximum reward to risk is found. As long as the 100 day mean trend average is still rising then the primary trend is still up even if price moves below the average in the short term. Don’t overthink this. If in doubt revisit how moving averages are calculated. The setups found in this zone will be deeper pullbacks.
$YETI Correction Bull Pullback Setups.
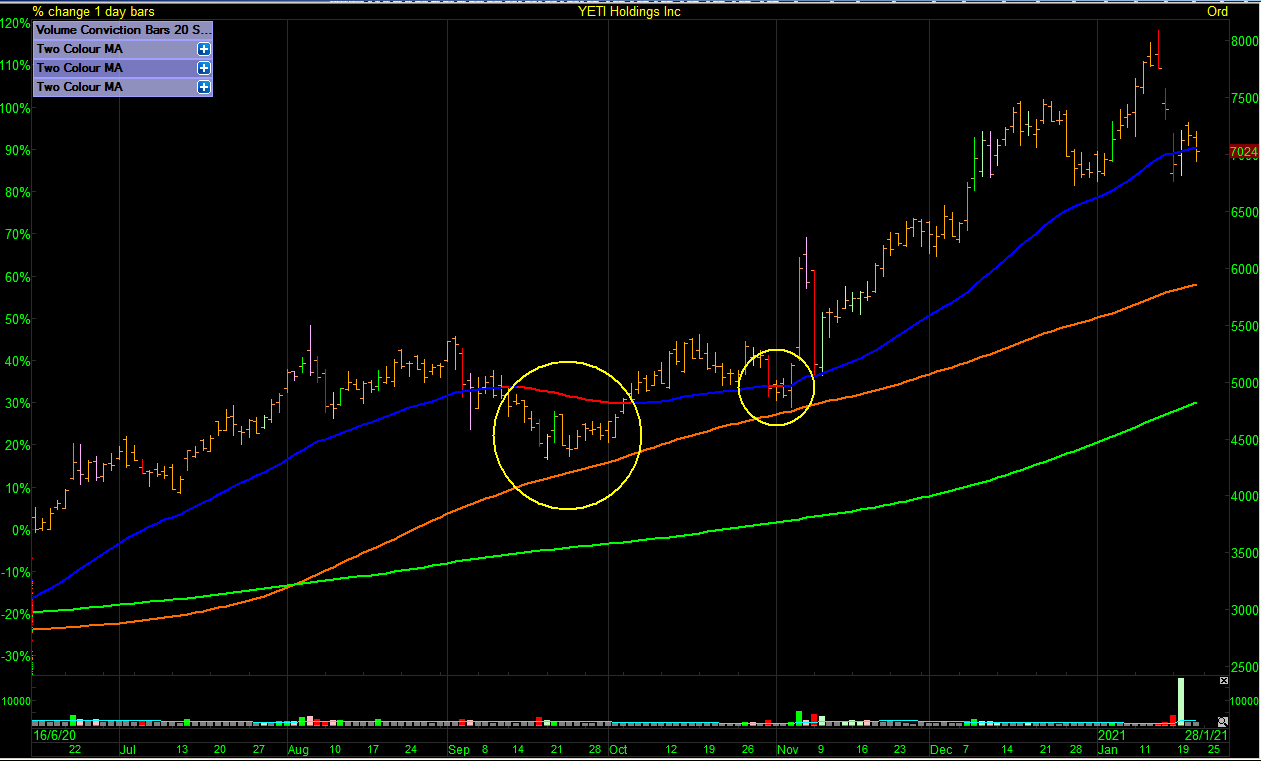
(click to enlarge image)
Working with Phase Filters
When it comes down to the day to day screening of stocks in real time we can setup the ShareScope (and SharePad – see *note below article) to do all this work for us then all we have to do is look in the filter for all stocks currently in the chosen phase. When the market is bullish I’m looking in a maximum of three filters for my own chosen setups. What would take hours of manual screening can be done in under 20 minutes on a daily basis. Routine is the key to being in tune with the markets and these phase filters are the core of my methodology.
For a video tutorial of how to set these up in ShareScope Pro I’ve provided the link below.
Jason Needham
*To set up these filters in SharePad
- Simply head to the SharePad ‘Filter’ drop down
- Select apply filter
- Select ‘New’
- Give your filter a name, description and a designated list if you would like to select one
- And then head over to the ‘Technical’ section shown below.
- If you need any help setting up this filter please do get in contact with the SharePad support team.

This article is for educational purposes only. It is not a recommendation to buy or sell shares or other investments. Do your own research before buying or selling any investment or seek professional financial advice.


