
In this article I’m going to cover some big picture charting and try my best to bring across to the reader three different time frames of managing money or lanes of investing that every investor can connect with in one form or another. In addition, I also want to offer some reasoning as to why some stocks act one way and maybe suit one style over another and highlight what to look for and what to avoid.
Big picture charting
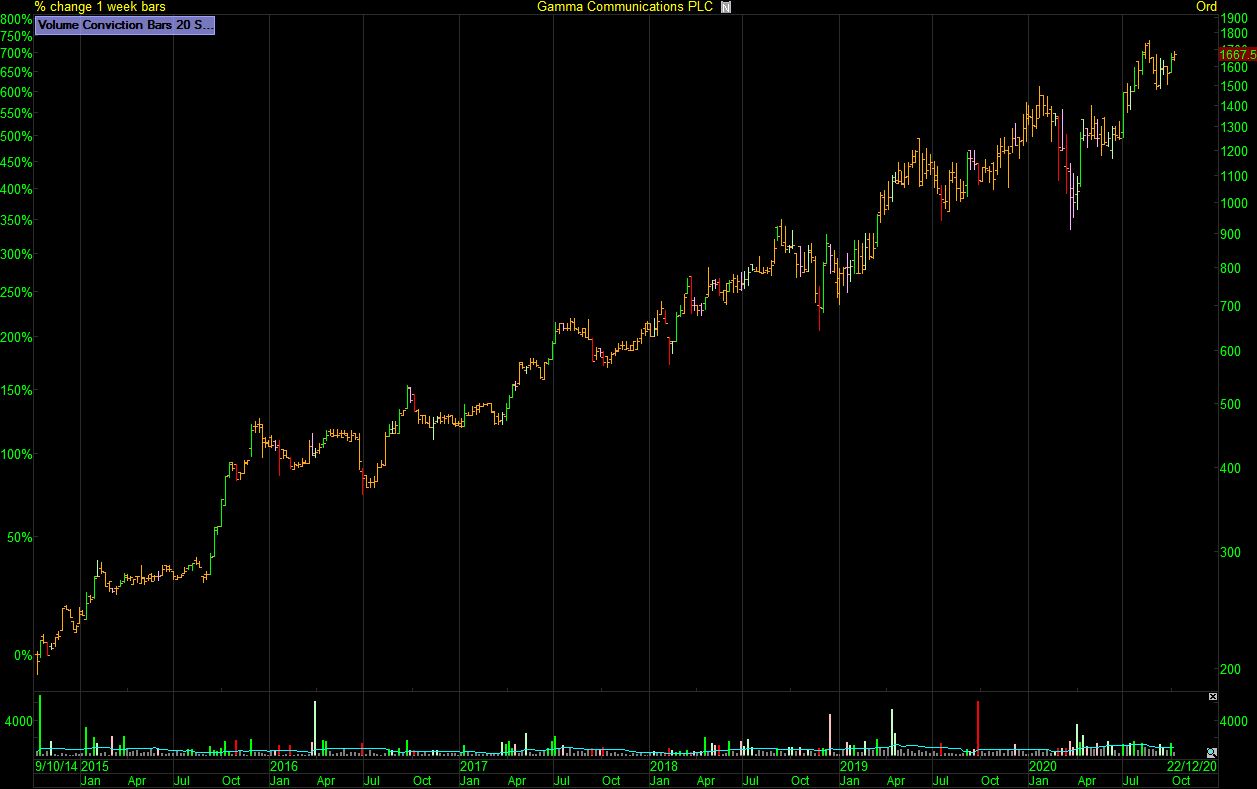
A quick glance at a chart can tell you a lot of valuable information. Where has the price been? Where is the price going? How volatile is the price? How liquid is the price? Does the price trend? Does the price range? All price sensitive events, be it good or bad earnings, guidance, upgrades, downgrades, read across, market rallies, market crashes are baked into the chart. The price action is the end result of all the fundamentals good or bad. Fear and greed in its purest form.
What we see in the zoomed out big picture view is the footprint of how this stock trades. This is valuable information. When I say the zoomed out big picture view I really mean it, I will view the complete trading history from IPO to right hand edge. Using a weekly or monthly log chart It will take a split second to determine how the stock historically trades before moving onto the stock’s current condition of whether it’s in an uptrend, downtrend, consolidating a move with orderly price action or maybe it’s become volatile and at a turning point in trend.
 Source: ShareScope Pro
My aim is to find the best stocks that suit the methodologies I use. Over time you will build up a huge cache of knowledge regarding the action of not only stocks but sectors too. You will be able to single out leaders and laggards of the same group with ease just by looking at the chart alone.
Once I have a good view of the chart I decide which lane of investing the stock is best suited to.
The Lanes of Investing
Generally speaking, there are three lanes of investing in stocks. Short, medium and long term.
- Long Term – Years to Decades
- Medium Term – Months to Years
- Short Term – Days to weeks
Think of it as a target hold time on successful positions. This is a quick rundown of how I choose the right stocks for my methodologies.
Let us first familiarise ourselves with the timeframes involved by viewing the three lanes in chart form.
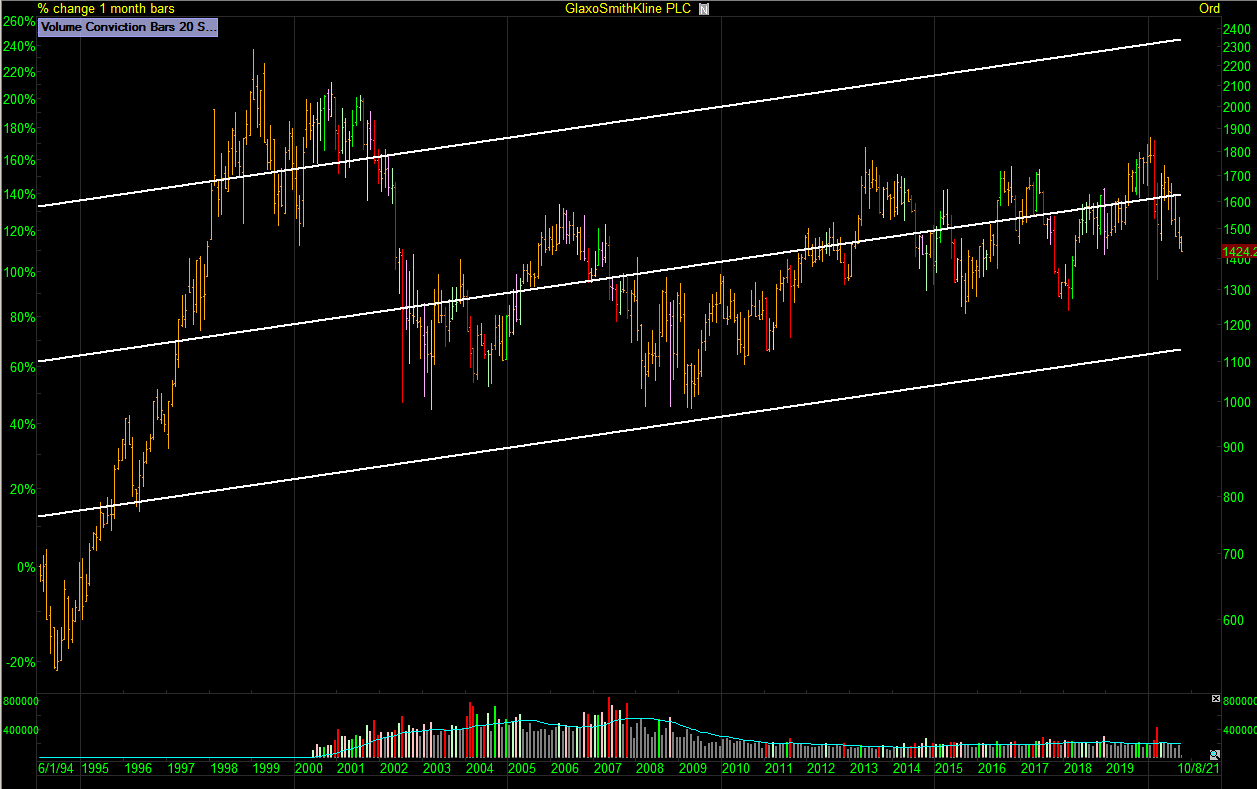
Long Term – Years to Decades (Market Cycle)
Long term is true investing. For me it started with PEPS in the late 80’s and moved onto ISA’s and a personal pension. Its fuelled by long term dollar cost averaging and dividend reinvestment. I’m obviously not screening stocks on a daily basis for this time frame. The monthly chart below highlights the gradual price appreciation over time of GlaxoSmithKline over a 26-year period using the partial trend tool in ShareScope.
Source: ShareScope Pro
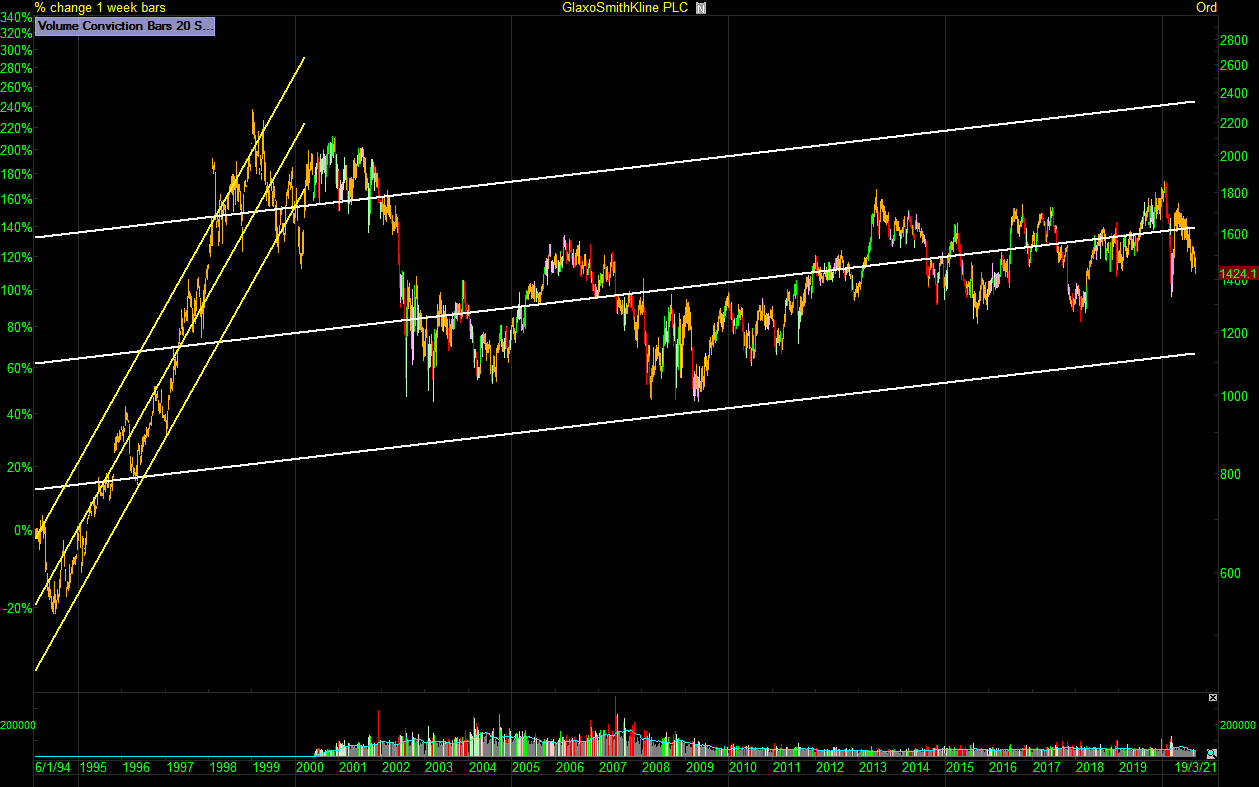
Medium Term – Months to Years (Primary Trend)
This area is aiming to capture meaningful price appreciation so, in my world I’m looking to capture a primary trend. I’m looking for growth stocks and these are generally going to be found in the small to midcap space. I’ve highlighted the primary trend in GlaxoSmithKline below in yellow using a weekly timeframe. The aggressive primary trend move plays out early in the chart as this stock grows into an efficient main market heavyweight. This timeframe is where I focus most of my attention and is suited to trend following.
Source: ShareScope Pro
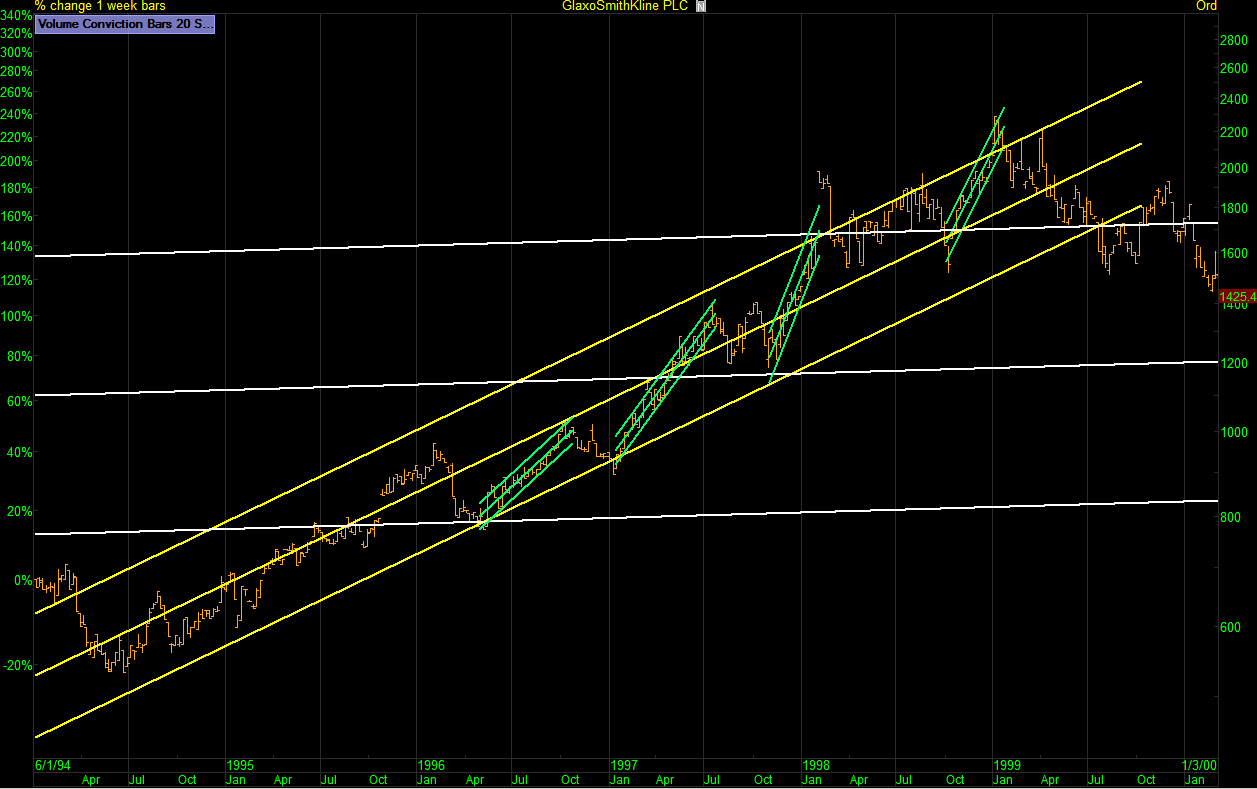
Short Term – Days to weeks (Secondary Trend)
Short term trades do have the option to evolve into medium term position trades. Short term trades will suit more liquid stocks with orderly price action. When trading small moves larger main market stocks are generally going to fit this description. This area will include swing and momentum trading.
Below I’ve zoomed in on the primary trend to highlight the secondary trend in green on a daily chart for GlaxoSmithKline. Note that without a primary trend you have no secondary trend so it’s important not to put the cart before the horse. For the trader who buys pullbacks If it hasn’t traded a high then there is no pullback to buy. The secondary trend moves in the same direction of the primary trend.
Source: ShareScope Pro
Now we are familiar with the three lanes of investing we can move onto the art of stock selection. After years of screening stocks everyday it basically comes down to a game of swing, trend or avoid for me. Some stocks are going to suit one style or timeframe over another. I’m going to look at four price action conditions and note the good and bad characteristics of each.
- Orderly action versus choppy action.
- Efficient action versus inefficient action.
- Liquid versus illiquid.
- High beta versus low beta.
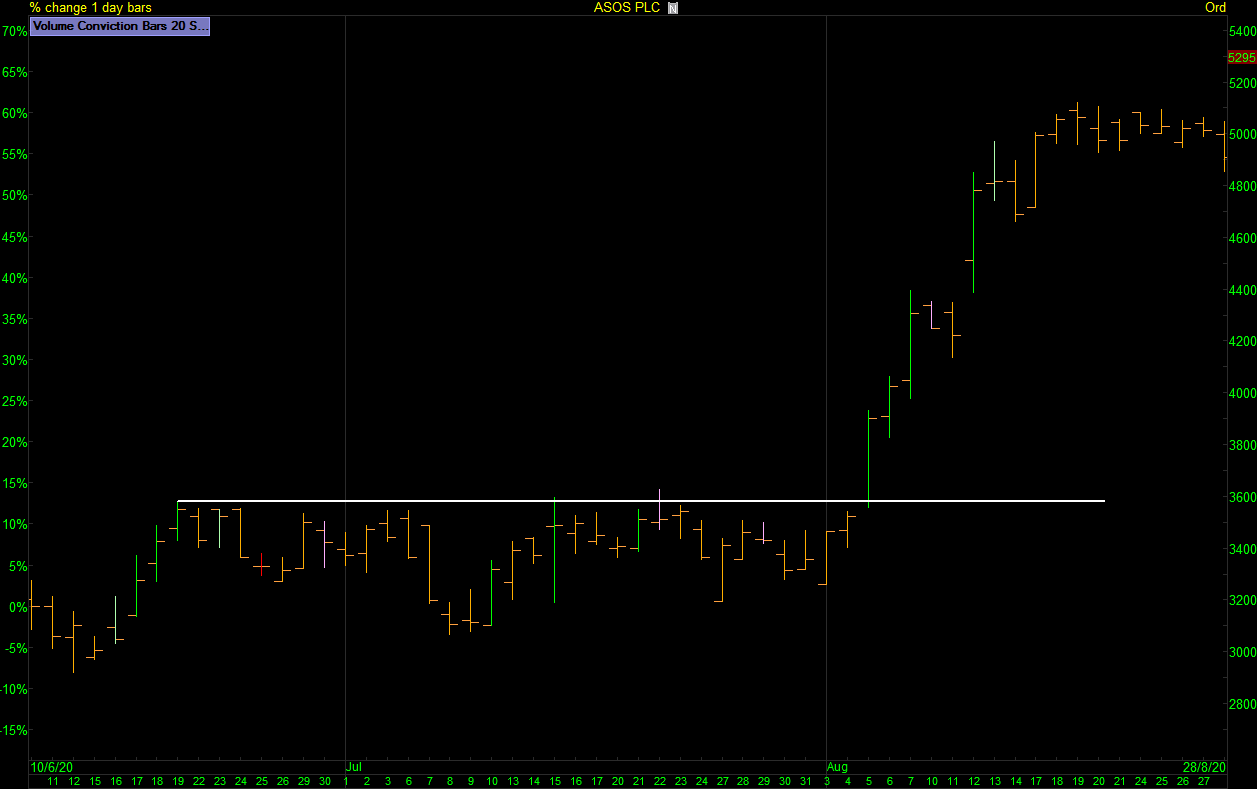
Orderly versus Choppy
Orderly Price Action
Some stocks will trade in an orderly fashion. Orderly price action is generally found in stocks that are in play and have interest. This type of action is going to favour the price action or pattern trader. Orderly price action is good price action.
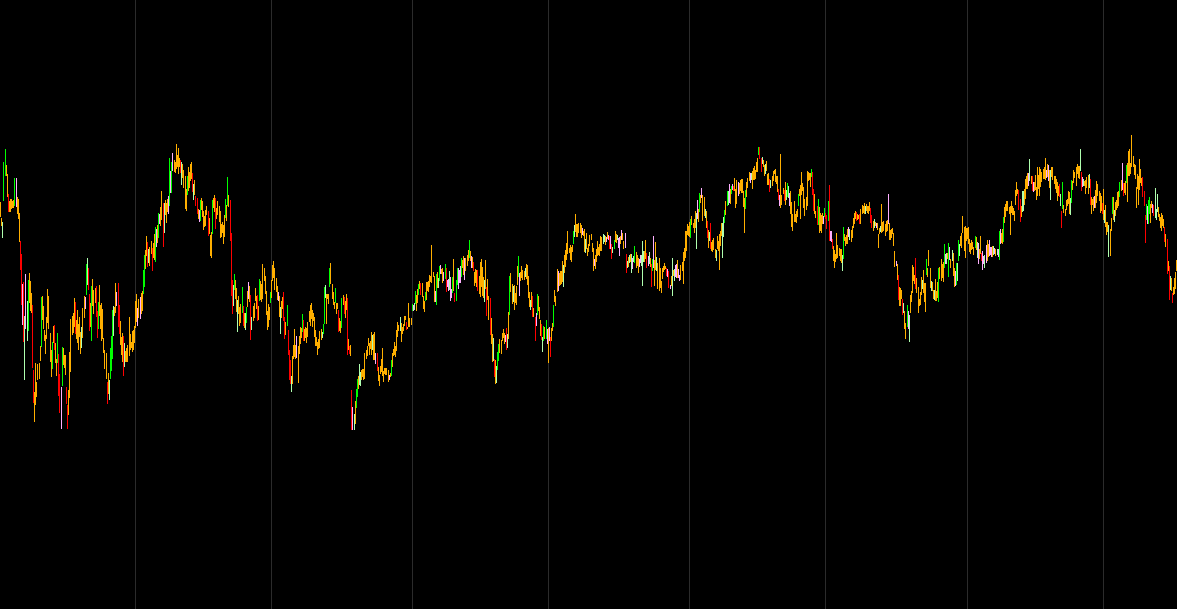
Choppy Price Action
Some stocks will trade in a choppy fashion. They tend to be boring stocks in choppy sectors like electronic & electrical equipment or construction. Low beta sectors with low beta stocks and when you drill down further into leaders and laggards of the group you will find some awful choppy action. These are an avoid for me and don’t get a second glance. Choppy action can be in large or small cap and also liquid or illiquid stocks. It’s the result of a stock having very little interest. Choppy price action is bad price action.
Source: ShareScope Pro
Efficient versus Inefficient
Efficient stocks
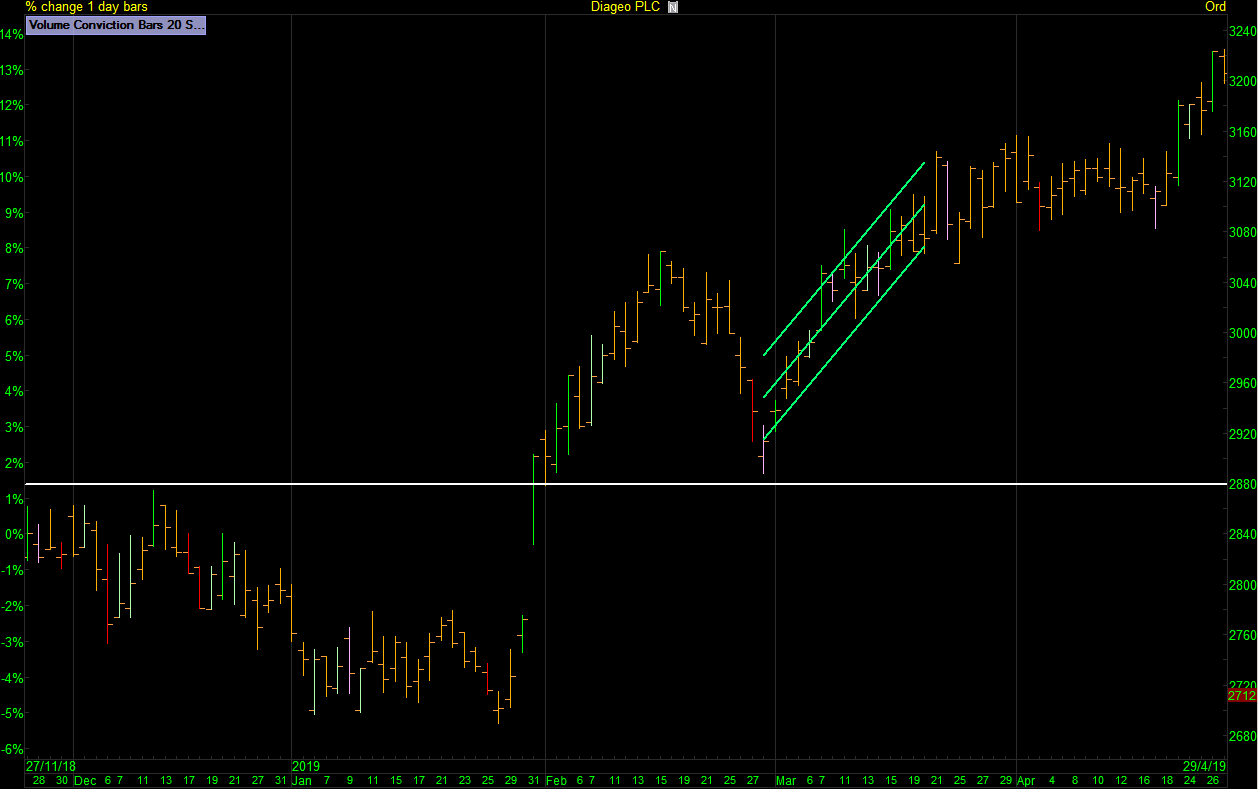
Efficient stocks are stocks that get whipped around by the general market. They tend to be main market stocks. In the UK I put the FTSE350 stocks in the efficient basket. It’s not an exact science but most of the 350 will trade efficiently most of the time. When the market pulls back they tend to pull back with it. Another trait of efficient stocks is they trade nice short trending moves but can struggle when it comes to bigger primary trend runs. This is largely a case of being a member of the FTSE350 means that aggressive growth phase run is usually behind it. It has arrived already. When selecting efficient stocks for shorter term secondary trend methods I look for orderly price action as mentioned above.
After breaking out in 2019 Diageo, being an efficient stock, pulled back early in an orderly fashion setting up for a secondary trend move.
Source: ShareScope Pro
Inefficient stocks
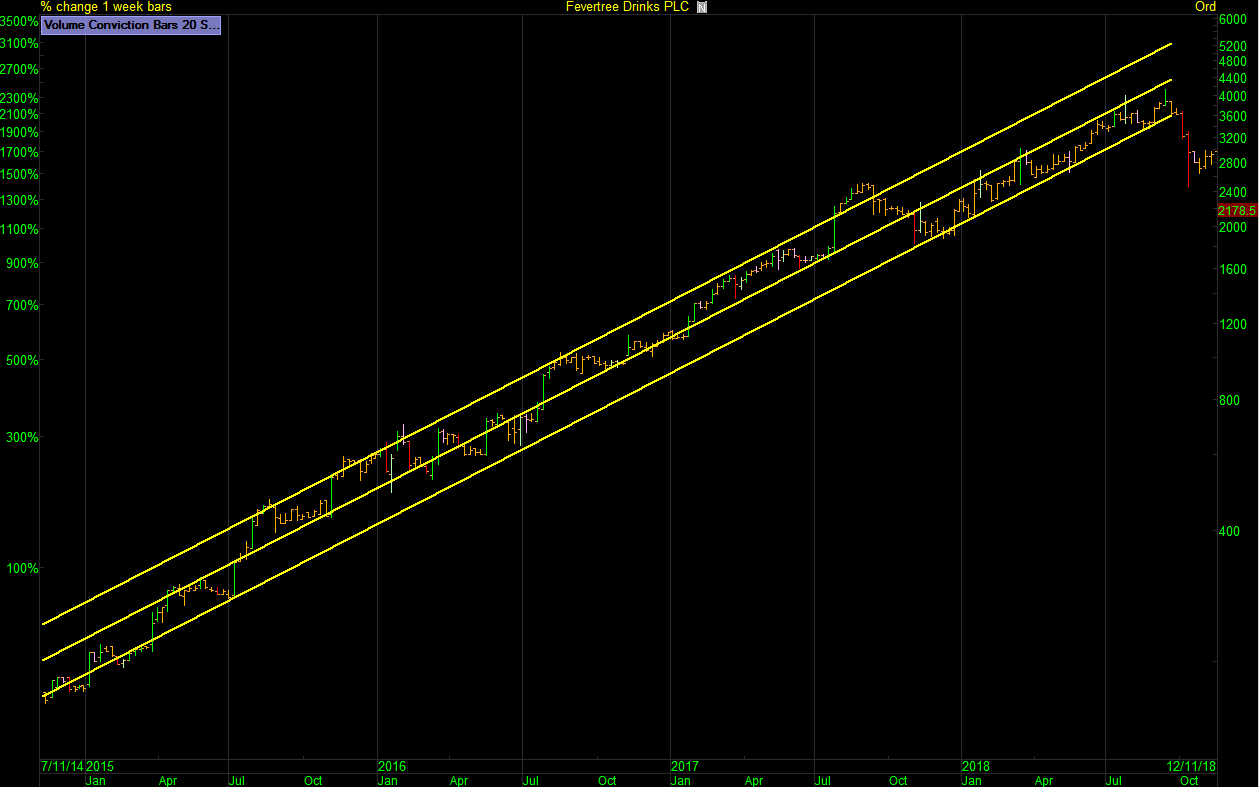
Inefficient stocks are stocks that walk to the beat of their own drum. They tend to be smaller cap stocks though don’t rule out main market stocks as there are always a few doing their own thing in any market environment. Inefficient stocks tend to ignore all but the worst market corrections. The market could pull back and the stock would ignore the general market weakness and keep on doing its own thing. This is the type of action I want to see for a growth stock that could do well on a sustained primary trend move. Stocks that act this way tend to have some underlying reason and high on that list is growth.
Fevertree started life as a thinly traded inefficient small cap and launched upon a sustained primary trend run before transforming into a larger efficient trading stock.
Source: ShareScope Pro
Liquid versus Illiquid
Liquid stocks are going to suit shorter time frame holding periods and this would be swing or momentum moves. The simple reason is reward to risk. The easy way to explain this is from a worst-case scenario. If you try and swing a thinly traded illiquid stock that has a 5% spread for a 20% move then you’ve already lost half of the available move in the spread after the round trip is taken into consideration. Illiquid stocks are going to be fine if you’re shooting for big moves. You won’t complain about a 5% spread after a 200% move. The truth is many of the best growth stocks in UK small caps tend to be very illiquid and thinly traded. It’s not an issue on the primary trend.
Fevertree was Illiquid & inefficient while on it’s primary trend run.
The daily chart below shows lots of gaps in the price action and many short range days where very few trades were executed.
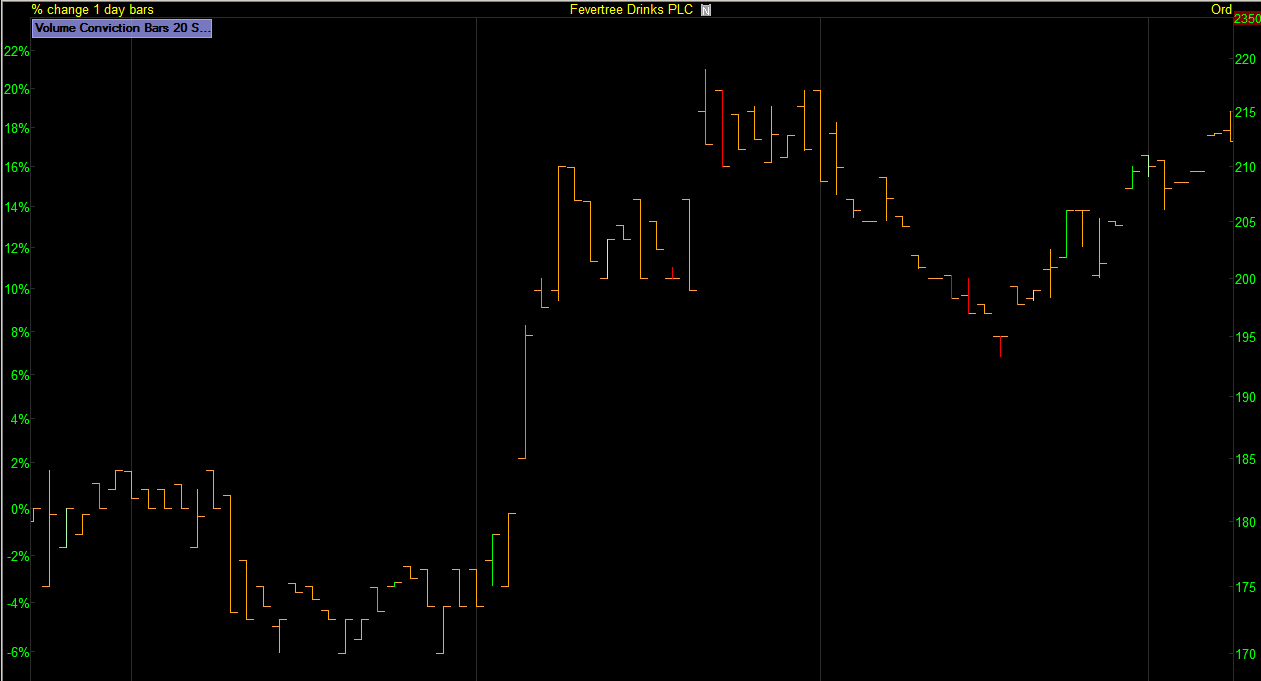
Source: ShareScope Pro
Fevertree’s current state is now liquid & efficient.
The daily chart below has less gaps in the price action and visibly trades more range throughout the daily sessions.
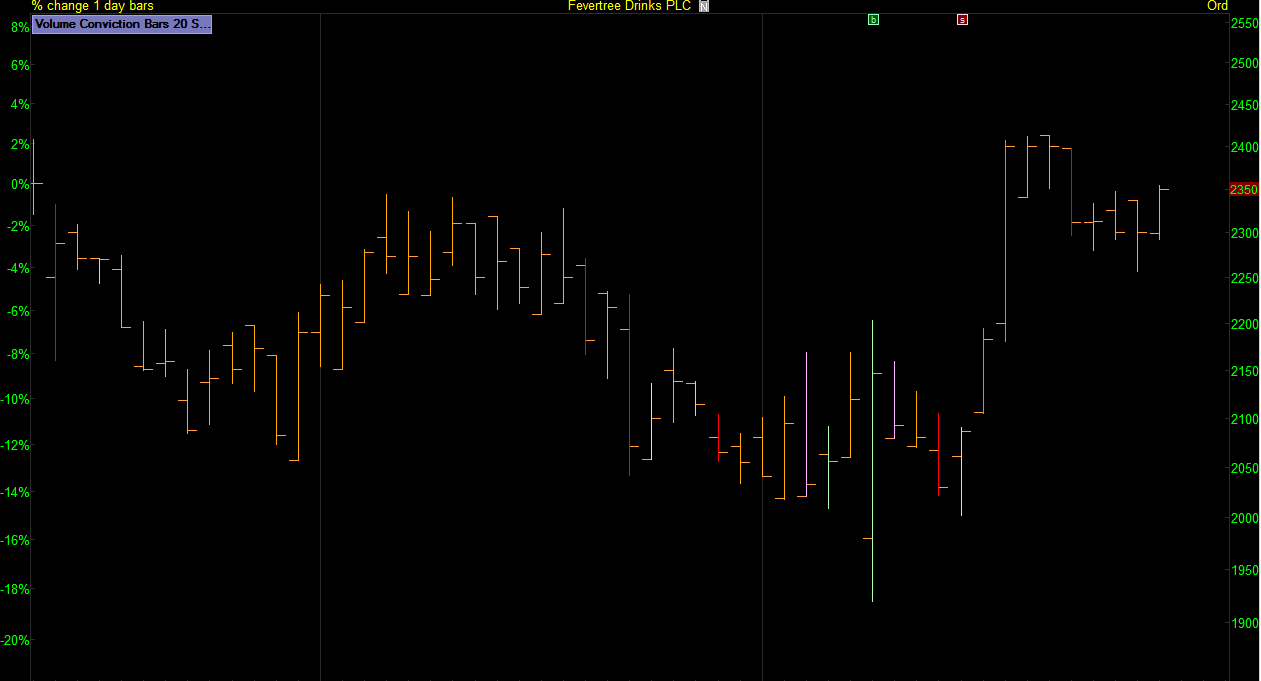
Source: ShareScope Pro
High Beta versus Low Beta
Fast moving High beta stocks can be fantastic for trend and swing methods where as the slower low beta stocks could be better suited to the investor. Compare the charts of Zoom and BBOX below as they emerged out of their stage 1 bases and you can clearly see the speed and price appreciation high beta can deliver but what if you’re drip feeding on a monthly basis as an investment? Maybe a stock like Tritax Big Box REIT would be better suited with its dividend and slower accent. Two different speeds on two very good charts.
Zoom – High Beta
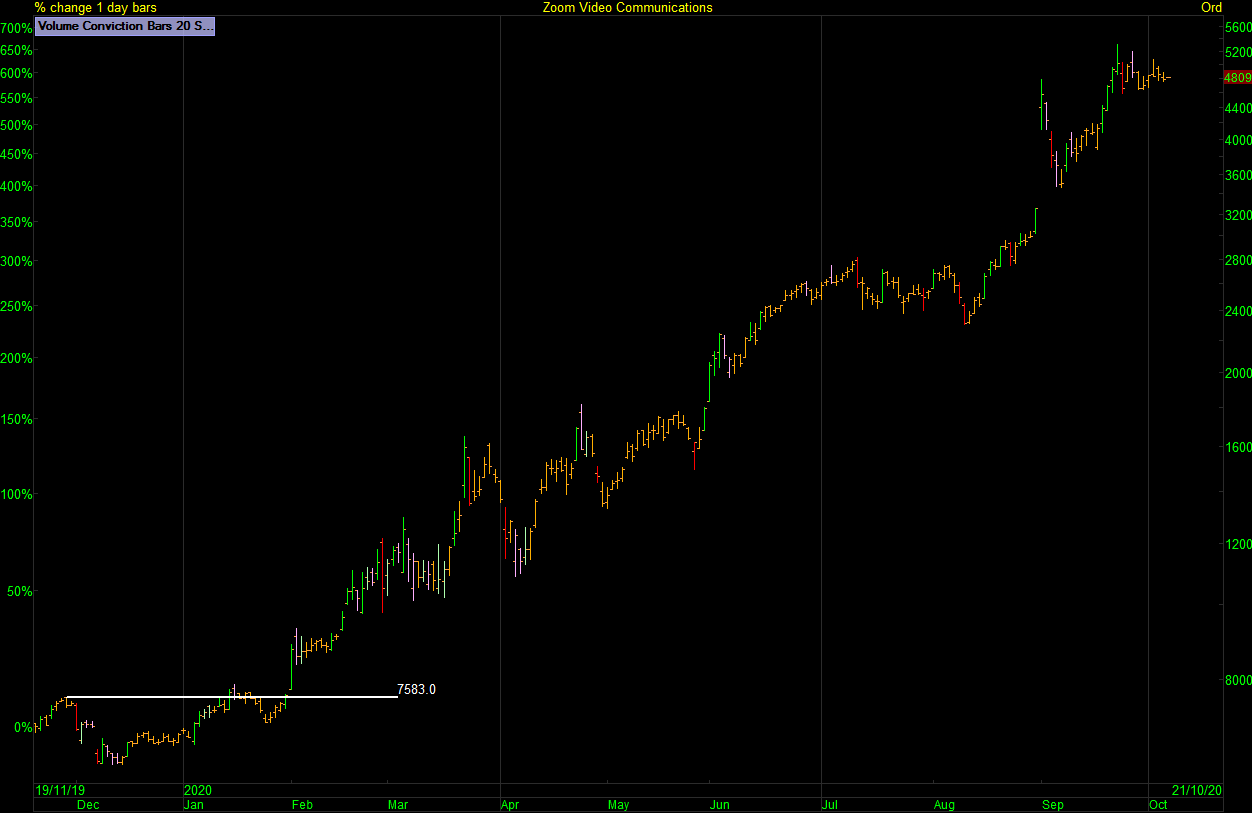
Source: ShareScope Pro
Tritax Big Box REIT – Low Beta
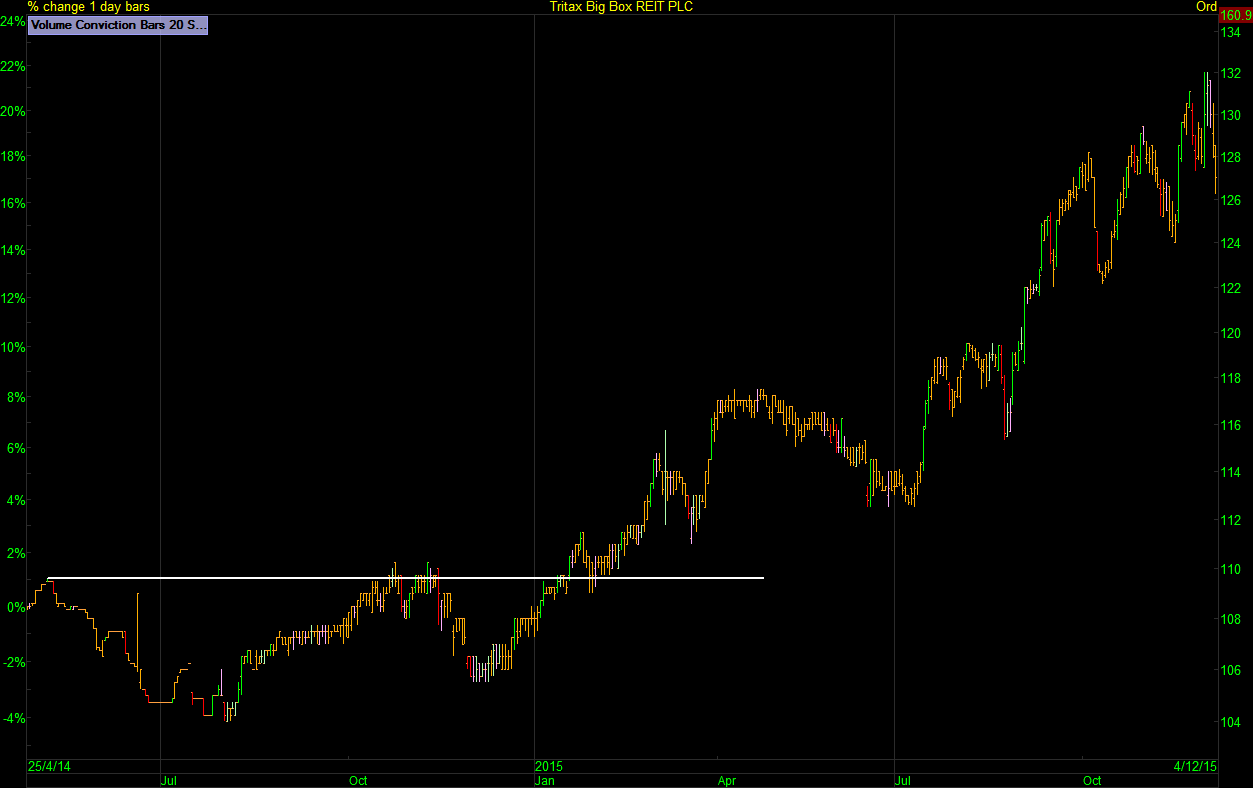
Source: ShareScope Pro
Marrying the stock to the methodology.
It’s so important to know what you’re trying to achieve with your investing, with your position trading, with your swing trading. It can’t be understated. Choosing the best suited vehicle is going to dramatically improve the efficiency of any methodology. It’s not an exact science as there will always be some grey areas. A stock that seems to possess some beta dips back into a base and goes to sleep. A low beta Sloth like stock suddenly wakes up and starts to move on game changing news. The right hand edge is always evolving but studying how stocks act and knowing what lane you do business in will help you see things clearly from a higher place. Knowing you’re making better selection criteria decisions will help you stick to the plan. If you’re looking for aggressive growth then some stocks are quickly dismissed as they simply don’t fit the methodology or the time frame. If you want to swing a 20% move then some stocks will be better suited than others. As I said at the top, over time you will build up a huge cache of knowledge on how stocks actually trade and hopefully I’ve highlighted a few points that you can relate to and help you with your own stock selection.
Key Points
- Zoom out to see the big picture.
- Determine the Lane. Secondary Swing, Primary Trend or Investing Time Frames.
- Marry the stock to the methodology. An orderly small cap growth stock with a wide spread suits a primary trend time frame etc.
- Avoid choppy or volatile action that will prove hard to manage.
Jason Needham
@stealthsurf
This article is for educational purposes only. It is not a recommendation to buy or sell shares or other investments. Do your own research before buying or selling any investment or seek professional financial advice.


