All the best trends in the market need to start somewhere. I’m going to show you how to define a trend using two methods and offer some thoughts and reasoning on position management. For my next two articles I will focus on primary trends. If you are unsure what I mean by primary trends please revisit my first article.
2 Ways to Define Trend
I’ve chosen two methods I use in my own trading to define trends and highlight this methodology.
Part 1: Breakouts – Using 52 Week High’s or Low’s.
Part 2: Moving Averages – Using Multiple Moving Averages to define trend phases..
Breakouts
Trading breakouts is a very straightforward method to get onboard a trend. Price trades or closes above or below your chosen lookback period level and you enter the market in the direction of that signal. You get to choose your lookback period and I’ve chosen 52 week high’s and lows for this explanation.
Taking a long position at 52 week highs is going to be extremely hard for most people to do so lets chip away at that psychological brick wall with some hard facts.
- Stocks will always trend.
- What worked in the past still works in the present and will continue to work in the future.
- We don’t need to reinvent the wheel.
- We do need to be aware that all breakouts don’t necessarily turn into trends but I can assure you that all trends will have a breakout.
- All those fantastic trending stocks we look at in the rear view mirror all started with a simple breakout.
- In fact many of the best didn’t look back after trading the breakout so waiting on a pullback or trading around a position could easily leave you sat in cash watching the stock melt higher without you.
- Its very important to not get too clever once you are riding a trend. If you start managing your position in the noise within your chosen parameters you could cut a good trend short. Saving pennies could be costing you pounds.
52 week highs – A line in the sand
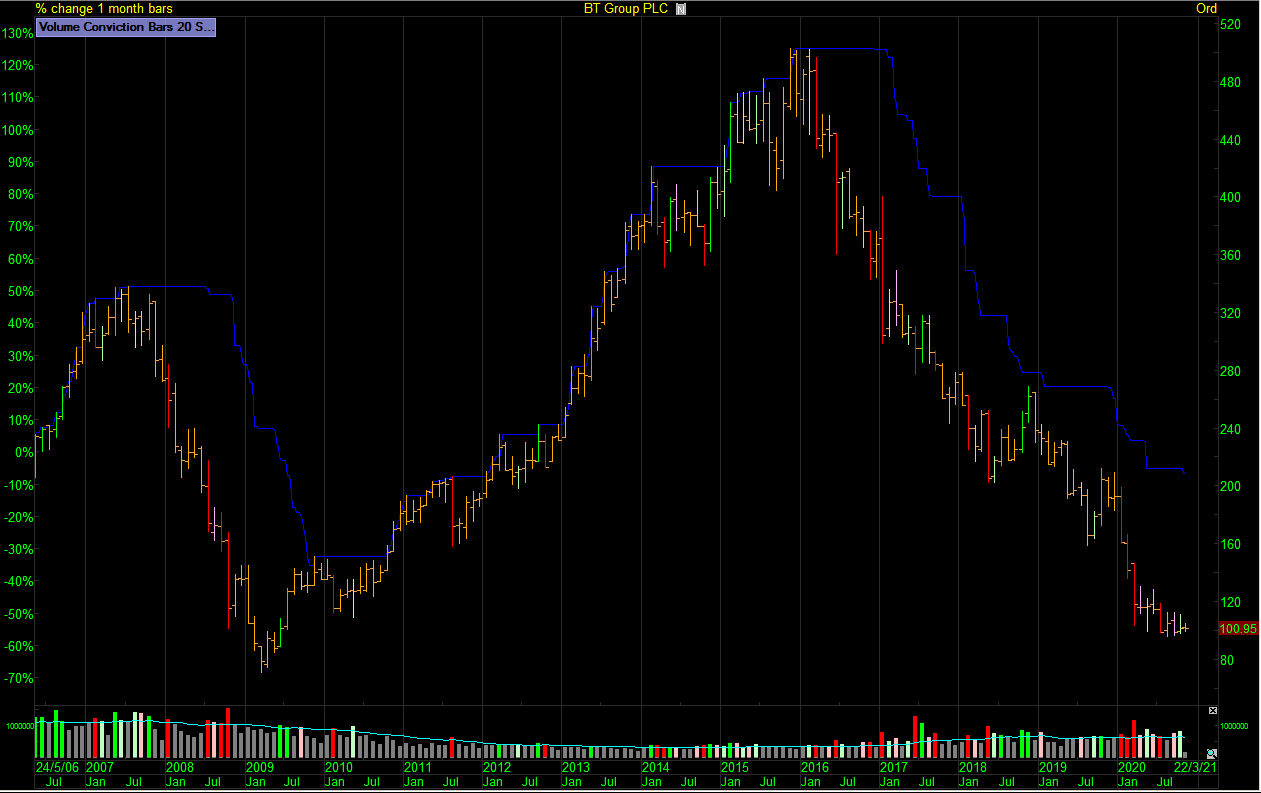
Below I’ve added the 52W high line in blue to the monthy chart of BT Group using the Price / Donchian channels indicator in ShareScope Pro. The first thing to note is that rising stocks will visit 52 week highs if the share is rising on the primary trend. Sounds very simplistic I know but If you want to own good stocks that are going to make you money through price appreciation on the primary trend they need to be rising to do that. The second thing to note is stocks can trend lower for many years without visiting that 52 week high line in the sand. The last time BT Group traded at 52 week highs was 30/11/2015. Straight out of the gates this observation can make and save you money.
BT Group 52 Week High Line.
52 week lows – A line in the sand
Below I’ve added the 52W low line in red to the monthy chart of BT Group so we can see both sides of the primary trend. The first thing to note is that falling stocks will visit 52 week lows if the share is falling on the primary trend. Again it sounds very simplistic I know but we now have two simple but robust rules for our time frame. If I am long a rising stock based on a 52 week lookback period timeframe then it makes sense that the lower 52 week low channel would be the last chance saloon when it comes to exiting the trend.
BT Group 52 Week High & Low Lines.
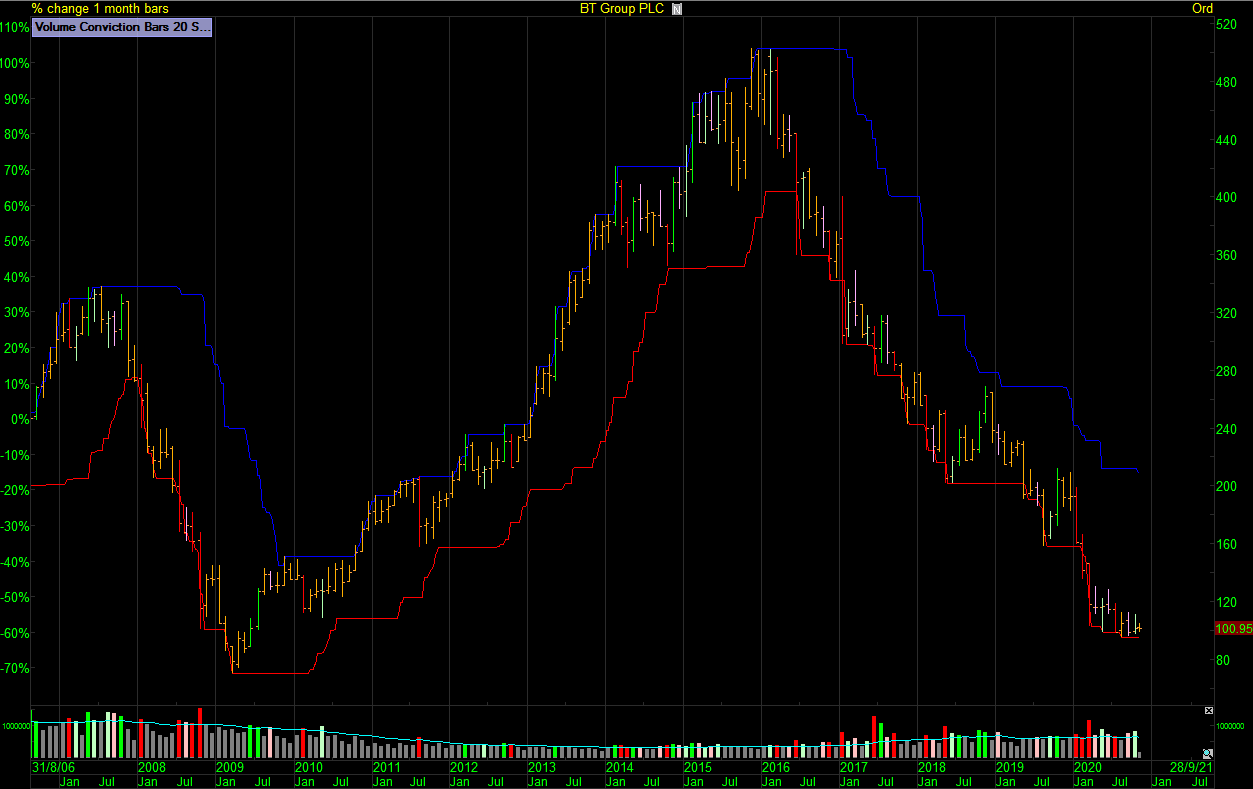
The big picture view highlighted above is where the clearest answers are found when deciding if a share is rising or falling. For the investor who buys pullbacks you can clearly see if you are buying a pullback in a rising stock or potentially buying the first leg down of a new down trend and the goal as a growth investor is to get the portfolio loaded into rising stocks. A stock that is trading 52 week lows is not a rising stock on my chosen time frame.
As a case study lets look at the rise and fall of a past leader. Fevertree.
Fevertree trades 52 week highs
To position for a trend we need a simple yet robust method to give the green light to enter our trade in the direction of the signal. I’ve chosen a daily close above 52 week high’s for the long entry and a daily close below 52 week lows for a long position exit.
Fevertree Drinks closed above its 52 week high line 8 days after it listed and repeatedly closed above 52 week high’s until July 2018. At no point in the whole primary trend run did Fevertree ever trade near or at 52 week lows.
On the chart below the blue line represents 52 week high’s and the red line represents 52 week lows using the price donchian channels in ShareScope Pro.
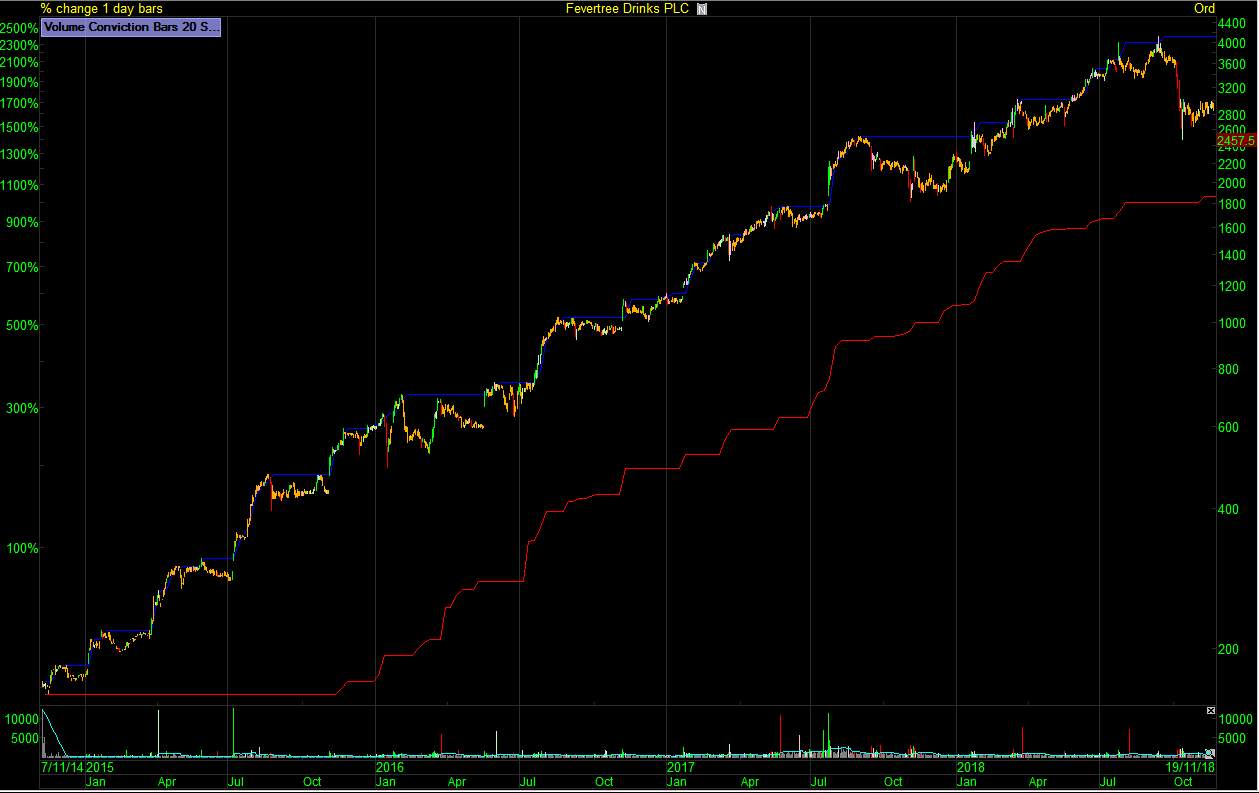
Fevertree trended strongly for over 2000% after trading that first close above its 52 week high line from the IPO. Repeated follow-on signals worked but the key to capture a trend is to trade the signals close to where the trend starts as they offer most reward. If you see a huge trend in the rear view mirror then you’ve already missed a huge trend and what we see in a trend like Fevertree is what we call an outlier. This is the trend of all trends and when it finally did pull back to that 52 week low line the trend had come to an end.
When the trend ends
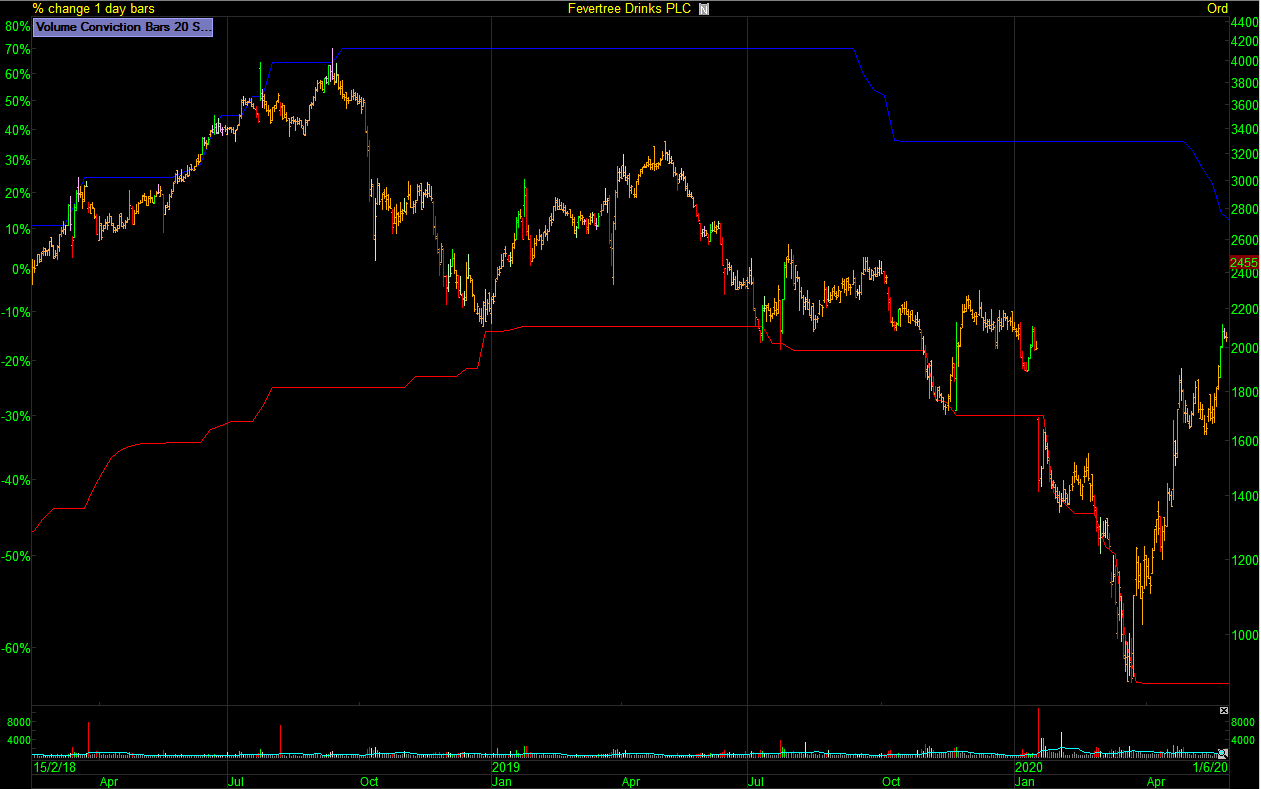
Now let’s take a look at when the trend ends using the same time period but focussing on 52 week lows. I know this might seem almost too simple but stocks in an uptrend do not make repeated visits to 52 week lows. The chart of Fevertree below shows the deep retrace in 2018 followed by a lower high and then on the 8/7/2019 Fevertree closed below its’s 52 week low for the first time. Fevertree proceeded to half in price over the coming months and in March 2020 was -78% down from highs.
How low can they go?
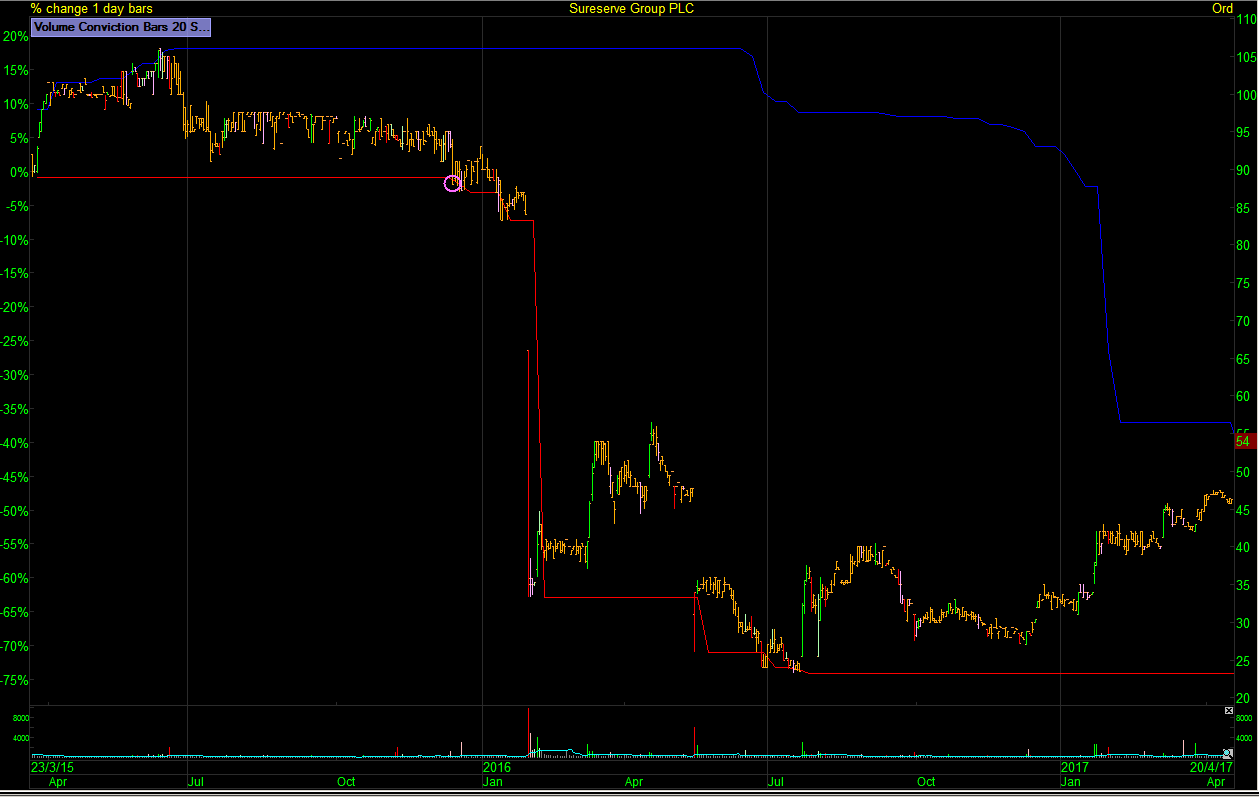
There is the possibility that prices could fall a very long way after visiting 52 week lows. The first visit to 52 week lows for BT. in 2007 resulted in a -75% move that took about 15 months and the second in 2016 has fallen -76% and taken over 4 years to date. So as you might expect there’s also a time factor playing out if you’re on the wrong side of the trend. The reverse is also true. There is the possibility prices could rise a very long way after trading 52 week high and the long side has the advantage as its unlimited. Nothing is too high or low when it comes to stock trends so a simple health check would be to check which side of the 52W bracket a stock of interest traded last. If you like a stock based on your selection criteria and it’s trading new 52W lows you might want to dig a little deeper. In 2015 I was long on the IPO on Lakehouse now called Sureserve. It fitted my template perfectly but on 11/12/20 it traded 52 week lows and I sold. The trend turned down and it took a little while for the reasons to be known but as they say, gaps tend to happen in the direction of the trend and for Lakehouse it resulted in a -50% haircut overnight.
Lakehouse trades 52 week lows (red circle I sold)
Signals & Front running
To wrap up this article I though it would be good to cover entry signals for breakouts and the reason we keep it simple.
First thing to note would be if you plan to ride primary trend moves you are not going to look at the entry after a huge trend and say I missed the first 3% so no need to micromanage by jumping onto an intraday chart for what is an end of day signal.
Secondly I will point out that all winning trades actually traded the signal. Some losing trades also traded the signal.
The third and most important point is that every idea that didn’t trade the signal would have been a loser. 100% of ideas that don’t trigger the simple breakout signal would be losers so by having a signal and then front running it you enter into the world of prediction and when it comes to trends we just follow along.
Key Points
- Rising trends repeatedly trade 52W high’s and don’t visit 52W lows.
- Falling trends repeatedly trade 52W lows and don’t visit 52W high’s.
- The first signal captures the highest available move.
- If you see a big trend then you’ve missed a big trend.
- Trade the signal, not the move.
My next article will cover Lessons from the Trend (Part 2): Moving Averages.
Jason Needham
@stealthsurf
This article is for educational purposes only. It is not a recommendation to buy or sell shares or other investments. Do your own research before buying or selling any investment or seek professional financial advice.


