
Cups and handles, and bowls, have been very popular with trend traders. These patterns can be powerful as they show sentiment of the stock gradually changing and buyers slowly overpowering suppliers of the stock.
This is a classic cup and handle pattern.

The cup is the deeper bowl, along with a handle which is the stock hitting resistance, dipping slightly, and attacking the resistance zone again.
We enter the stock once it breaks the resistance zone, and we can place our stop below the low of the handle.
Here is a chart of AIM listed Infrastrata (INFA).
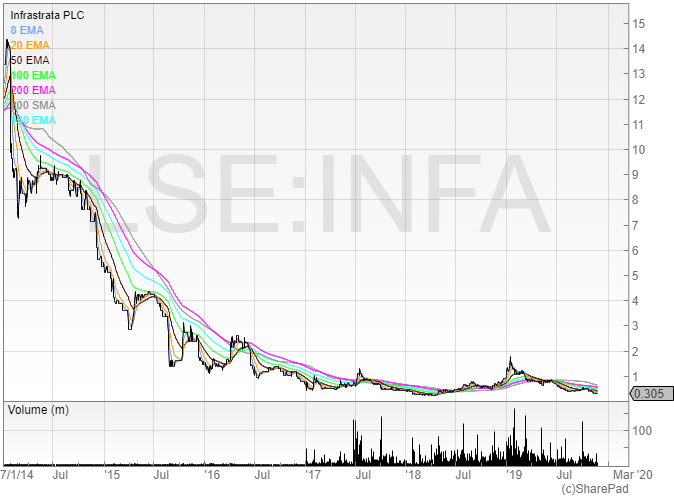
For the first three years of the chart, all the moving averages were trending downwards. Then, towards the end of 2018, the technical chart appeared to be significantly changing, with both of the 200 moving averages beginning to point upwards for the first time since 2013.
The price broke through both the 200 moving averages and began to rally. It rallied almost 300% from the lows before retracing.
One of Mark Minervini’s strict requirements for his ‘Volatility Contraction Pattern’ – or VCP – is that the stock must be at least above 100% higher than the low. This demonstrates to him that the stock is potentially changing its trend and that supply at the lows has been overwhelmed, and the price wants to go higher.
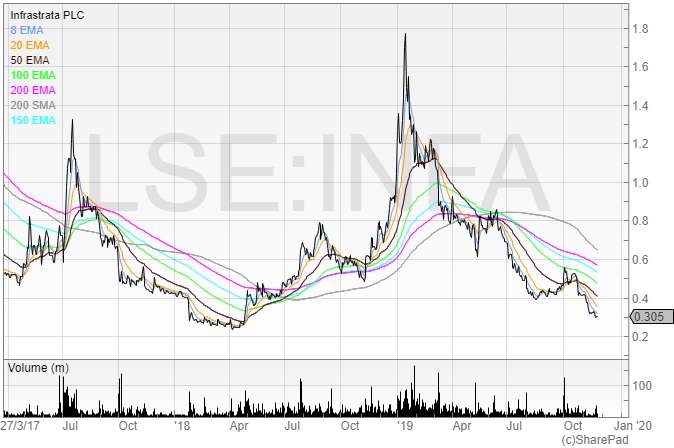
When the stock began to rally again after the retrace it meant that the chart had put in a higher low.
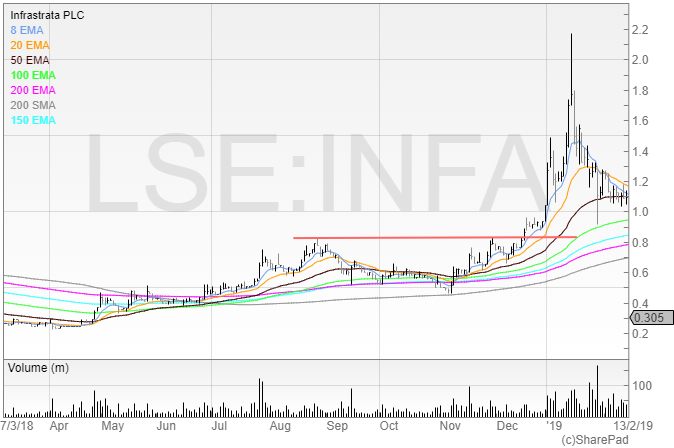
Here is the cup and handle pattern in action. Once the stock had begun to rally, I set an alert for when the price was approaching the red line. This would give me a heads up in advance of a potential breakout (you can read more on how to trade breakouts from Michael’s free breakout guide here).
The stock hit resistance, and pulled back. This is the cup pattern. However, rather than sink nearly 40% it snapped back up the breakout point, forming the handle.
The cup and handle is a great trading pattern, as it offers a low risk and potentially high reward trade. The higher the handle, the less risk we can employ. If the handle’s low is only 10% below the resistance price, then we can put our stop a few points below the support level (remember – only amateurs place stops on support points).
This gives us two things:
- A high probability entry, as once the stock breaks resistance it is likely to continue
- An attractive risk to reward ratio
I can’t predict the future, and neither can anybody else, but I do know this: a trader who regularly takes trades with high probability entries and good risk management will make money net of fees, so long as they are position sized well enough to allow their edge to play out in the long run.
If you run a 5% stop – you can afford 20 losing trades before you’ve blown your account.
Running a 2% stop allows you to have 50 rolls of the dice before the account is blown.
Begging bowl
Infrastrata put in a peak of 2.18p and now sits at 0.305p. That’s a decline of 86%, and with the following equity placings there are now a lot more shares in issue too. This is a stage four stock, and could’ve been avoided if those who were invested had checked the cash flow statements.
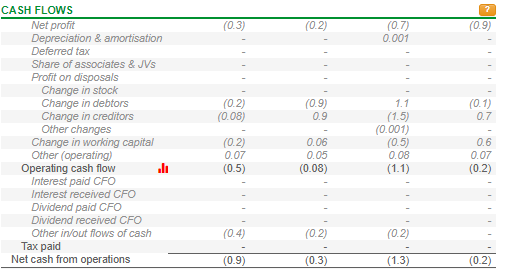
The company had never generated a single penny in cash from its operations.
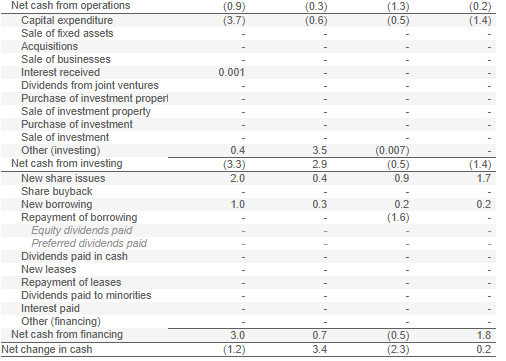
The company had also spent large amounts on investing (capital expenditure), and the positive cash flows from the financing statement show that the company had been funding itself by raising cash through either equity or debt.
When a company’s business model relies on whipping out the begging bowl to pay director salaries and keep the lights on, it’s best to avoid investing in that company.
Bidstack
This is the chart for Bidstack plc, which reversed into a cash shell.
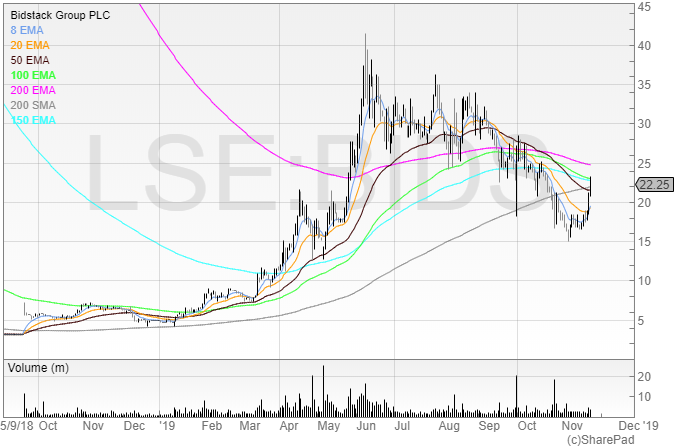
Can you spot the cup and handle? Here it is.
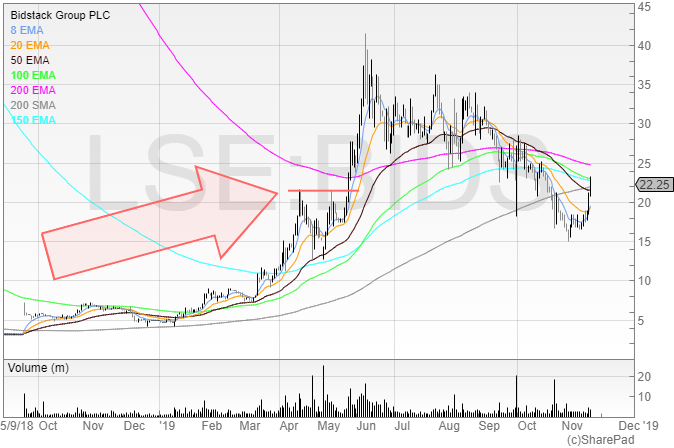
No doubt many had felt they’d missed the boat when the price was 21p. After all, it had risen from the lows of 4.5p in quick succession. Everyone was talking about it, and volume was through the roof. But the stock quickly increased over 100% from that point in just two weeks. The cup and handle provided the setup.
Of course, if you had held on from the peak then you would’ve suffered a drawdown of over 50% – stomach churning even for the toughest of investors. The key to get out of these hot plays is when the catalyst has been and gone, and in this instance everyone was hyped on social media and bulletin boards for the launch of Google Stadia.
Post-Google Stadia, the stock gapped up in what looked like an exhaustion gap.
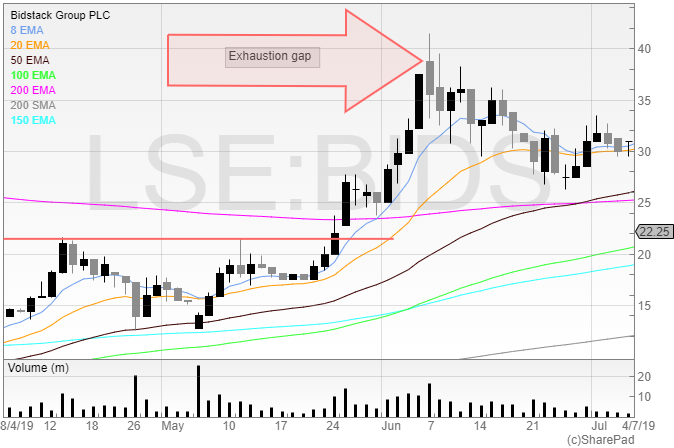
I warned of this in my Facebook group as I had been ringing around to check if there was any borrow available to short the stock, and since then the stock has yet to make a new high.
This is – again – why risk management is so important. Popular stocks tend to have very unpopular falls, and those who are left holding the baby can be left nurturing devastating losses.
Bowls
Bowls are very similar to cup and handles – they are cups without handles. But they are a brilliant pattern to detect, as very often the bowl begins to steepen and accelerate as the herd begin to catch on. Finding a bowl in its early stages and hanging on can be a very profitable trade.
The best bowls are the ones with the slow curved bottoms, rather than the scruffy and spikey bowls. Bowls where a smooth line can be drawn tracing the price show the gradual decline in supply and gradual increase in accumulation.
A bowl that has been forming over a period of years has a much better chance of success than a bowl over a few weeks – the longer the timeframe the more likely the buying is for a step change in the company’s prospects and fundamentals.
Here is a bowl that has been forming for years.
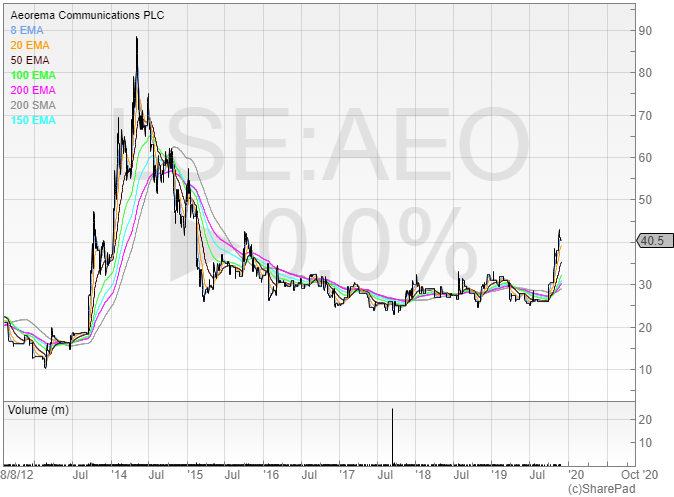
The price started its decline in early 2014, and gradually slowed, finding a bottom after the huge volume in July 2017. I believe this was when a group of investors (including myself) took out the two selling directors who moved on from the business and retired.
Since then, the price has bumbled around with the moving averages turning up, and – despite a fall back to the 25p level – is now trending upwards making multi-year highs.
I look for bowls when flicking through the charts as if a chart is making a long-term bowl it prompts me to see if there is anything there.
Here is another bowl, that has since sharply accelerated.
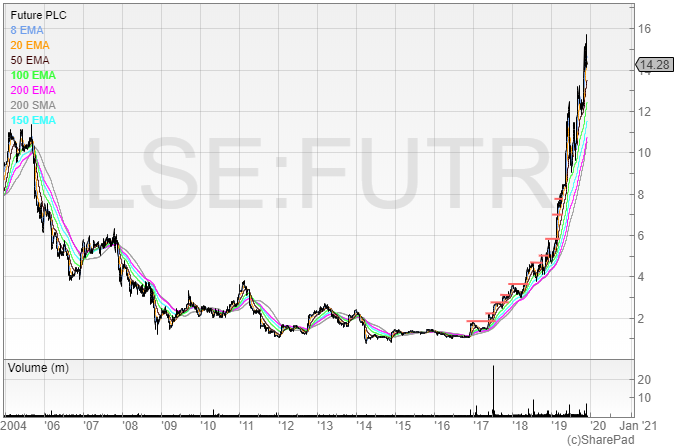
From early 2017 to early 2019 the price increased around 200%, but in 2019 alone the price has been sharply increasing – up around 700% from the 200p mark in early 2017.
Getting into a good stock early can pay off handsomely, and bowls are a useful tool for both traders and investors.
Michael Taylor
You can download Michael’s free books from his website on www.shiftingshares.com
Michael Taylor does not currently hold a position in any of the stocks mentioned above. None of the stocks mentioned in this article are recommendations to buy.
This article is for educational purposes only. It is not a recommendation to buy or sell shares or other investments. Do your own research before buying or selling any investment or seek professional financial advice.


