
Support and resistance are two common concepts when it comes to technical analysis. They are the most basic but also the most important points when plotting levels on a chart.
Technical analysis is a self-fulfilling prophecy as many traders and investors look at the same levels on charts, and therefore support becomes support because people already believe it to be a support level.
It would be very reductionist to say that trading is therefore easy and all we need to do is buy at support and sell at resistance, or sell at resistance and buy at support. But support and resistance can help us in decision making and to carve out realistic risk/reward ratio trades.
Keeping it simple
We looked at two indicators in my previous article and I am a big believer in keeping this as straight forward as possible. That’s not because I’m lazy, but because it is entirely possible to create a perfect system that works – in the past. If we torture data long enough then it will tell us exactly what we want to hear, but this doesn’t mean it is applicable for future use.
There are often two ends to the technical analysis spectrum; the academics who swear that the market is efficient and that it is impossible to gain an edge, and the staunch advocates of technical analysis who use ten different indicators and completely reject fundamental analysis. My own approach is in the middle – fundamental analysis can flag interesting companies or opportunities and the technical side is used to gain an entry and exposure to the stock. For example, I am currently shorting Sirius Minerals (see my previous article on shorting here), and it doesn’t take a genius to see that the balance sheet is a mess. From there onwards I used the chart to trade around my position.
Ultimately, we can distort data to make it say anything we want, but confusing extrapolating data and knowing the future are two different things. Those technical analysts who use all sorts of weird and wacky methods such as Elliot Wave Theory combined with Fibonacci and which side the moon is facing – if it works, keep doing it. But technical analysis does not tell the future. I like to use a handful of simple indicators which are helpful for me, and when I look at charts I am looking for key levels of support and resistance.
Support zones and not support levels
When one begins learning about technical analysis one of the first concepts that is commonly introduced is support and resistance. These are both levels on a chart where the stock finds support (market participants are willing to ‘support’ the price and buy the stock when it reaches a certain price) and resistance (the stock hits ‘resistance’ as market participants are selling the stock when it reaches a certain price’.
Support and resistance does exist, and they are obvious in charts. These levels and points are often at psychological numbers. Remember, a chart isn’t reflecting the true discounted future cash flows of the business – it is reflecting the entire market’s perception of the stock, and most of that market is human. Most of those humans haven’t done discounted future cash flow calculations either – I certainly don’t! This is the key difference between trading and investing, and why they are two separate disciplines. An investor looks at the business and decides what it is worth per share, and a trader looks at the price action on the chart and doesn’t much care for the underlying asset of the instrument they are trading.
The beauty of the small caps market in the UK is that it is relatively inefficient and therefore a stock picker’s market. Most of the volume is from private investors and retail traders, and so volatility can be huge, as well as stocks trading way below their intrinsic values. Using support and resistance is a great way to trade this volatility.
In theory, this is what the price should look like when it trades in a range and bounces off support, moves up to tag a resistance level, and drops back down to support.
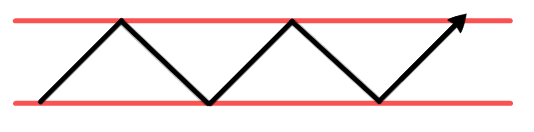
The problem with theory, is that it works in theory. But reality doesn’t.
The reality is very different, and this is the price action we can typically expect.
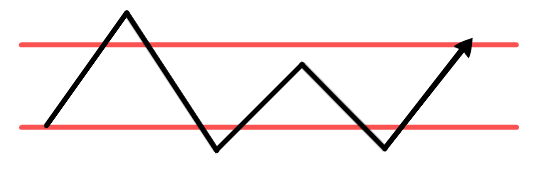
A stock may trade in a scruffy range but rarely does the stock ever bounce back and forth textbook style. This is because of several reasons – perhaps buyers who intend to buy at support pre-empt the support and jump on board the stock early. Or perhaps there are sellers looking to sell at resistance but decide to try and front-run others also targeting resistance as an exit price.
Very often, the price will drop below the support zone or above the resistance zone. This is because amateur traders will place their stop directly under the support level. For example, someone entering a stock at 50p on support may place their stop at 48p or 49p. There will be plenty of these stops clustered beneath the support line, and so price will go where the liquidity is. It is much better to place your entry beneath support in the support zone, rather than the support line. This gives the trade a much better chance of success and also minimises risk. This is because we are placing the trade at the closest point of where we would deem the trade to be wrong!
The same can occur with resistance levels. A stock that breaks out at 80p will see plenty of stop limit orders at 81p to go long as the price breaks out. The price can hit all of these stop limit orders and then revert back under the resistance level. If the stock fails to break out then we would call this a ‘fake-out’.
A good example of support can be seen in Bango, with the chart shown below:
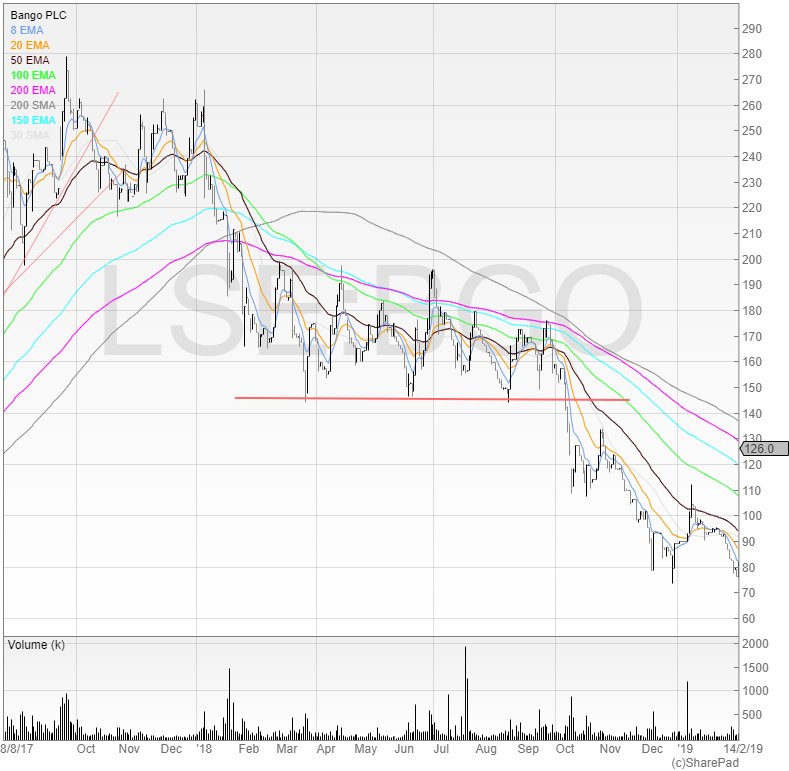
We can see that the stock bounced off around the 148-150p area. After the first bounce, one could’ve pencilled in an alert for a low risk/reward trade for when the price reached back down to support. After the second bounce, this confirmed the support and offered the same trade again for a third bounce. On the fourth time the price tested the support area, it broke right through. Both support and resistance become more significant each time that area is confirmed as support and resistance. Likewise, when that significant support or resistance breaks, it is seen as a key move.
This is important, because a stock that has been trading in a range between significant support and resistance and then moves out of that range means that a new trend may be in the process of being established. This was the subject of Nicolas Darvas’s book How I Made $2,000,000 in the Stock Market. The Hungarian dancer who travelled the world whilst trading stocks used boxes, later called ‘Darvas boxes’, that would capture these trading ranges and when a stock would break out of the box he would buy the stock. Darvas used a very simple breakout strategy of buying a stock when it broke out of a range and was able to rack up huge gains.
Here is an example of a stock that has broken out of resistance.
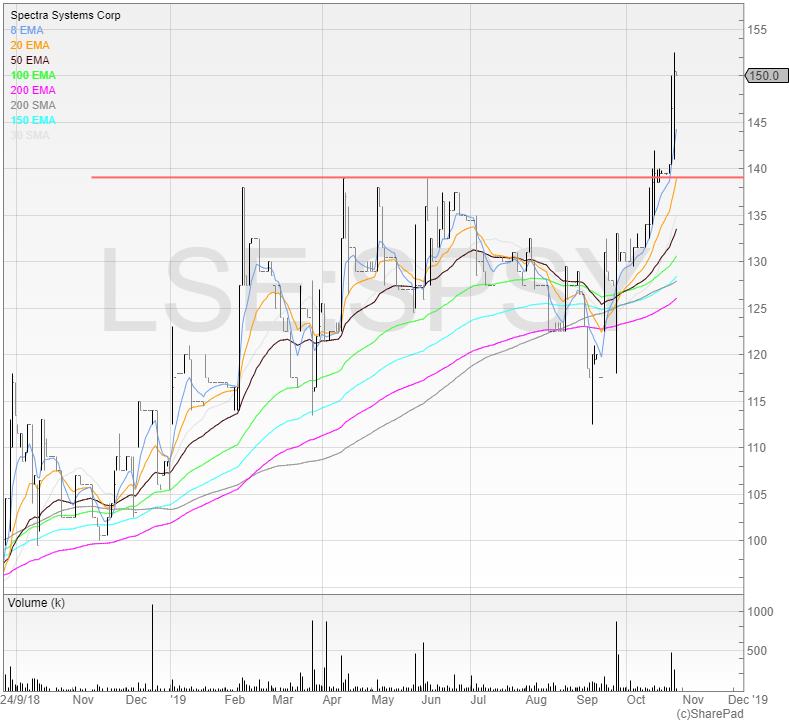
We can see that the stock tried the level at 138p zone not once, but five times before finally breaking through out of the range.
Support zones can be marked with a line on SharePad by clicking the ‘Draw’ option and the line drawing tool is the default choice when clicking Draw. There’s more on drawing in this tutorial video. SharePad then saves any lines drawn on the chart for future use – making this easy to flick through various charts and keep on top of potential trades and trends.
No stocks mentioned in this article are recommendations to buy. The author does not hold a position in any of the stocks mentioned, long or short. You can download Michael’s ebooks on the UK stock market at www.shiftingshares.com.
This article is for educational purposes only. It is not a recommendation to buy or sell shares or other investments. Do your own research before buying or selling any investment or seek professional financial advice.


