
Technical analysis is either loved or hated. Many people like to claim it as ‘voodoo’ and trying to predict the future, but the fact is that technical analysis is useful simply because everyone looks at the same charts and sees the same patterns. It becomes a self-fulfilling prophecy.
Those who do not bother to learn the basics of technical analysis will always be at a disadvantage to those who do, because technical analysis tells us what the market is really doing. It is a summary of the sentiment and the actions of those participating in the market over a specific period of time and can be used to gain an edge.
Technical analysis is the first point of call for me whether I’m looking at a trade or an investment, because if a stock has been trending downwards then it is clearly telling me that sellers are overwhelming the buyers and continually pushing the price lower. Until that trend changes it is likely we are going to be fighting an uphill battle.
Unless we wake up one morning and find ourselves to be a multi-million pound hedge fund that struggles with liquidity, then being able to quickly get in and out of stocks is our biggest advantage as private investors. We should not give up that advantage lightly and exploit it as much as possible.
That’s not to say that I ignore fundamental analysis. Often, the strongest moves come from stocks that have excellent underlying fundamental properties coupled with a powerful technical setup. However, one mantra that has always stuck by me is: the price is always right.
A stock can be an exceptionally high quality business, but when I check my P&L there is no column for “undervalued”. As a trader, if the price is going down – I’m losing money.
Charting packages
I have never understood people who say charting packages are too expensive – if it makes them money then it’s a positive return on investment. They decide the price is too high then go and blow £10,000 on a stock where they haven’t even checked the price action. It’s a classic bias not to consider either fundamental or technical analysis and instead just jump straight in – yet most people would not buy a house unless they’d done the necessary checks. That’s because stocks are sold, and houses are bought. What’s the difference? A stock always has a story. Stories are powerful – they lure us in against our better judgement. There’s never a story when it comes to a house.
The charting package that I use for day trading is ShareScope Pro, this is software that allows for pop out Level 2 windows and charts. It is adaptable and customisable for all trading screen setups, but most people do not need this. To do my charting after the market close I use SharePad. This is browser based and allows for filtering and quick searching through charts.
One huge benefit of SharePad is that we are able to set up a watchlist of stocks, and then click the space bar and quickly scroll through many stocks. It allows me to quickly see which stage a stock is in.
Four stages
As popularised by Stan Weinstein in his book “Secrets for Profiting in Bull and Bear Markets” (McGraw-Hill, 1988) there are only ever four stages of a stock, and they can repeat several times in a stock’s lifetime. Let’s look at two stocks that are well known, Games Workshop, which makes warhammer and model figurines, and FeverTree, which sells tonic water and mixers for alcoholic spirits. Maynard Paton has covered both of these extensively. He has also studied Imperial Brands which we’ll come to later.
Here are the charts for both Games Workshop and FeverTree.
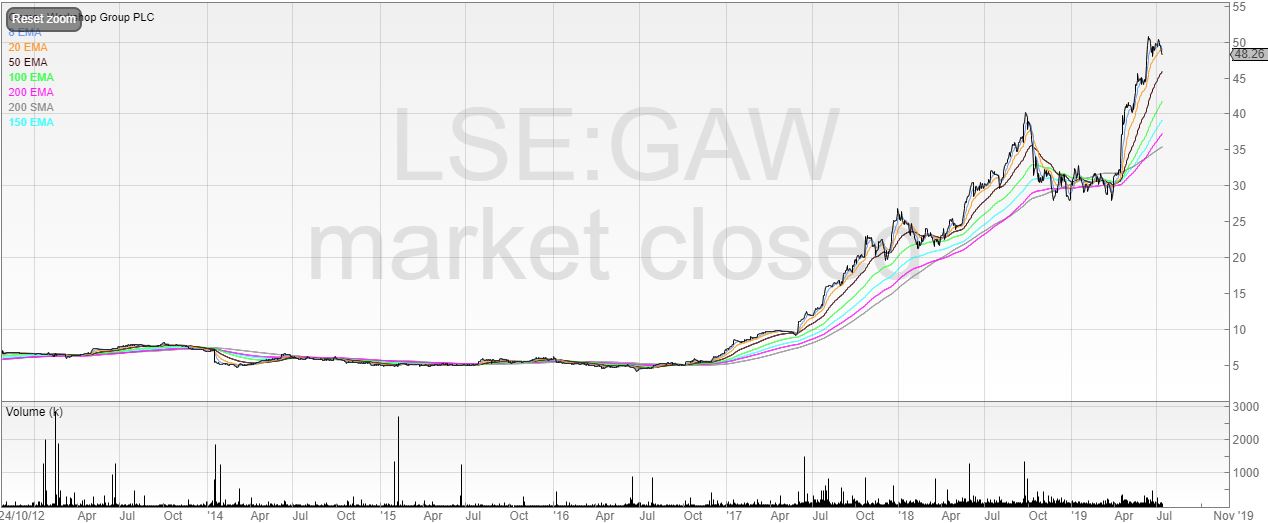
Games Workshop has been listed since 1994, but it is only until twenty years later in 2014 that we start to see a stratospheric rise.
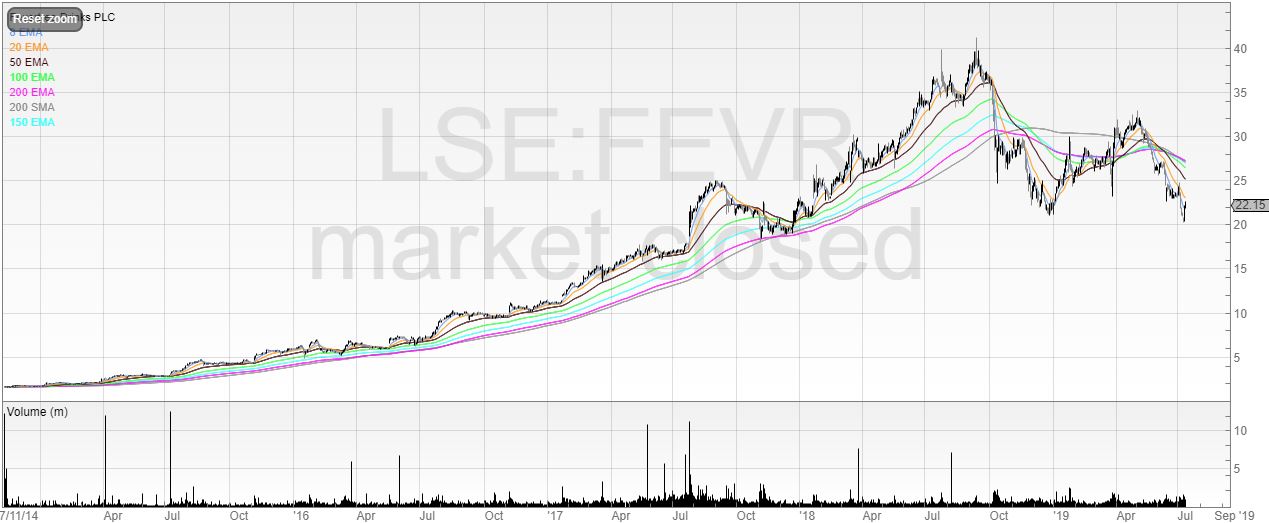
FeverTree was founded in 2004 by Tim Warillow, and listed on the stock exchange in 2014. Since then, it has consistently been one of the market’s best stocks to own.
We can see from both of these stocks that if we had bought at the right time, we could’ve made huge profits. To capture these monster moves we need to identify stocks coming out of stage one bases.
Stage one
Stage one is the accumulation zone. This is where we will see a flat base being formed, perhaps over weeks, months, and even years, where buyers are matching the sellers of the stock and holding it firm.
Here is an example of a stock that has built a stage one base over several months and is now backtesting the breakout.
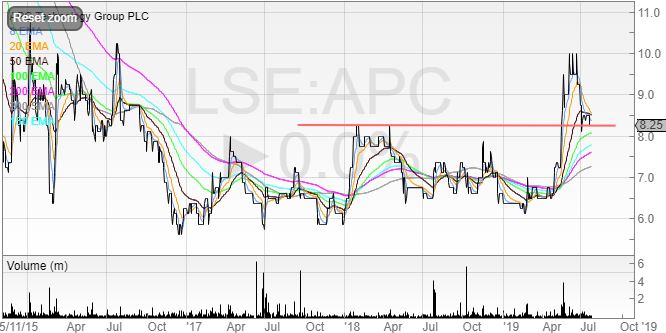
APC Technology, at the time of publishing, has been drifting sideways since the end of 2016. It’s been rangebound for several years now and with earnings on the rise and the turnaround bearing fruit, it’s a stock that could potentially break out into a stage two uptrend.
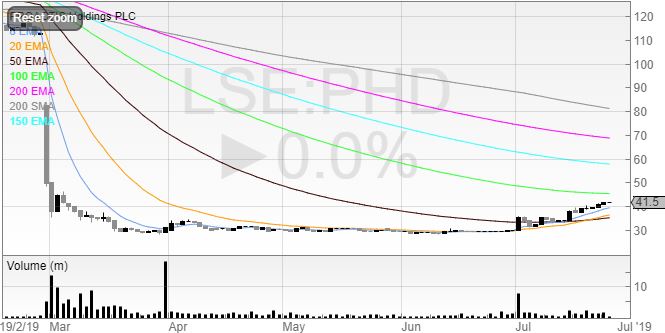
Another stock that made a strong move after a consolidated period of base building is Proactis Holdings. PHD had a profit warning and gapped down, dropping another 65% from its opening price.
In April, I noticed both the volume and volatility coming down. This is important because low volume means low sellers and low volatility means the stock is finding its equilibrium point. Once a stock breaks out of a range then we can see sustained moves, and the longer the range the more significant the volatility expansion becomes. This is what Bollinger Bands measure – extended periods of low volume and low volatility give tight bands. I don’t use these because the chart already tells me what I want to see.
I stalked this stock knowing that once the stock broke out there was a low risk and high reward trading opportunity. It did – and the call on my Twitter was here at a breakout of the 31.5p range.
Will Proactis become a stage two stock? I don’t know. I can’t predict the future, and very often those who say they can are selling something (I don’t know any economist retired on a Caribbean island). All I know is that if I take trades where the odds are in my favour and repeat these over a sustained period of time then I am likely to generate alpha.
I have found a simple volume filter that helps me to spot signs of accumulation. Stocks that suddenly see bigger volumes than usual can be buyers taking stock and supporting the share price.
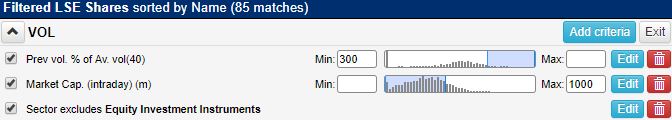
(You can run this screen for yourself by selecting the “Michael Taylor 26/07/19: VOL” filter within SharePad’s Filter Library. Simply go to: Filter -> Apply filter -> Library)
What I have done here is create a yardstick of the average volume over the past 40 periods (trading days) and then decided I want the filter to show all stocks that are 300% above that average volume of the last 40 trading days.
I’ve also added a market cap filter too because I tended not to trade stocks much bigger than £1 billion market cap, though I recently revised this to £2 billion as I would’ve missed out on a few extra opportunities.
Equity Investment Instruments has also been excluded because these listed instruments tend not too move so much, and there are an awful lot of them listed!
The beauty of this filter is that it now shows stocks with significant volume change. It does yield anything from 80-120 results per day, and of course the lower the percentage threshold used (300% in my instance) the more results we would receive. I want to keep it reasonable as I also cover my high filters after the market has closed too, and study my watchlist.
Sometimes this filter will bring up a false positive, where volume is through the roof but it was a matching bed and ISA trade. Other times it will show stocks on their way to a breakout or accumulation.
Games Workshop was clearly in a stage one base from the start of 2014 right up until the beginning of 2017.
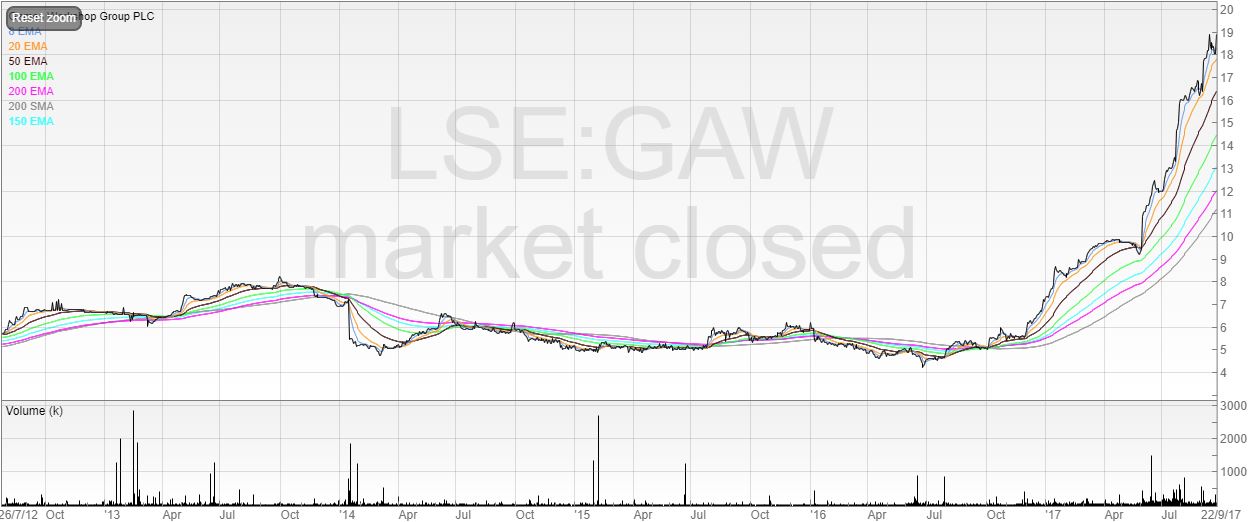
There was some volatility throughout the years, but importantly the stock failed to make a convincing breakout.
FeverTree did not make such a long base, showing strength straight from its IPO.
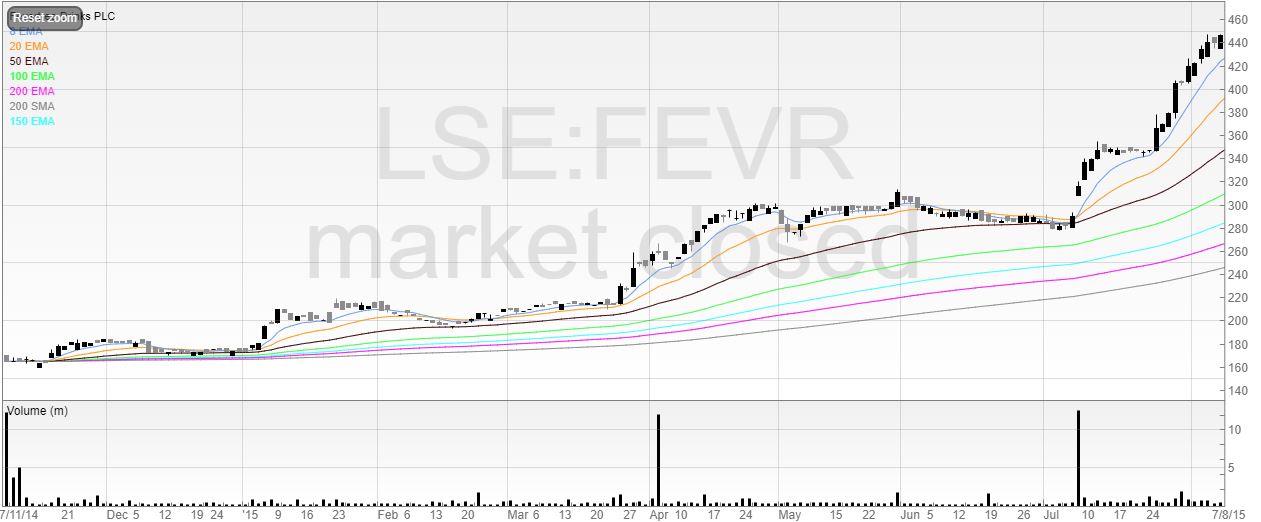
However, we can see clearly that neither buyers nor sellers had any advantage over the other as the stock traded low volumes and remained relatively stable.
Not all stage one bases look the same, but they are typically characterised by periods of low volume and price stability. We are generally looking for a flat line on the chart for an extended period of time that shows stability in price action.
Stage two
Stage two is when buyers of the stock are now gaining momentum and usually means sellers are gradually becoming sparse. Sometimes, supply can even increase, but if buyers are overpowering the sellers the price will move north. The overall trend in stage two is upwards.
To identify a stage two stock, we should be looking for a breakout of a trading range accompanied with noticeably large volume. A breakout is where the price breaks through the previous resistance, and is no longer contained by the range.
I use two custom filters with SharePad in order to hunt these stocks down.
Firstly, I use my all-time high filter. I use the 1st January 1990 as the benchmark and have raised my range from £500,000 to £2 billion market cap.
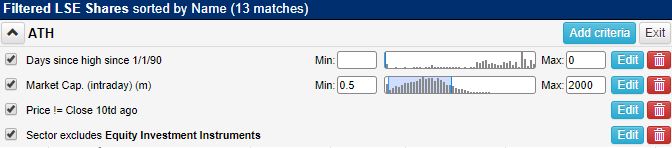
(You can run this screen for yourself by selecting the “Michael Taylor 26/07/19: ATH” filter within SharePad’s Filter Library. Simply go to: Filter -> Apply filter -> Library)
The third criterion is important. What I have created here is a filter that removes all results that were the same price as they were ten trading days ago. This is because there are a lot of funds and illiquid stocks that may be sat on an all-time high and I see the same results night after night. Some of them might not move for weeks – even months!
I’ve also excluded equity investment instruments again for the same reason as on my volume filter.
The reason why all-time highs are so powerful is because once a stock breaks through into blue sky territory, then it means every single person on the shareholder register is in profit. There is nobody waiting to unload into a rally as a trapped buyer, and supply is limited.
In the previous chart from Games Workshop above, we can see from 2017 the price was starting to rise. However, it was not until June that the stock confirmed a stage two breakout.
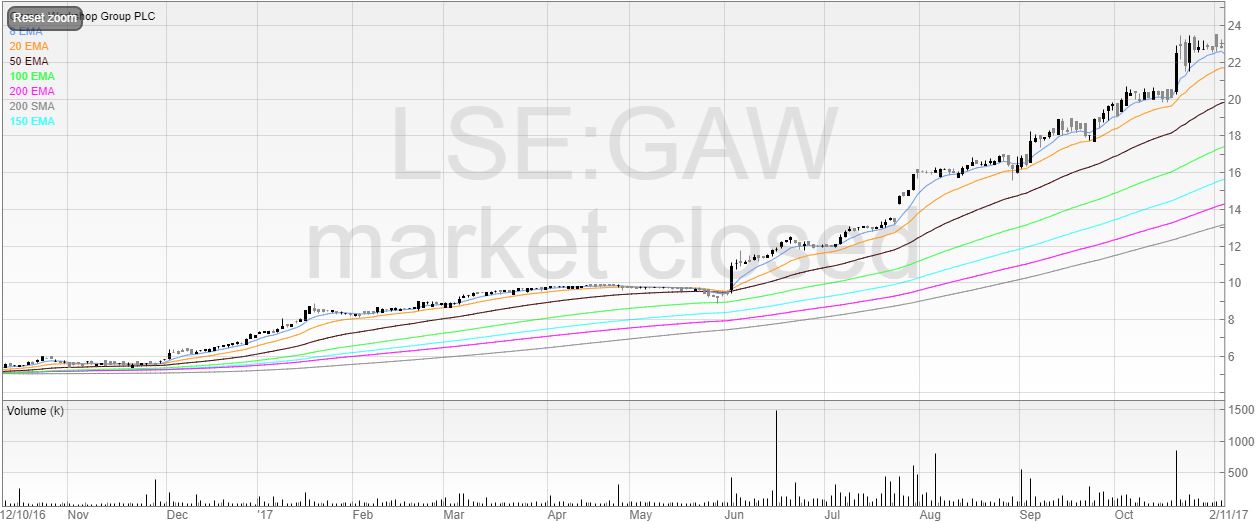
In June 2017 the stock broke out on large volume, and continued to rise on large volumes. It had broken well clear of all stage one price action and was now motoring upwards. We want to own stage two stocks because they are uptrending. This may sound an obvious thing to say, yet it is the downtrending stocks that receive the most private investor attention.
From this breakout, Games Workshop advanced from 1000p to a peak of 4000p in September 2018 – a return of 300% in just under fifteen months. Anybody could’ve spotted this stock, and many people did. It wasn’t a story stock that nobody knew about and if they found oil they would’ve been the next ExxonMobil; it was a growing and profitable business that is on many high streets throughout the UK. It would’ve shown up in a simple 52 week high filter* time and time again (the beauty of stocks that make new highs is that they often continue to make new highs).
The 52 week high filter is possibly more important than the all-time high filter. SharePad have their own “1 year highs” filter in their Filter Library, though again I use my custom made one.
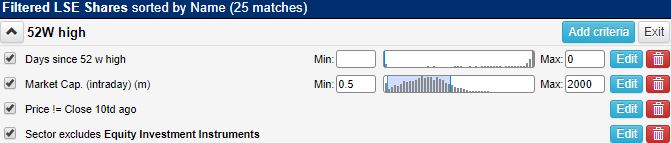
(You can run this screen for yourself by selecting the “Michael Taylor 26/07/19: 52W high” filter within SharePad’s Filter Library. Simply go to: Filter -> Apply filter -> Library)
FeverTree is no different in the sense that many readers will be regular drinkers of this tonic water when they order a G&T. You may even have noticed it popping up in your local bars and an increasingly growing presence in supermarkets and shops. But did you ever think to check up on the stock? Great ideas are around us in everyday life; we just need to keep our eyes and ears open.
When FeverTree broke out of its stage one base in April 2015, it went on a monster rally from around 300p to 1000p in August 2016.
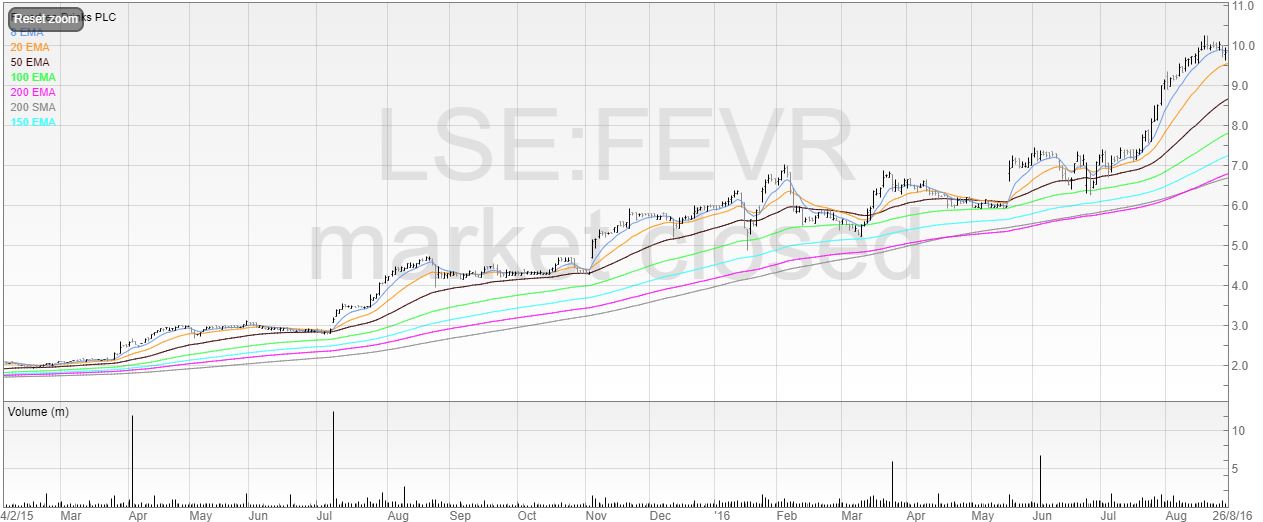
But it didn’t stop there. Many investors would’ve been taking profits here after such a fantastic rally (and who can blame them – 400% is 399% better than what we would get in the bank) but stage two was not finished yet.
FeverTree kept going over the next few years to 4000p.
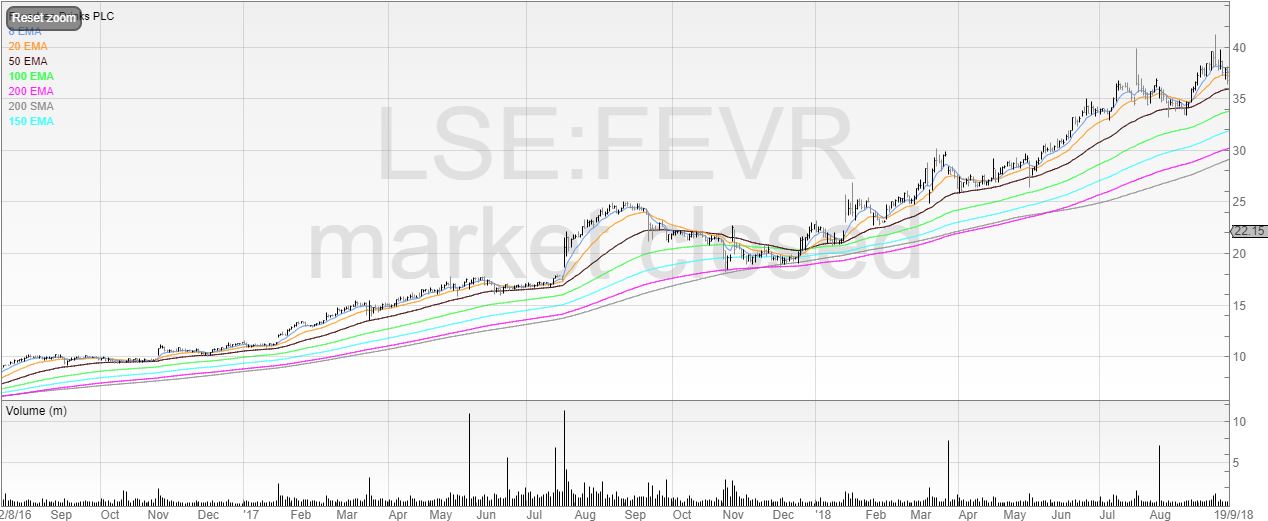
We didn’t need to catch the entire move to make money on FeverTree. The stock offered plenty of opportunities to get on board during its stage two phase. Remember, we want to be trading and investing in stage two stocks because they are uptrending and this trend is what we are looking for in charts.
Here is an example of a stage two stock that is clearly uptrending: Arcontech.

The key to spotting uptrends is to look for rising share prices, with all of the moving averages pointing upwards and rising. At today’s current market cap of £22 million, it could still have plenty of upside, despite the 700% rise from the lows. This is the beauty of stage two uptrends.
Stage three
The penultimate stage is in action when a stock continuously trades sideways for an extended period of time, and this is because buyers cannot beat the supply that is now coming into the market. This could be because plenty of early stage one and two buyers are now taking their profits, and new investors are reluctant to come into the stock.
Stage three can also see large troughs in the stock price as volatility starts to increase. Drawdowns of 20% from the high in the stock can occur and when this happens we should be careful as a 25% drawdown requires a gain of 33% in order to get back to where we were. A drawdown of 33% requires 50%! We want to own uptrending stocks and stage three is typically the stage that we should be exiting and definitely not entering.
Both Games Workshop and FeverTree had pullbacks. One could be considered to be a stage three stock. Let’s take a look.
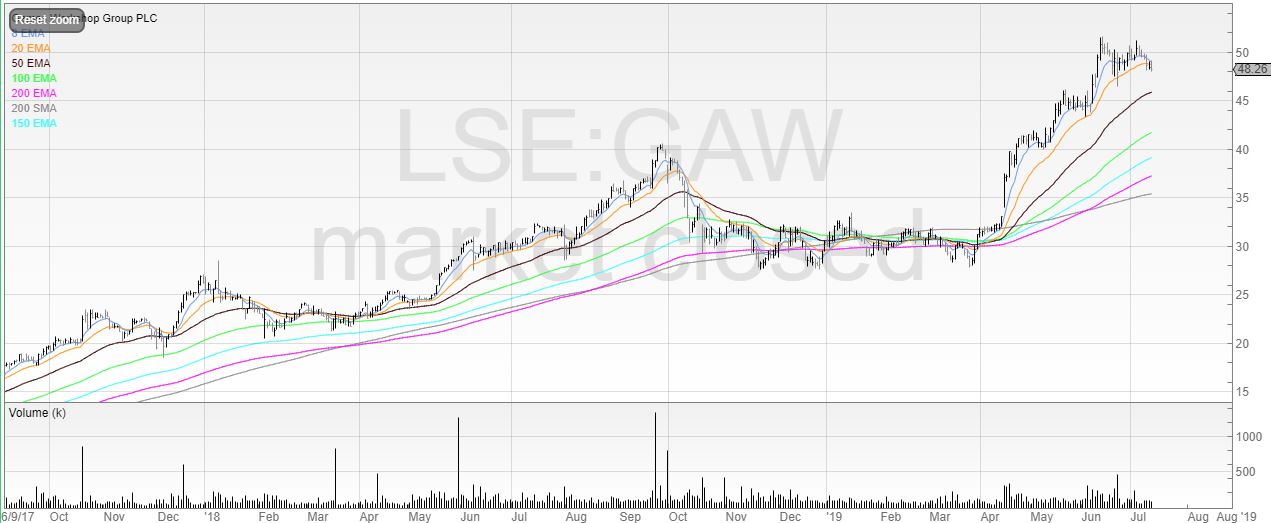
Games Workshop did pull back from the 4000s to the high 2000s, and it looked like it could’ve become a stage three stock. However, it based, then surged upwards on good volume to break out again from the point of resistance at 4000p. This yielded a gain as the stock hit highs of 5000p.
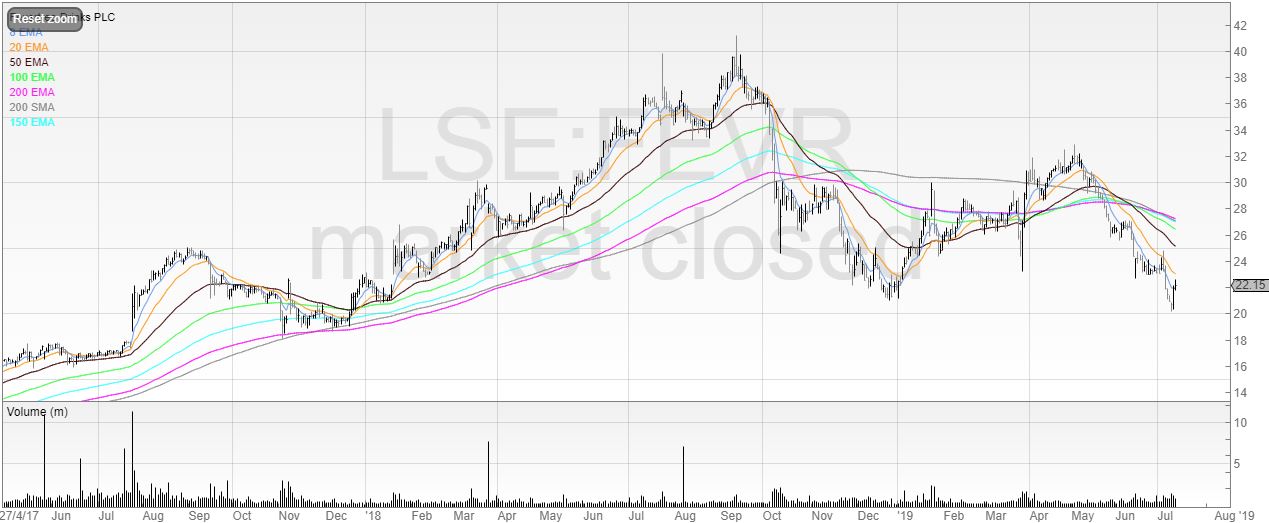
At the time of publishing, FeverTree is well off its highs of 4000p, nearly hitting 2000p, which is a drawdown of nearly 50%. The stock required a near 100% move from that point just to get back to where it was – that is a lot of supply to churn through as those who wished they’d sold much higher dump into any rallies.
One of the difficulties of identifying stage three stocks is that we only know that it was a stage three base and not a stage two base in a continued uptrend with the benefit of hindsight!
Here is a stock that could either be a stage two base or putting in a stage three base – we have to wait for the stock to make its next move before it becomes clear.
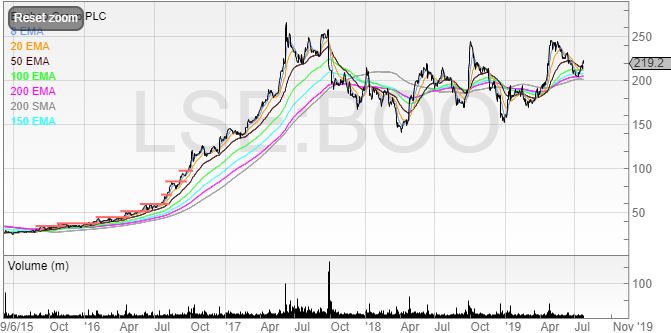
Stage three stocks can be identified by expanding volatility and volume. In October 2017, this happened at Boohoo.
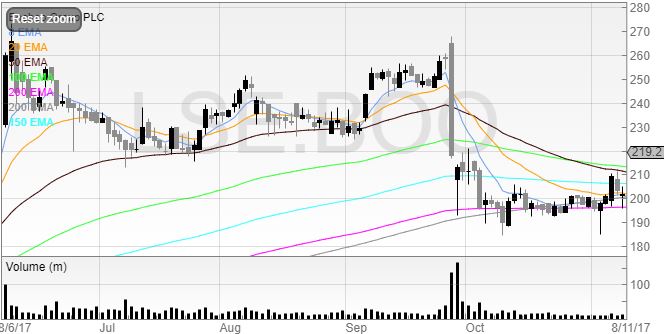
Nearly two years later, the stock has failed to make a new high. It may be an exceptionally long base build and break out at the last all-time high, or it may fail to ever reach those highs again and begin a stage four decline.
A more recent example is Future Group. FUTR has been popular with investors (and myself) for good reason – it’s a beautiful uptrending stock. Or it was until recently.
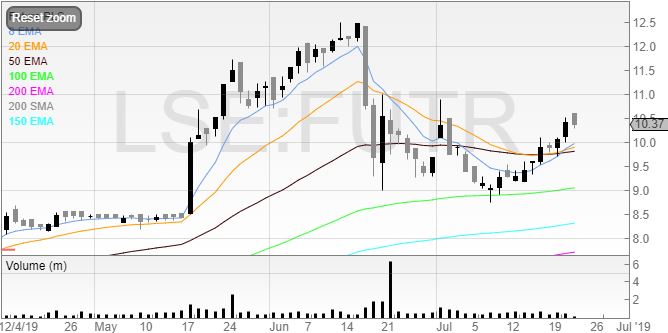
This was the biggest down candle in several years – the price action was signifying something had changed. Of course, Future may recover here, shake it off, and break out of that 1250p high, but the volatility may also be a signal that the trend may be changing.
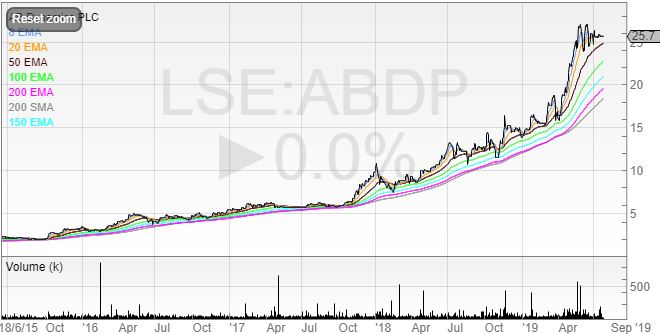
ABDP has been a great trend for its shareholders, breaking out around 250p in October 2015. It’s now currently 2570p after continuously building bases and breakout out of them. This is another example of a stock where if it breaks down then it’s a stage three, and if it breaks out then it’s a stage two! Instead of predicting, it’s much easier to react. Trade breakouts long; trade breakdowns short.
Stage four
Stage four is a downtrend. This is when there are more sellers than buyers and this depresses the price. Stage four downtrends can last for years, and they can even be terminal. Ultimately, the lowest price a stock can go to is 0p – and many stocks have gone to the wall and gone bust. Unless we develop a fetish for losing money, we should not be buying stage four stocks because the price is going down.
It’s easy to search for stage four stocks – we simply flip the all-time high and 52 week high filters on their heads. We search for all-time low and 52 week low filters using the same criteria only for lows.
Debenhams began a stage four downtrend a few years ago.
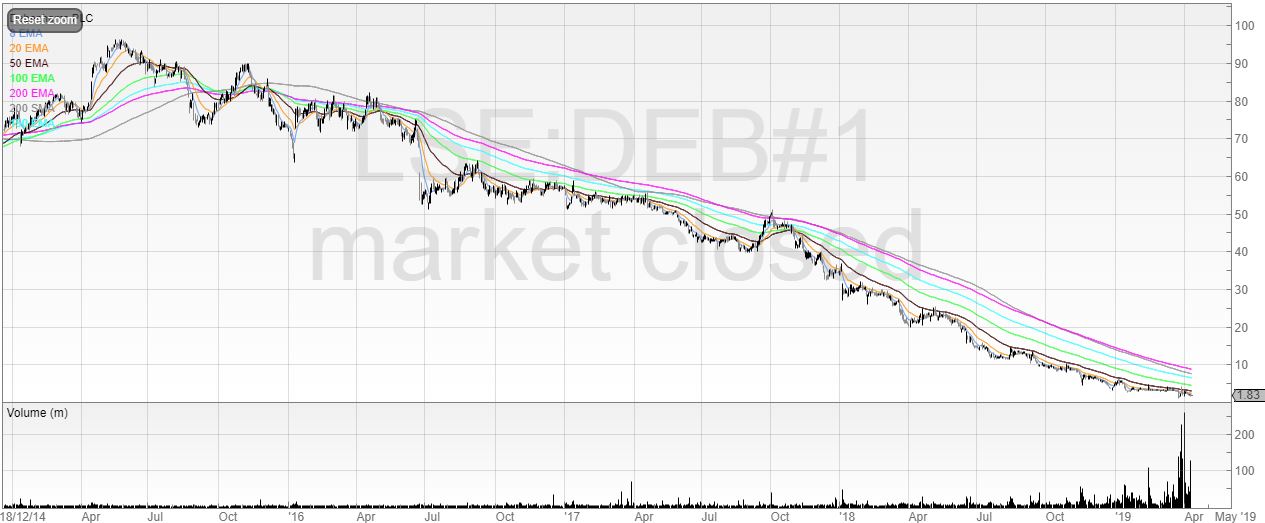
No doubt people thought it was cheap at 40p, 30p, 20p, and 10p. Shareholders lost all of their money when it went to 0p – it doesn’t matter what price or how cheap they bought.
If you’re holding a stage four downtrend then you’re asking for trouble. You are gambling that you are buying the bottom, and there is likely a reason why that stock is going down.
IQE is a stock that had done the stage two uptrend and appears to have skipped stage three completely, promptly dumping relentlessly.
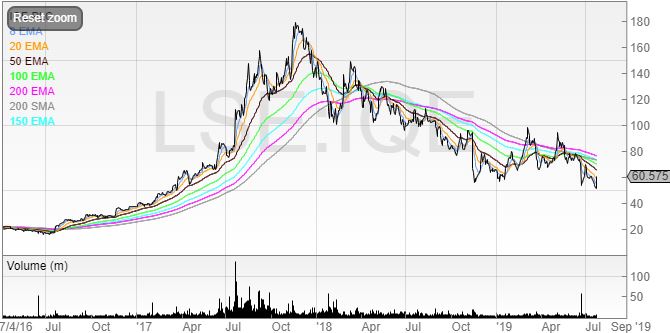
We can see that since the high of 180p we’re now seeing the stock printing 60p – not far off from a 70% drawdown. This is why running losers never works.
It’s usually the junior mining and resources companies that are the classic stage four downtrends. They promise a lot on story but fail to deliver value. But the directors still need paying, so they spin the story, sell some shares, and dilute holders even more. You don’t need to be mining analyst to see that the stock is junk equity – just check the chart.
Here is an excellent example: Ascent Resources.
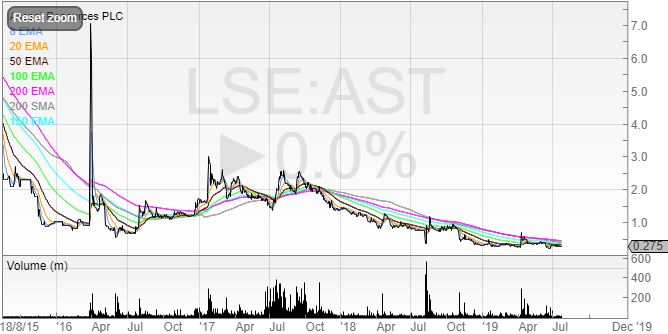
Colin Hutchinson became CEO of Ascent in September 2015 – this chart covers his tenure so far. After countless equity raises and the shares down 80%+ since his appointment, shareholders have been diluted into oblivion.
Yet in 2017 Colin earned £216,221 in remuneration (excluding £65,445 of share based payment expenses), a pay rise of £62,465 from £154,516. For 2018 he received £159,804, but helped himself to a share based payment of a whopping £199,543.
You can find all of this information in the Annual Report under Director Remuneration. But the chart of Ascent Resources tells you everything you need to know.
Imperial Brands
Private Investor Maynard Paton has been running the rule over Imperial Brands in his column Screening For My Next Long Term Winner here. He makes the point that IMB has a history of increasing its dividend and sees the long term consistent EBIT and turnover rates.
At Christmas time last year, I also considered buying IMB in a longer term account for the near 10% dividend yield. However, I then loaded up the chart.
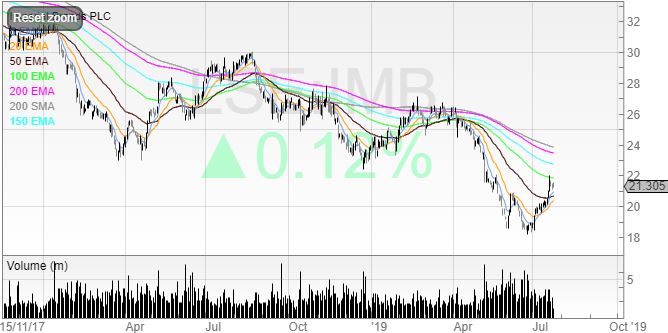
It was clear to me that IMB was in a stage four downtrend and so I passed on this opportunity. Since then, the price fell a further 20%. Maynard has superior fundamental analysis to myself and has decided against purchasing IMB stock. The chart tells me that is likely the right decision.
It’s also important to acknowledge that Maynard’s methods and those of myself are very different. We have different strategies and neither is the right method. I very rarely average a losing trade, yet I know successful private investors who regularly average down and have done very well for themselves. If something is working for you – don’t stop.
Conclusion
There is a lot more to technical analysis than just stages, but this quick and effective method of identifying a stock’s stage can help us not to lose money. Very often, it’s the story stocks that get people excited that are stage four stocks – these companies are big on narrative but fall short on delivery. They create more shares through dilution instead of creating value. There is nothing wrong with trading these companies if we have an edge, but holding stage four stocks has historically been a losing strategy. It’s much better to wait for that stage one base to form and for the stage two breakout to occur. If the company does what it says it’s going to do, and does deliver the huge shareholder returns that the directors have been speaking about, then there is plenty of time to make money on the stock if and when it actually delivers. Both Games Workshop and FeverTree are testaments to that.
Michael Taylor
Disclosure: Michael holds long positions in APC, ARC, and PHD. These are swing trades and not picked on the basis of quality – if the price drops a certain extent he will sell.
This article is for educational purposes only. It is not a recommendation to buy or sell shares or other investments. Do your own research before buying or selling any investment or seek professional financial advice.


