
Quality companies undergoing temporary problems can often become attractive investment opportunities.
On that basis, perhaps AG Barr is worth closer inspection.
The soft-drinks manufacturer famous for Irn-Bru recently warned that profits would be lower than expected… and the share price plunged accordingly:
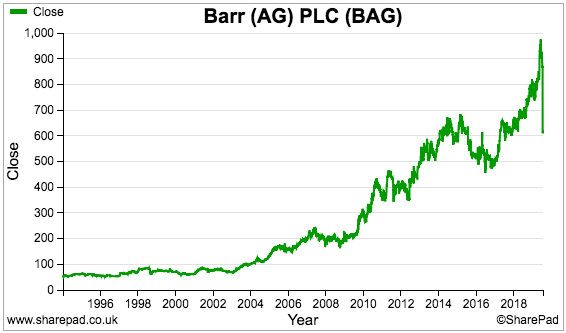
However, AG Barr does boast a quality track record. During the last 40 years for example, the group has lifted its annual dividend by an average 11% — and shareholders have never seen their income cut.
Let’s employ SharePad to learn more about the company.
Filter criteria
AG Barr was one of 17 shares that featured on this SharePad screen back in April. At the time I was screening for directors who:
* had not diluted investors by issuing shares willy-nilly;
* had created dependable returns through a rising dividend, and;
* owned a lot of shares themselves.
My theory was that these bosses should deliver better profits than ‘salarymen’ executives who care more about their wages, options and bonuses.
The exact filter criteria I used were:
1) A share count equal to or less than the share count of 10 years ago;
2) A 10-year compound dividend growth rate of at least 7%, and;
3) A minimum director shareholding of 5%.
I chose Renishaw in April, and re-running the screen now still returns AG Barr:
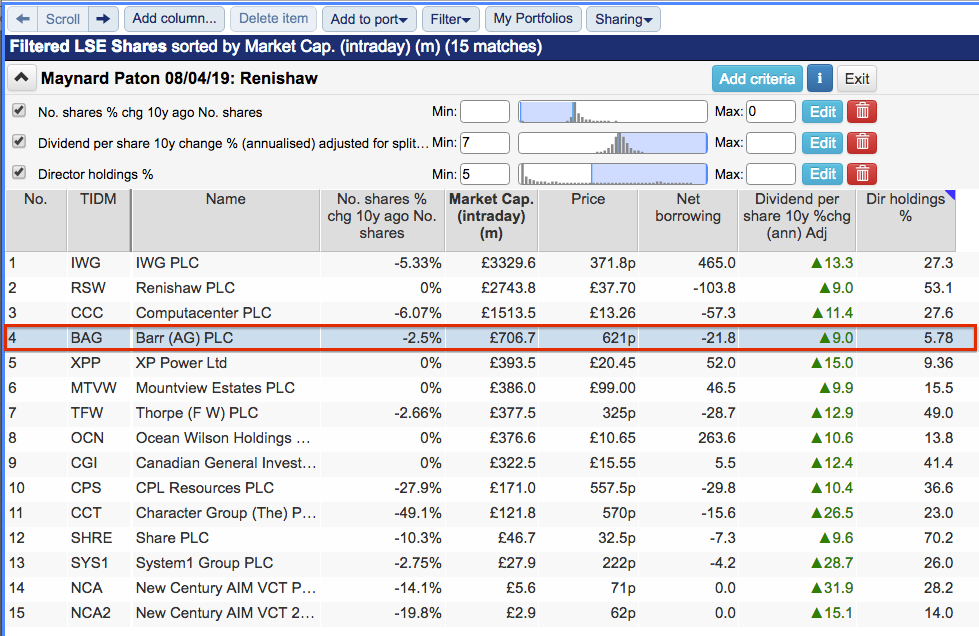
(You can run this screen for yourself by selecting the “Maynard Paton 08/04/19: Renishaw” filter within SharePad’s fantastic Filter Library. My instructions show you how.)
Let’s check AG Barr’s share count:

The number of shares was unchanged for years and has recently declined following a share buyback.
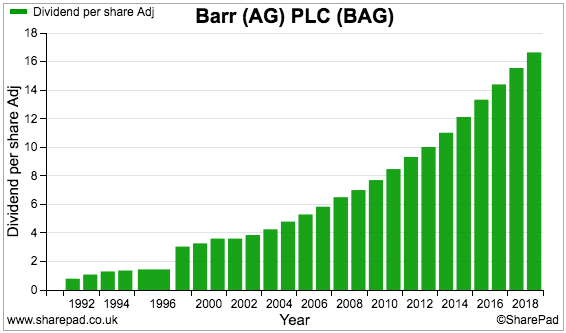
The dividend chart shows a very welcome upward trend:
A director also owns 5.3% of the group (recent value: £37 million):
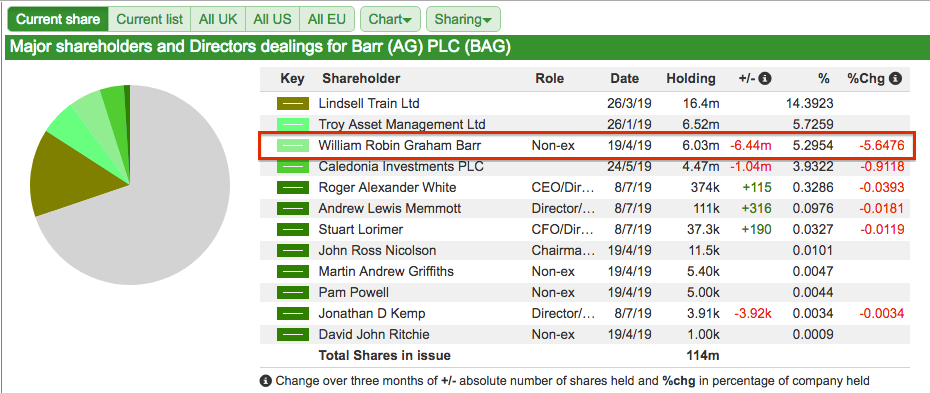
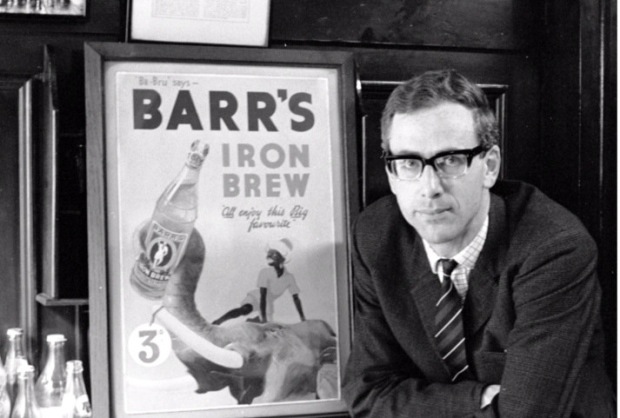
The director in question is Robin Barr, a non-executive and former executive chairman.
Mr Barr held the top job between 1978 and 2009, and AG Barr’s illustrious dividend record and Mr Barr’s sizeable shareholding are probably not a coincidence.
Prior to Mr Barr’s appointment as chairman, his grandfather, uncle and father had run the business.
The history of AG Barr
AG Barr’s history extends back to 1887, when Robert Barr began selling ‘aerated waters’ in Glasgow. Five years later, Mr Barr handed the business to his brother Andrew — who promptly renamed the company after himself.
Andrew Barr — Robin Barr’s great uncle — then launched ‘IRON BREW’ in 1901. Savvy marketing that involved testimonials from sporting heroes ensured the orange fizzy drink quickly became a best-seller in Scotland.
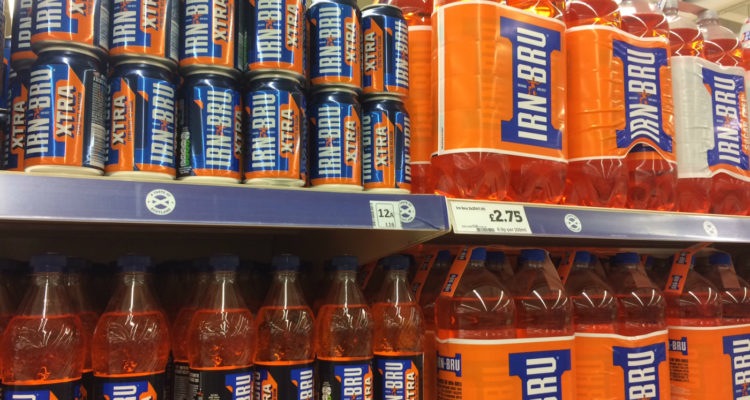
Renamed in 1946, Irn-Bru remains the most popular soft drink in Scotland and is apparently the third most popular — after Coke and Pepsi — in the UK.
Today AG Barr sells a broad range of soft drinks that include fruit juices, bottled waters, energy drinks and cocktail mixers, all of which support a 3% UK market share.
Irn-Bru and other carbonated drinks represent 74% of company sales, with juices and waters representing 18% and other beverages representing 6%. AG Barr’s business is derived almost entirely within the UK, with exports representing only 4% of revenue.
Revenue and operating profit have increased over time, although progress has not been as consistent as the dividend:
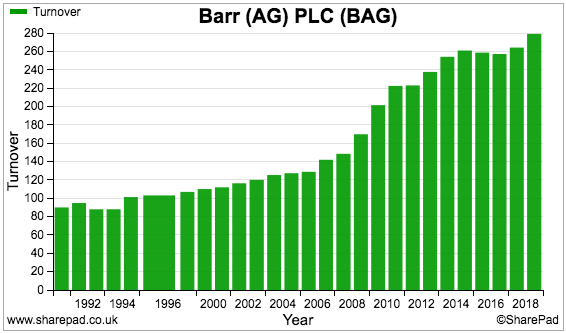
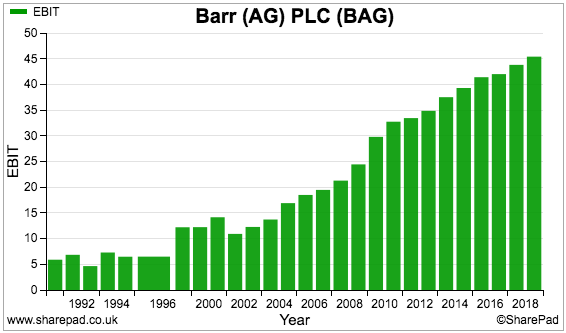
The company’s last setback occurred during 2002, when profit fell more than 20% following “competitive pressures” among supermarkets and the knock-on effect on suppliers.
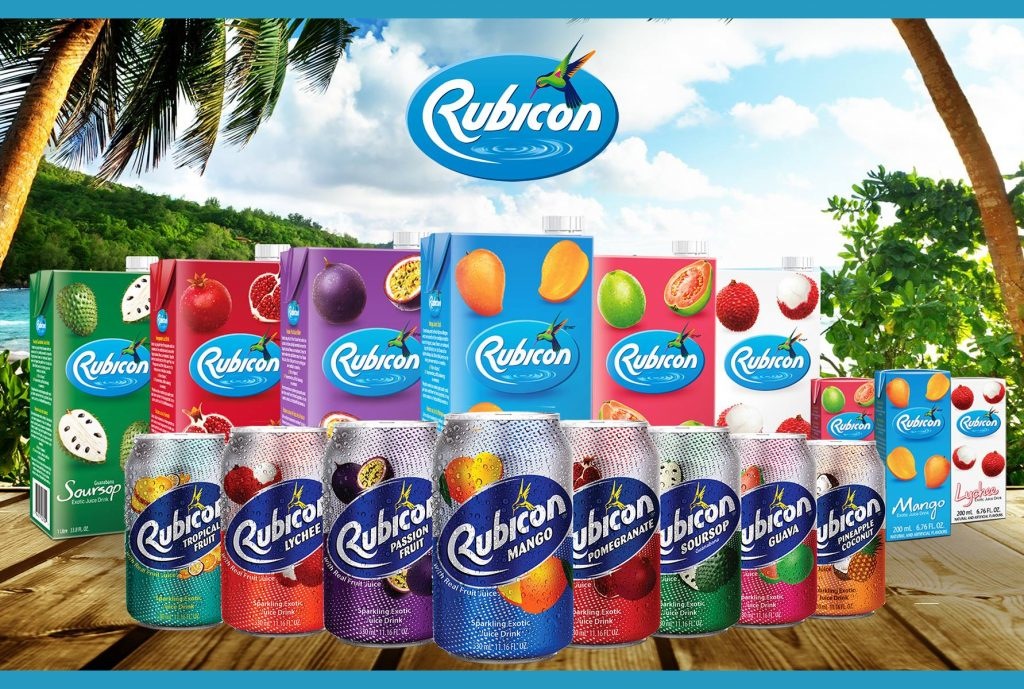
Since then, a trio of notable acquisitions — £16 million for Strathmore (bottled waters, 2006), £61m for Rubicon (fruit drinks, 2008) and £22m for Funkin (cocktail mixers, 2015) — have bolstered AG Barr’s results.
These acquisitions widened AG Barr’s product range and lowered the group’s dependence on carbonated drinks — the health concerns of which led to the introduction last year of an industry sugar levy.
(You may not know that changing consumer tastes led to bottled water surpassing cola as the UK’s largest soft-drinks category by volume during 2014)
I should add that the earlier SharePad charts perhaps do not do justice to AG Barr’s financial history.
The business floated during 1965 and Companies House has annual reports going back to 1980:
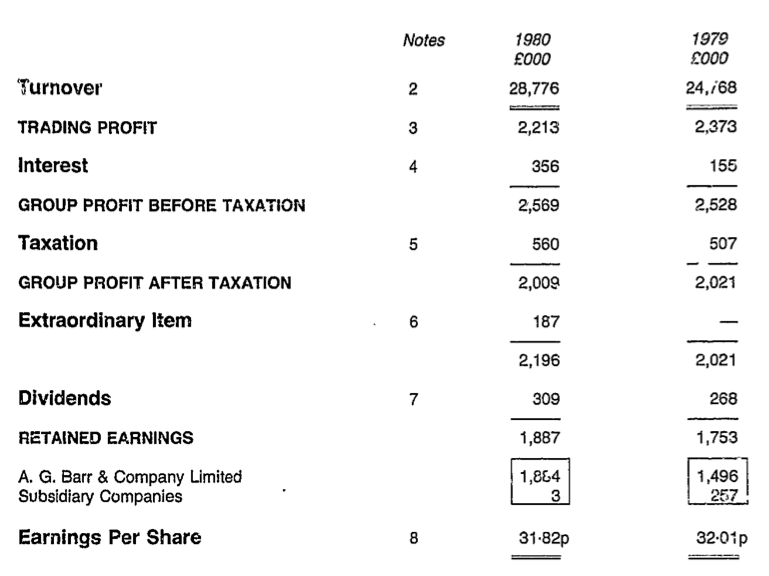
40 years ago, revenue was £25m, profit was £2m and the dividend was 0.24p per share. Revenue and profit have since grown at an approximate 7% per annum average, while the dividend per share has compounded at an 11% average.
However, growth during the last few years has been more modest. Between 2014 and 2019, sales, profit and the dividend expanded at average rates of 2%, 4% and 9% respectively.
AG Barr’s SharePad Summary
AG Barr’s SharePad Summary is shown below:
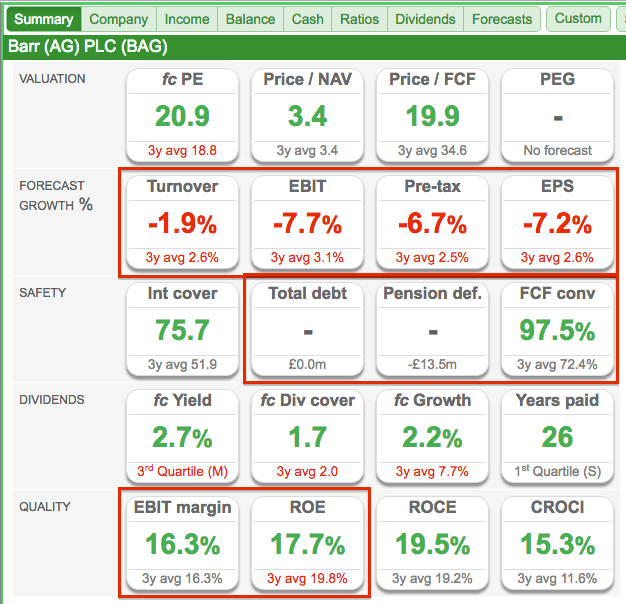
A few observations:
1) Revenue, profit and earnings per share are all expected to decline (second row);
2) There is no debt but there is a pension deficit (third row);
3) Earnings convert well into free cash (third row), and;
4) The operating margin and return on equity (ROE) appear worthwhile but not spectacular (fifth row).
Let’s start with the forecasts.
Forecasts
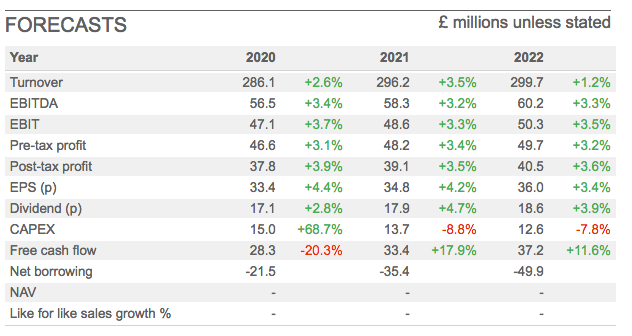
Prior to the profit warning, City brokers were predicting pedestrian improvements to sales, earnings and the dividend for the next few years:
The profit warning then said:
“As previously communicated, 2018 was an unprecedented year for soft drinks with changing pricing and promotional dynamics in the market following the introduction of the Soft Drinks Industry Levy (SDIL) alongside CO2 shortages and a long, hot summer.
Against this backdrop we placed an intentional short-term trading focus on volume which successfully boosted growth and, as updated in March, we have subsequently returned our Barr Soft Drinks business to its long-term value driven approach, increasing price positioning in the market.
While we anticipated that volume would be impacted by this return to our traditional pricing strategy, trading in the financial year to date has been below our expectations.”
Last year AG Barr cut the prices of its lemonades, ginger beers and other mainstream fizzy drinks… but customers have since been reluctant to buy after prices were lifted back to where they were.
Throw in some “specific brand challenges” and “disappointing” weather, too, and AG Barr reckons first-half revenue will now fall 10% to £123 million and the full-year “profit performance” could decline by up to 20%.
I must admit, profits falling by up to 20% does seem very surprising for a business that has churned out consistent(if modest) earnings improvements for the last 15 years.
No wonder the shares dived 28% after the news.
The revised forecasts appear odd to me.
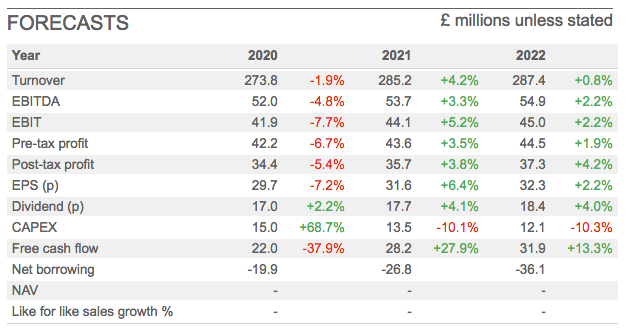
AG Barr has admitted current-year profit could fall by up to 20%, and yet the forecasts show only a 7% drop.
I suspect some brokers have been slow to update their predictions — which has left SharePad’s consensus numbers as an average of both pre-warning and post-warning projections.
Free cash flow, debt and pensions
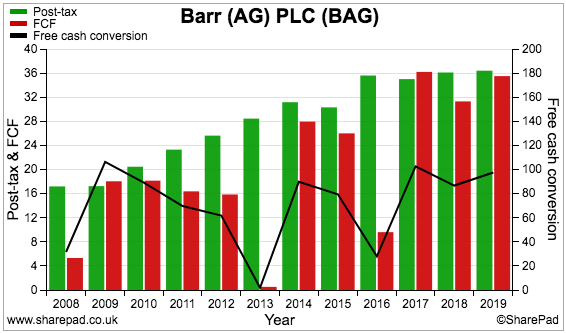
AG Barr’s Summary shows a super 98% conversion of earnings into free cash.
However, the black line (right axis) on the chart below reveals earnings have not always converted at such a high rate:
Free cash conversion is often held back by:
1) Significant sums absorbed into additional working capital, and;
2) Expenditure on tangible and intangible assets substantially exceeding the associated depreciation and amortisation charged against profits.
The following chart compares AG Barr’s earnings to the additional working-capital cash and ‘excess’ capital expenditure:
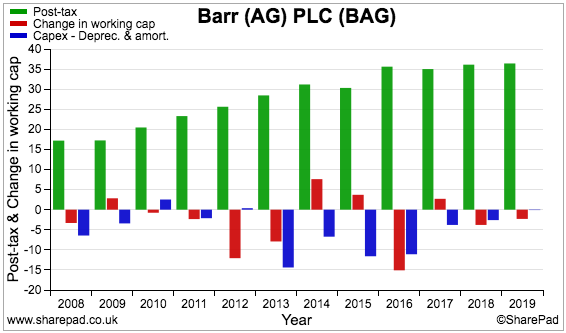
Due to AG Barr’s accounting, SharePad’s working-capital calculation (red bars above) includes ‘catch up’ contributions paid into the pension scheme:
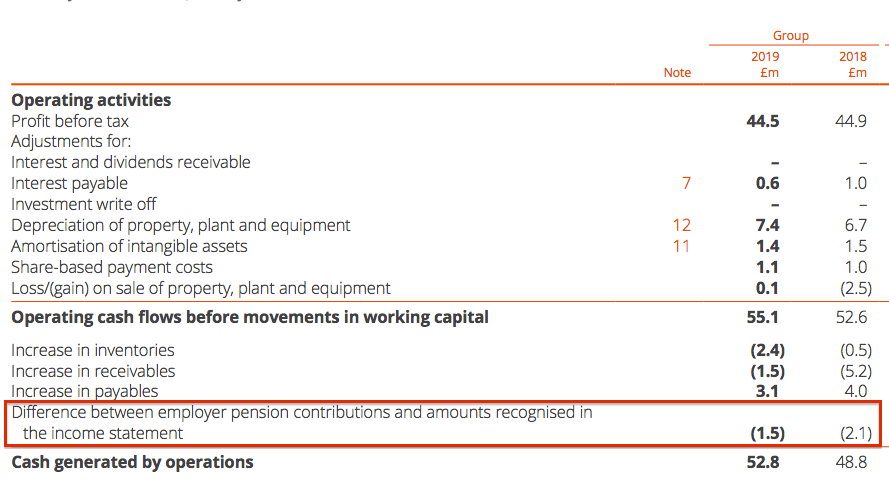
Such contributions have totalled £26m during the last ten years — none of which has been charged against reported earnings. AG Barr’s profits have therefore been flattered (I estimate by 6%) by the accounting rules concerning these pension payments.
AG Barr’s actual working-capital requirements have been relatively steady compared to revenue:
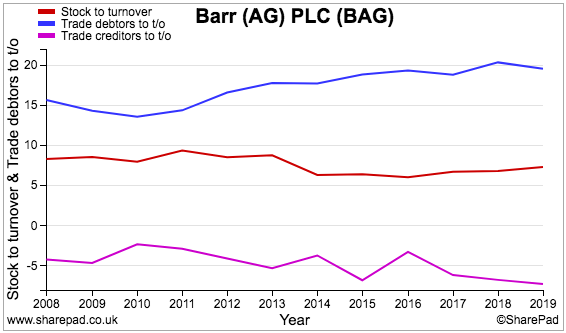
I would note that trade debtors as a proportion of revenue have increased from 15% to 20% during the last decade. Perhaps some of AG Barr’s supermarket customers are paying their bills later than they once did.
Regarding capital expenditure, old annual reports indicate the ‘excess’ capex was spent mostly on i) freehold land and buildings to accommodate new production facilities, and; ii) a new software system (now completed).
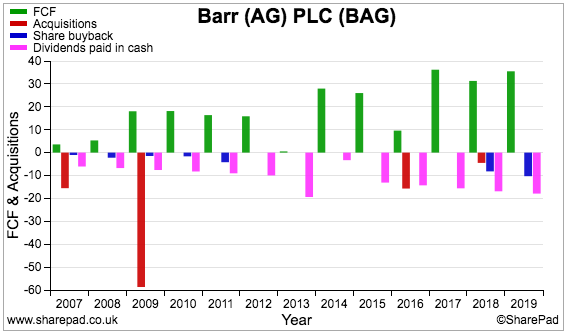
The free cash left over has been spent on the aforementioned acquisitions, dividends and the occasional buyback:
Free cash has also been used to pay off all the borrowings taken on to fund the acquisitions:
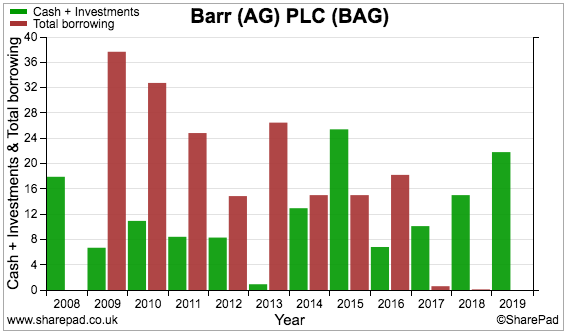
Although AG Barr’s balance sheet is now free of debt, the firm’s pension deficit has been harder to clear — despite the regular ‘catch up’ contributions.
At least the deficit does not appear too alarming compared to earnings:
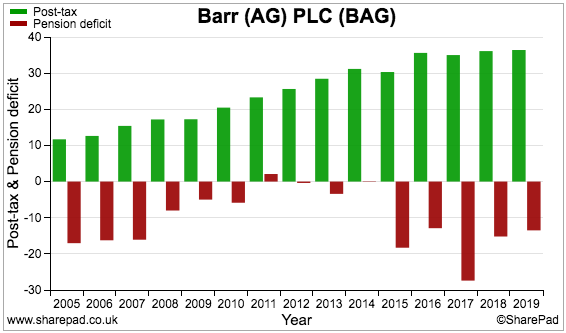
During 2019, pension scheme assets of £102 million and employer contributions of £2 million seemed adequate to fund annual member benefits of £6 million.
Margin and ROE
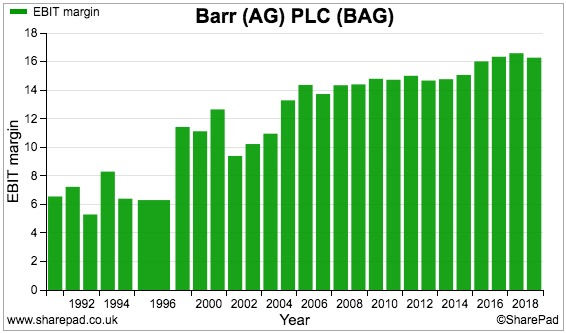
AG Barr’s operating margin has advanced over time to a worthwhile — but not spectacular — 16%:
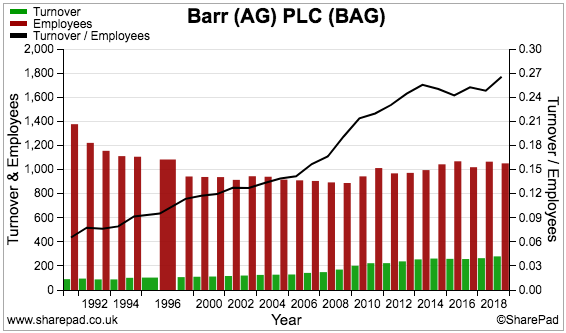
The margin advance has coincided with commendable improvements to staff productivity — as evidenced by the rising sales per employee (black line):
ROE has bobbed around the 20% mark for some years now:
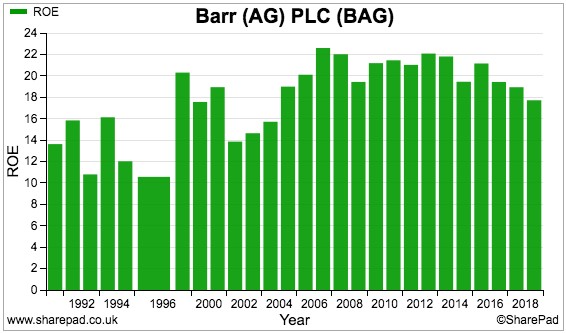
However, the recent ROE trend is not great and, similar to the operating margin, the latest 18% level is worthwhile but not spectacular.
This next chart puts AG Barr’s earnings and shareholder equity (NAV) into greater perspective:
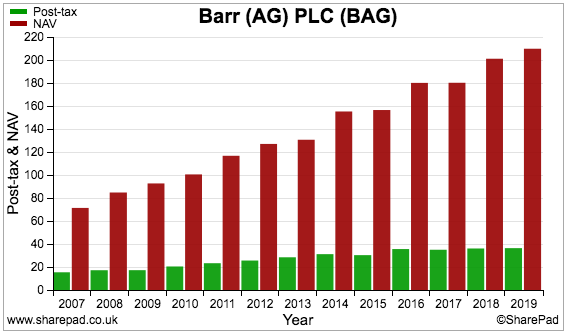
Earnings have clearly advanced slower than NAV. During the last five years, earnings have grown by £5 million while NAV has advanced by £55 million:
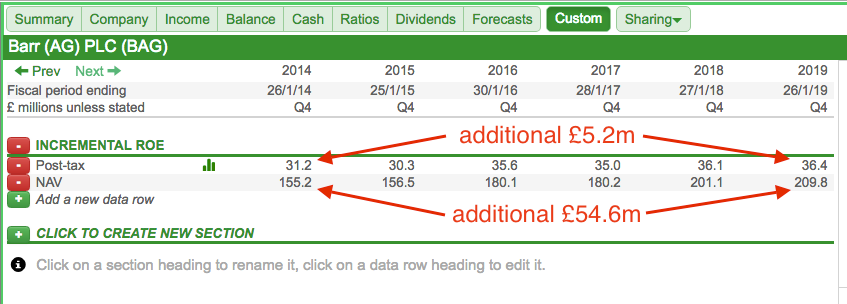
The resulting incremental return on equity is therefore a so-so 10%.
The same calculations for 2010-2015, 2011-2016, 2012-2017 and 2013-2018 are 26%, 19%, 18% and 11% respectively.
These stats indicate AG Barr’s more recent investments have not enjoyed as appealing returns as the investments made much longer ago.
Summary
The chart below is probably the most remarkable for AG Barr:
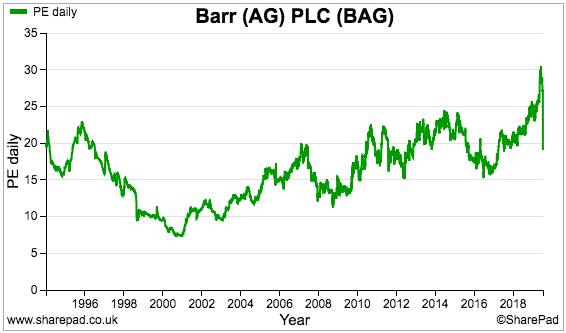
The shares were valued at a hefty 30x earnings just before the profit warning. I must confess, I am not quite sure why.
Sure, AG Barr offers that distinguished dividend record backed by decent cash conversion and a balance sheet flush with net cash.
Furthermore, Robin Barr remains a (non-exec) director and ought to represent the interests of ordinary shareholders (which include his family members) on the board.
However, the company’s recent revenue and profit growth has been modest, the incremental ROE has been tailing off and arguably earnings have been flattered by ignoring the extra pension contributions (and the regular, if small, exceptional items as well).
I can only assume shareholders became carried away with the market’s general infatuation with quality companies — and perhaps did not realise AG Barr did not offer the exceptional economics of, say, Abcam, Craneware and Hargreaves Lansdown.
Now trading at approximately 20 times those (suspect) consensus earnings and offering a trailing 2.7% dividend yield, AG Barr’s shares are — for now at least — not exactly the attractive investment opportunity I was hoping for.
I also wonder whether AG Barr’s setback has signalled a more fundamental business problem. A quick comparison with rival drinks firm Nichols is instructive.
The day after AG Barr’s warning, the Vimto manufacturer happily revealed first-half sales up 10%.
I note Nichols enjoys a greater proportion of non-carbonated sales (45% versus AG Barr’s 24%) and a greater proportion of export sales (20% versus AG Barr’s 4%).
Irn-Bru aside, maybe AG Barr’s range simply includes too many old-fashioned fizzy drinks that fewer people in the UK — and nobody outside the UK — want to buy.
Until next time, I wish you happy and profitable investing with SharePad.
Maynard Paton
Disclosure: Maynard does not own shares in AG Barr.
This article is for educational purposes only. It is not a recommendation to buy or sell shares or other investments. Do your own research before buying or selling any investment or seek professional financial advice.


