
Bruce takes a look at Cathie Wood’s research on previous tech bubbles and what peak Capex to GDP tells us about the current AI spending boom. Companies covered SLP, SFOR, NFG and LUCE.
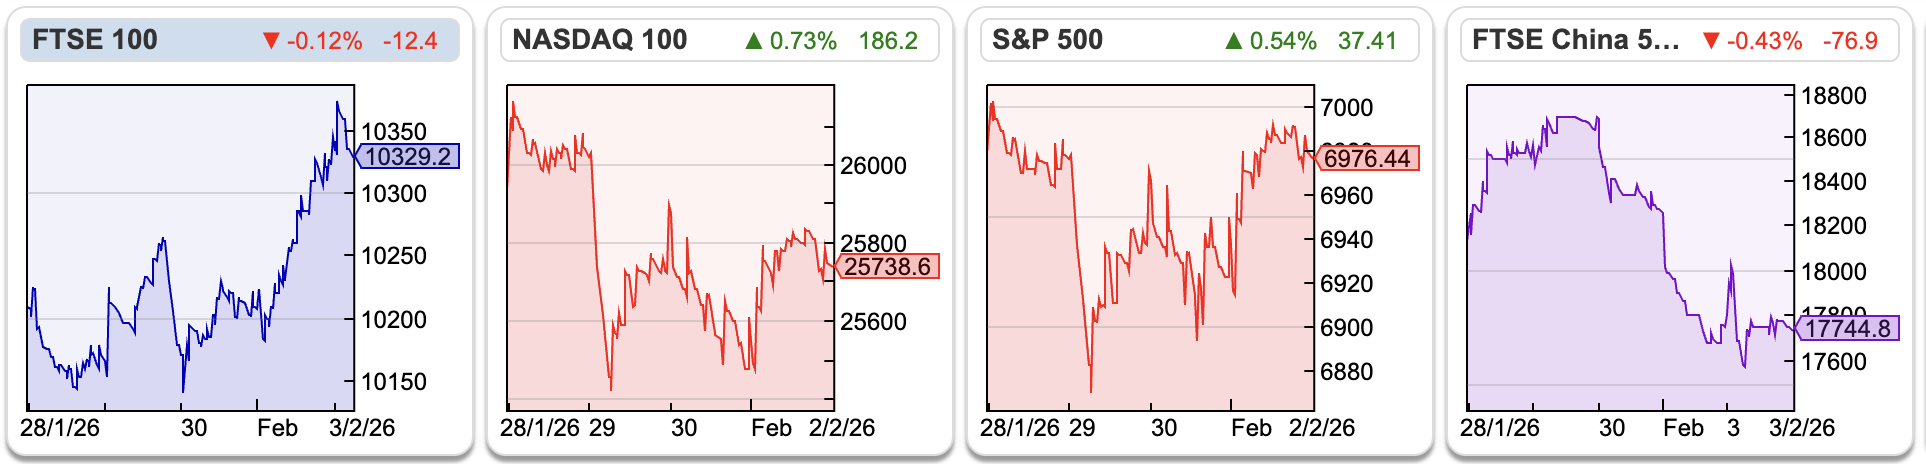 The FTSE 100, though rose +1.2% to 10,329 over the last 5 trading days. Nasdaq was flat and the S&P500 up less than +0.5%. Bitcoin continued to fall, down -7% and silver fell -22% over the last 5 trading days, with people struggling to understand what drove the selling. Natural Gas has been very volatile, down -50% in the last 5 trading days, despite a continued cold spell over much of Northern Europe. German natural gas storage levels are low, with reports indicating storage at 32% full, which is much lower than usual for this time of year.
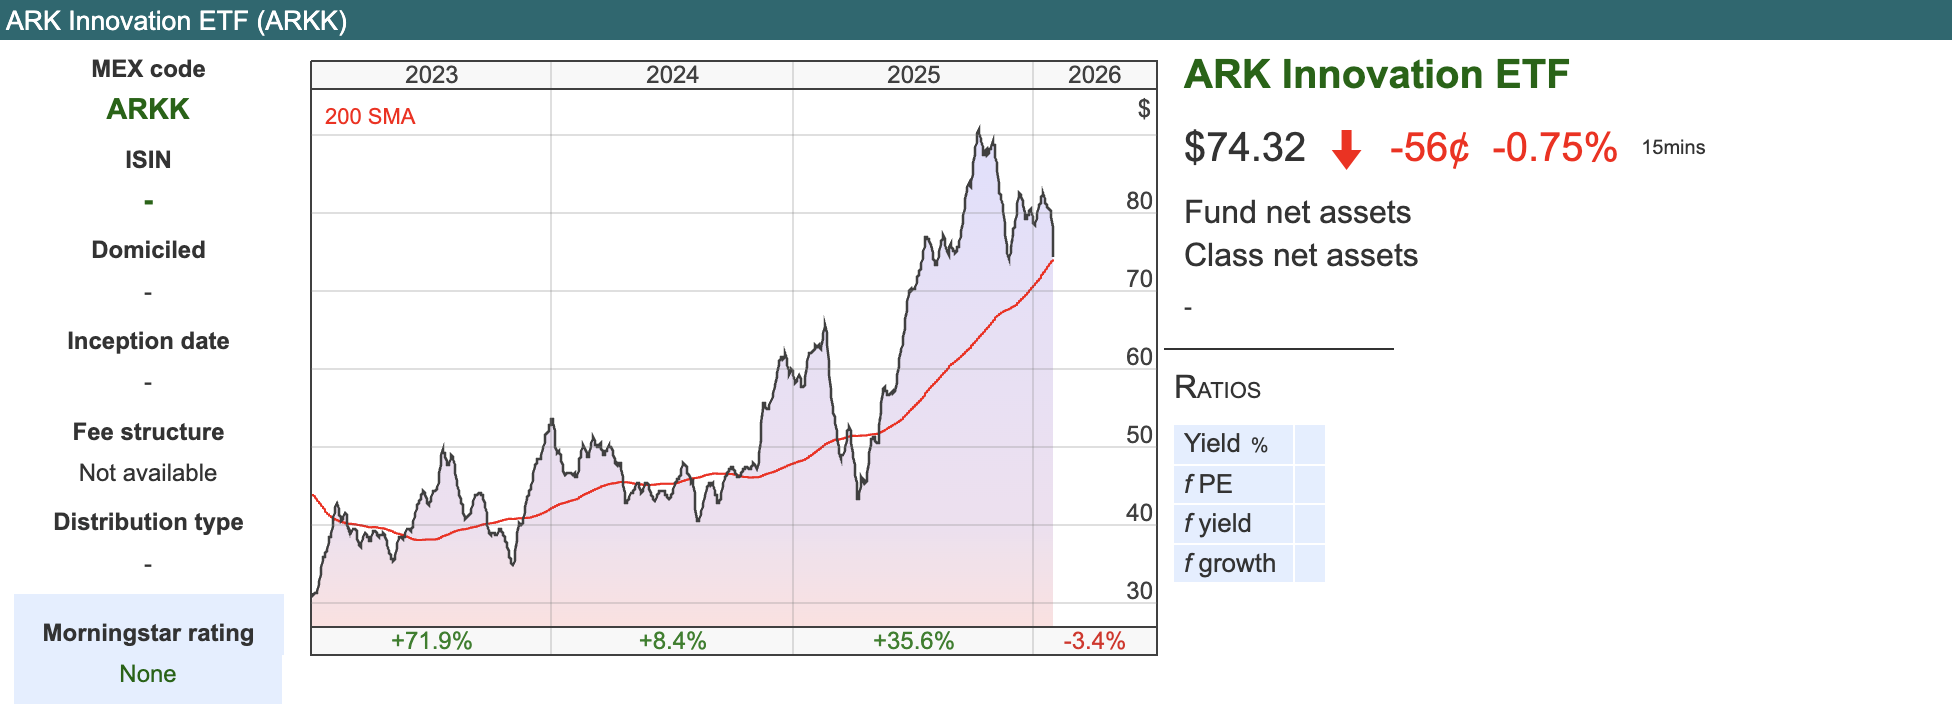
Every year I enjoy Cathie Wood’s annual “Big Ideas” presentation for its technoptimistic view on the world. It’s easy to make fun of robotaxis, drone deliveries and datacentres in space, but I enjoy listening to investors who have totally different world view and being open to the possibility that I’m being too cynical. In addition, Cathie Wood’s ARKK ETF is up 2.5x since early 2023. Much better than my performance and quite remarkable considering that she sold her Nvidia position late in 2022 and early 2023 (just before NVDA rose a further 12x).
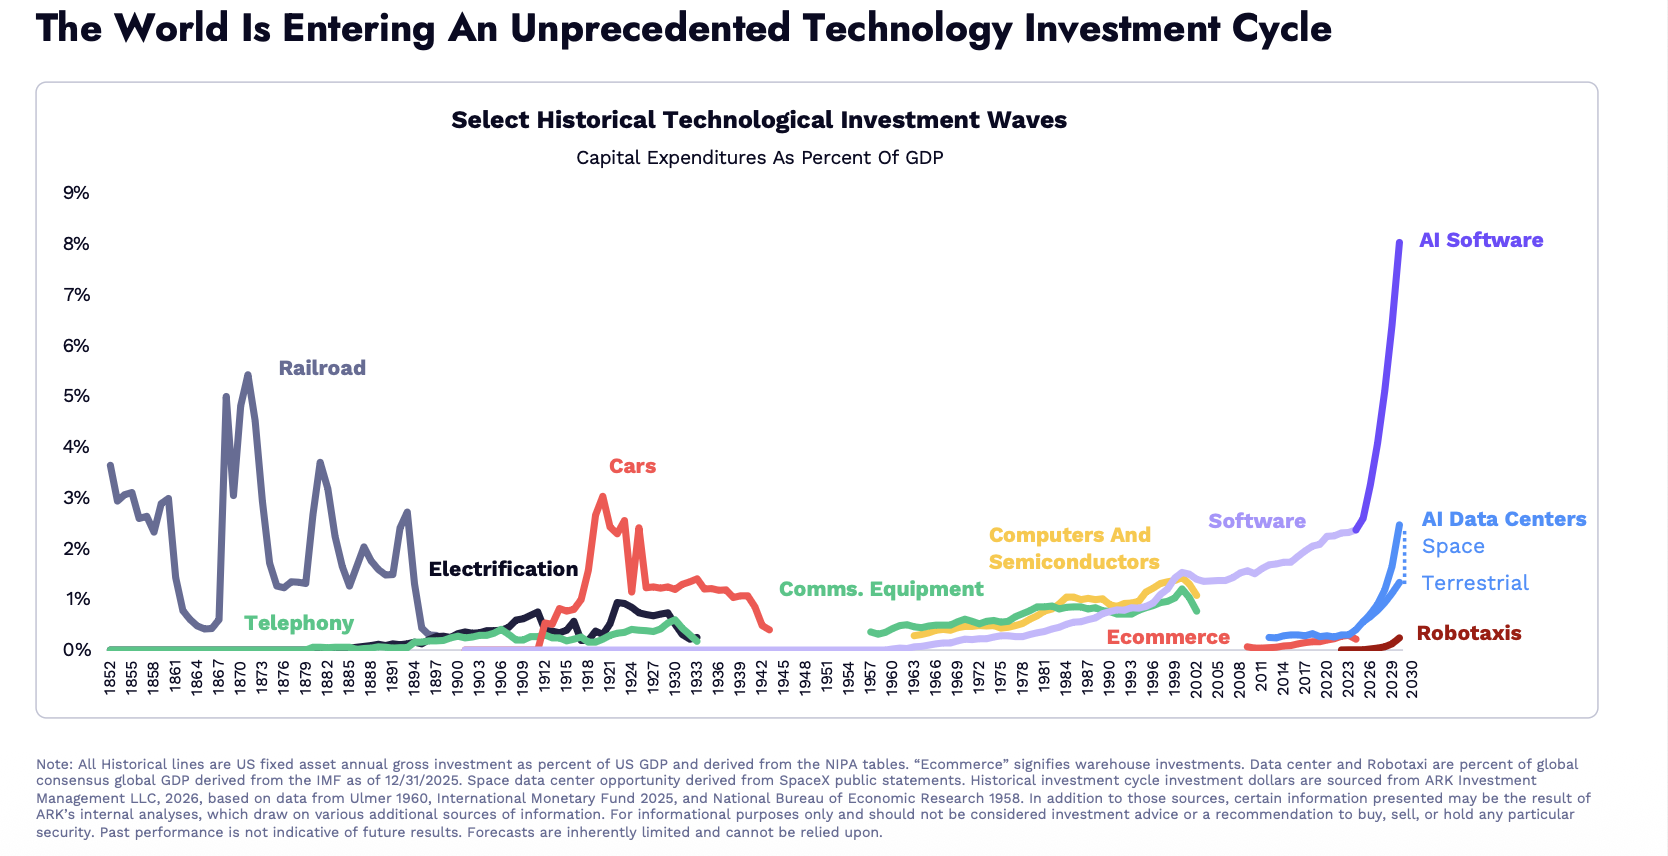
 There’s a link to her 2026 Big Ideas YouTube talk here and the presentation is here. In the talk she looks at previous bubbles (railways, autos, TMT) and excitement over innovation comparing peak capex to GDP (see chart below). This peaked at over 5% for railways, and 4% for the other bubbles, which co-incidentally is where we are now with AI datacentres. That ought to be a reason to call the top and turn bearish, but she believes capex might hit 12% of GDP, because of the significant benefits to productivity from technology convergence.
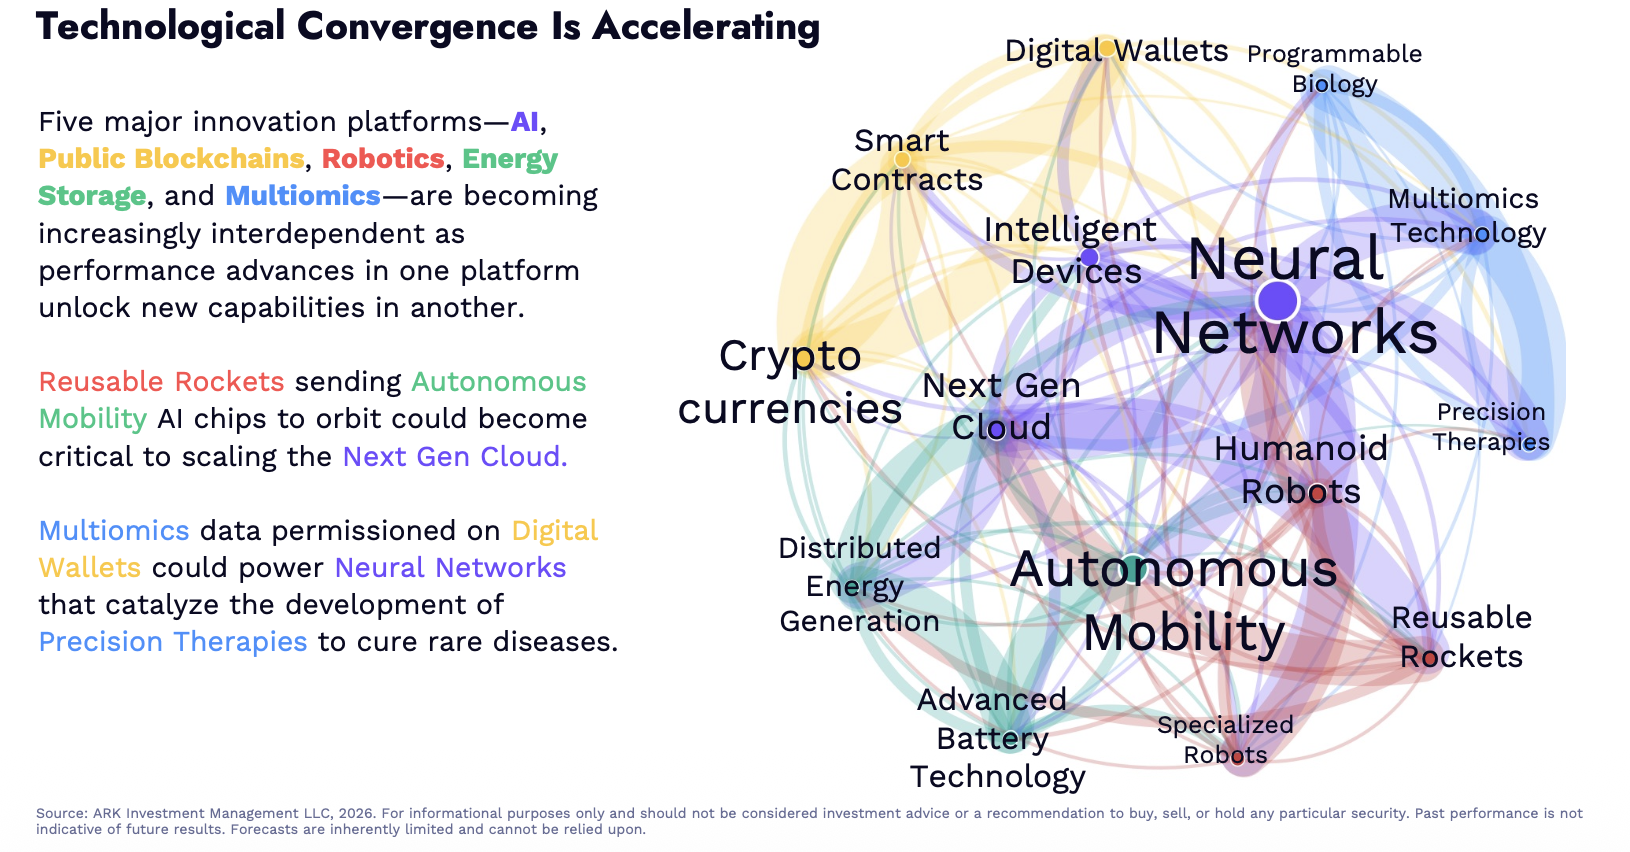
 While previous cycles typically followed a “one technology, one industry” linear path, Wood believes we have entered “The Great Acceleration,” where five major innovation platforms (AI, Robotics, Energy Storage, Blockchain, and Multiomics) are boosting each other simultaneously. Maybe. I’m in the “It’s never different this time” side of the investment fence, but think it’s at least listening to the other side of the argument.
This week I look at Sylvania Platinum’s encouraging Q2 update, helped by strong performance of PGM prices. Sir Martin Sorrell’s S4 Capital’s ahead of consensus Q4 update which may be signalling a bottom after several years of disappointment and Luceco, the LED lighting and EV charging group FY Dec 2025 RNS also ahead of market expectations.
Sylvania Platinum Q2 update
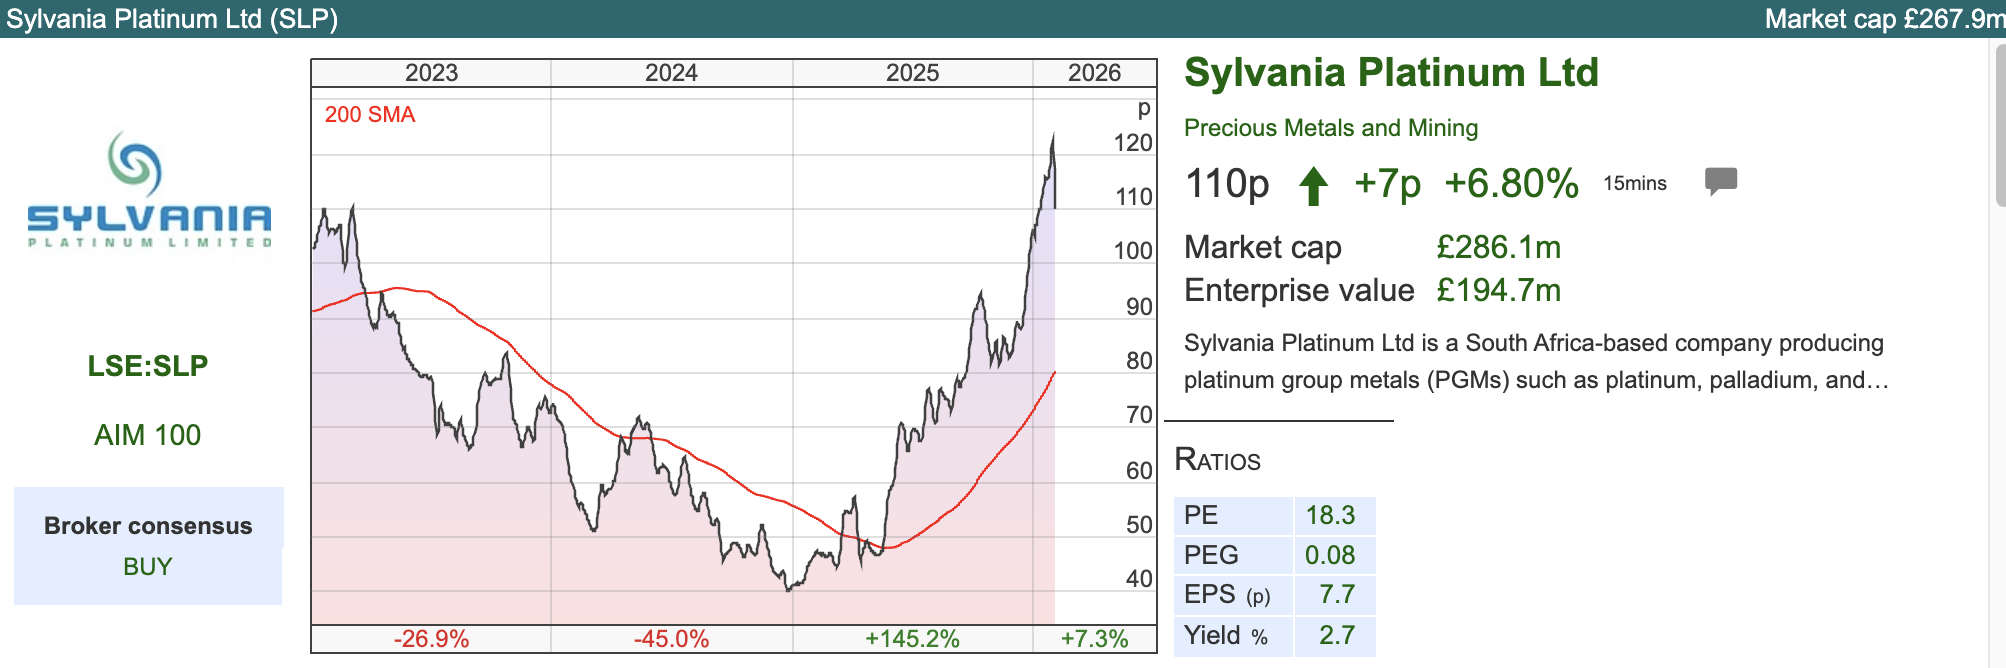 This South African low cost Platinum Group Metals (PGM) company announced a Q2 (Sept-Dec) operations update. Sylvania Dump Operations (SDO), which takes chrome tailings from mines in the Bushveld and processes them through six chrome and PGM processing plants, announced 24,642 4E PGM ounces in Q2 FY2026, a record quarter and up +22% versus Q2 last year.
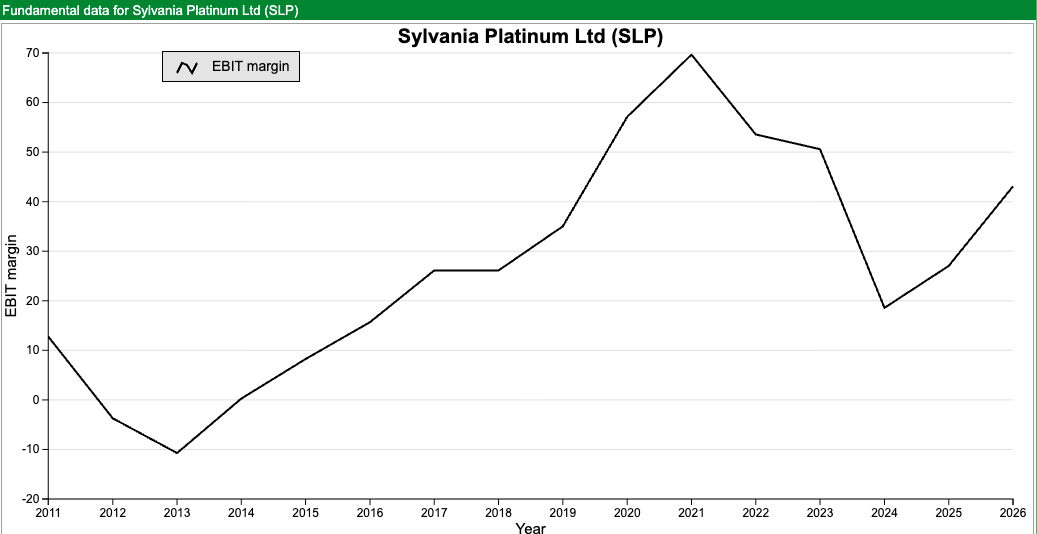
The rising gold and other precious prices means that their average 4E gross basket price increased by +22% in USD. That means Q2 net revenue was $54.8m, doubled from the $25.6m achieved Q2 last year. This is a cyclical business though, with fixed costs and variable revenue – the EBIT margin peaked at 70% during the pandemic when the Palladium price spiked, before falling back below 20%. The ShareScope graph below shows we’re in a helpful part of the cycle currently, with EBIT margin rising with PGM prices.
Management also upped FY Jun 2026F PGM production guidance to 90,000 – 93,000 4E PGM ounces. Previously the guidance was 83,000 – 86,000 4E PGM, and in FY Jun 2025 they achieved 81,002 ounces. Adjusted net profit for H1 was $39m versus previously FY consensus $65m.
In FY Jun 2023, SLP entered into the Thaba Joint Venture which is more chrome and PGM processing plants. Unlike the traditional SDO operations, where they process the mine tailings and return the chrome to the host mine, Thaba allows them to keep and sell the chromite concentrate. Hence this reduces the exposure to the PGM price. The Thaba plant processes both of run of mine (“ROM”) ore and historical chrome tailings from the JV partner, adding a full margin chrome concentrate revenue stream. There’s was some $18m of capex on this FY Jun 2025 and $15m H1 2026, but this looks to be a sensible use of shareholders money. There’s still $54m (£40m) cash balances and no debt.
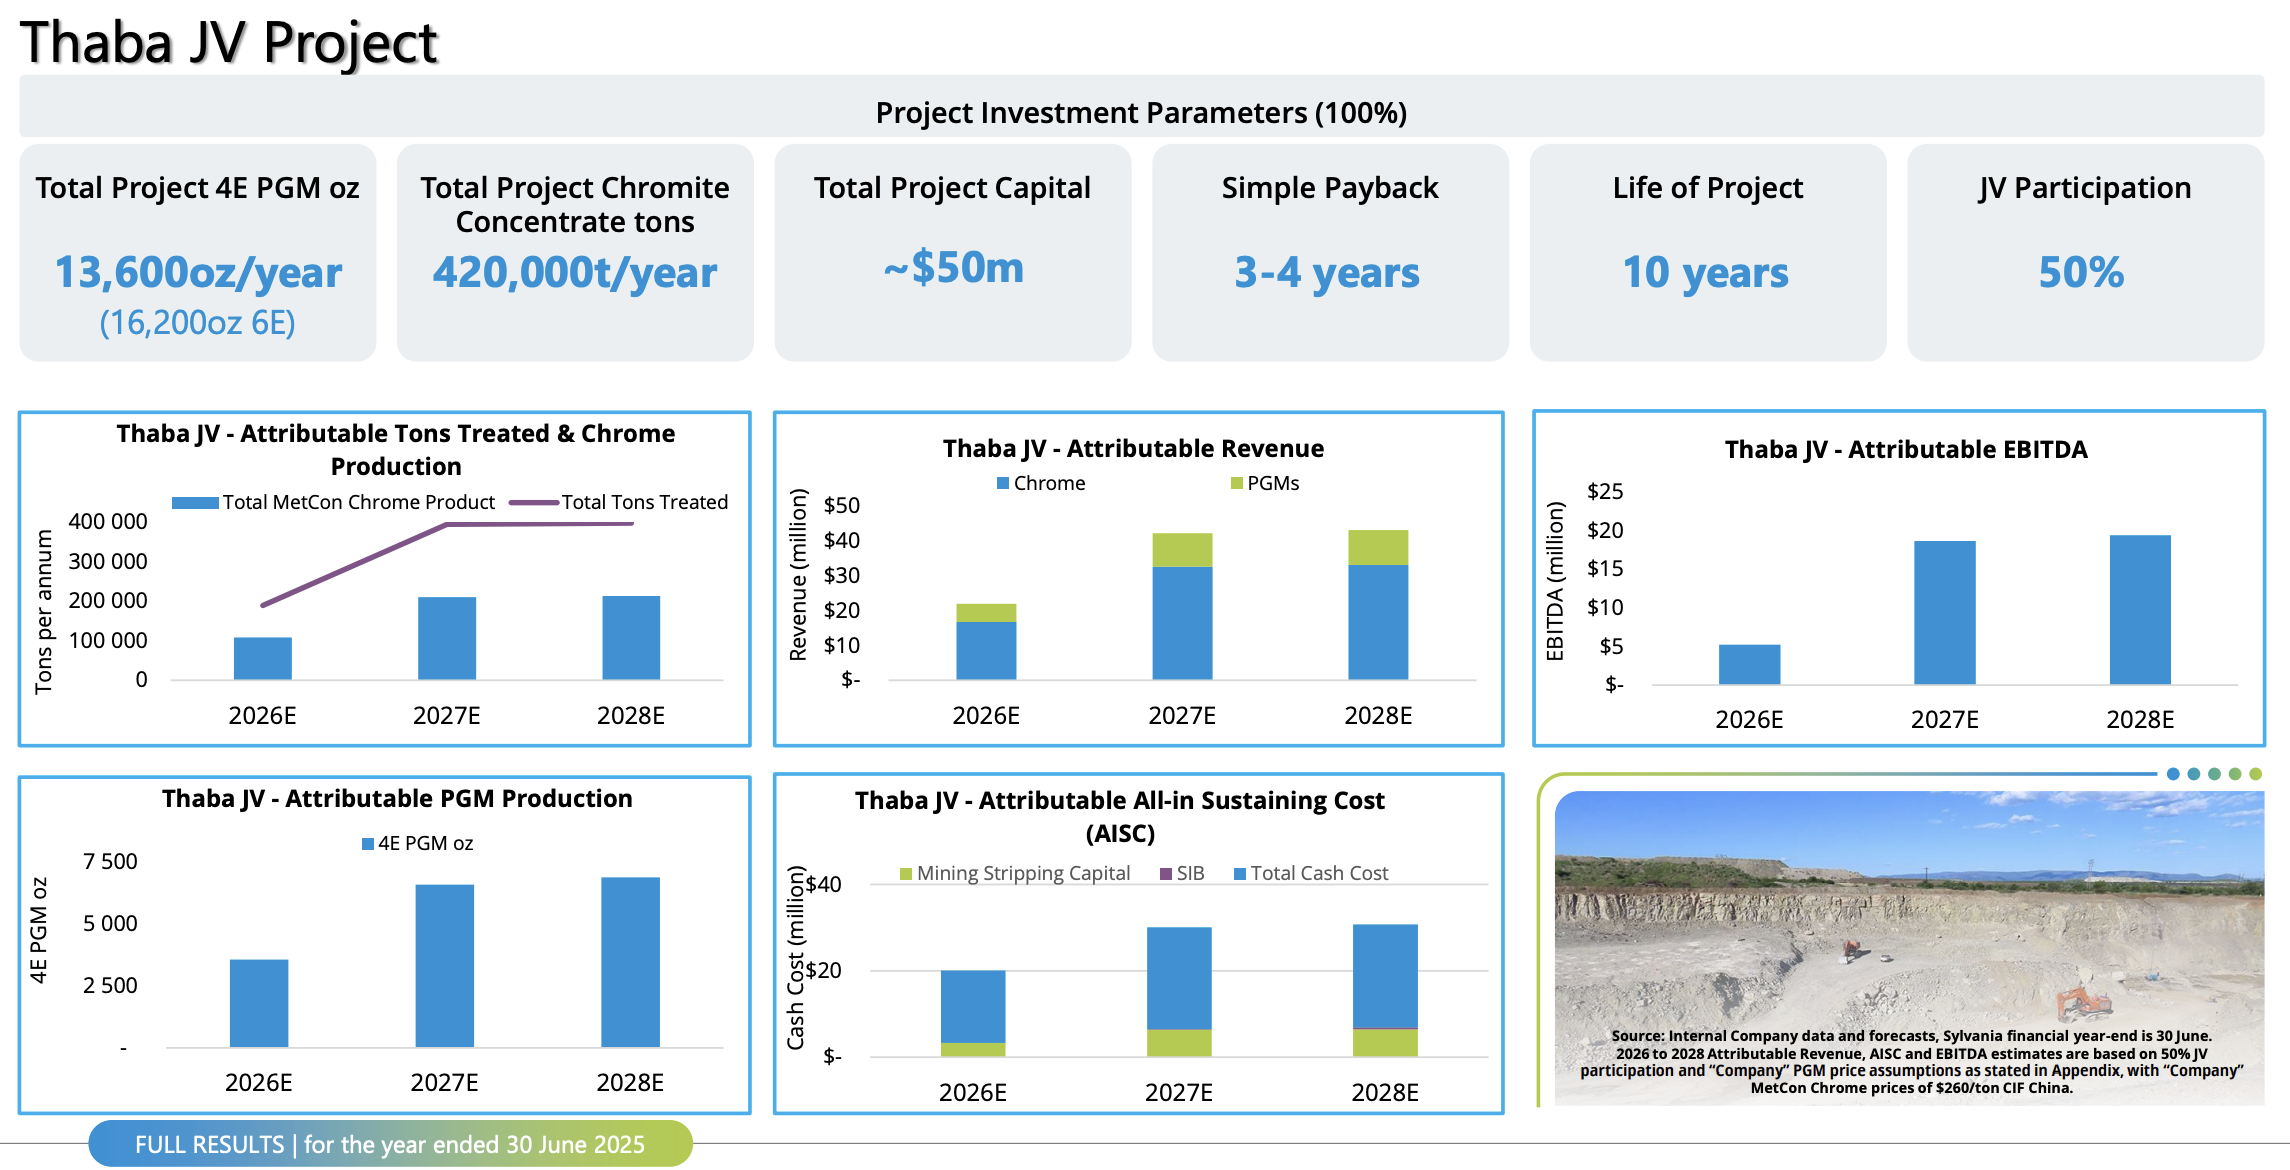 The Q2 update says that the Thaba JV ramp-up was initially slower than anticipated and the chrome concentrate target for the year is adjusted lower to 60,000 – 90,000 tons. The Group also holds mining rights for PGM projects in the Northern Limb of the BIC. I’d say these are more speculative, but could create some value.
Valuation: The shares are trading on less than 5x PER Jun 2026F. Cash represents 14% of market cap, though of course they’re spending that money as capex on Thaba, rather than returning it to shareholders. That’s probably the right thing to do at this point in the cycle.
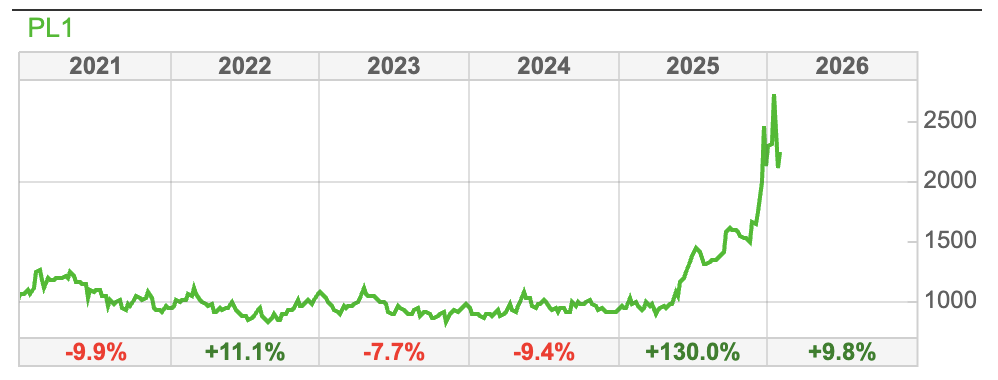
Platinum price: The SLP depends on the price of PGM metals and chrome. The platinum price rose 130% in 2025, but actually the ratio of gold to platinum hasn’t been this weighted in favour of gold since 1907. Likely because Central Bankers are buying gold, not other precious metals.
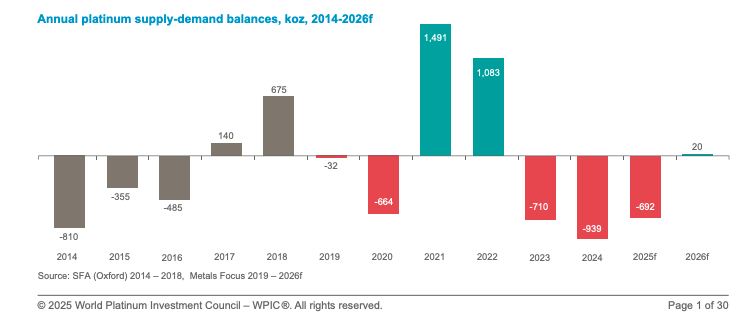
Data from the World Platinum Investment Council (WPIC) where I used to work, shows platinum has been in deficit for the last 3 years. They expect a small 20 koz surplus in 2026F. The lead times for platinum mines are many years, so there isn’t going to be much supply coming on to the market in the medium term. Some PGM exposure feels like it should be negatively correlated with other asset classes. There was a sharp sell off in precious metals at the start of this week, but ShareScope shows that PL1 is still up +10% YTD, following a very strong +130% in 2025.
 Opinion: I like it and have owned it for over 10 years. As noted earlier in the year, I should have sold at the peak and bought back at 40p, but we can’t all be George Soros. Bear in mind that as SLP reprocesses chrome tailings, they are a relatively low cost producer compared to the other miners who dig the stuff out of the ground. So, I’m happy to keep holding.
S4 Capital ahead of consensus
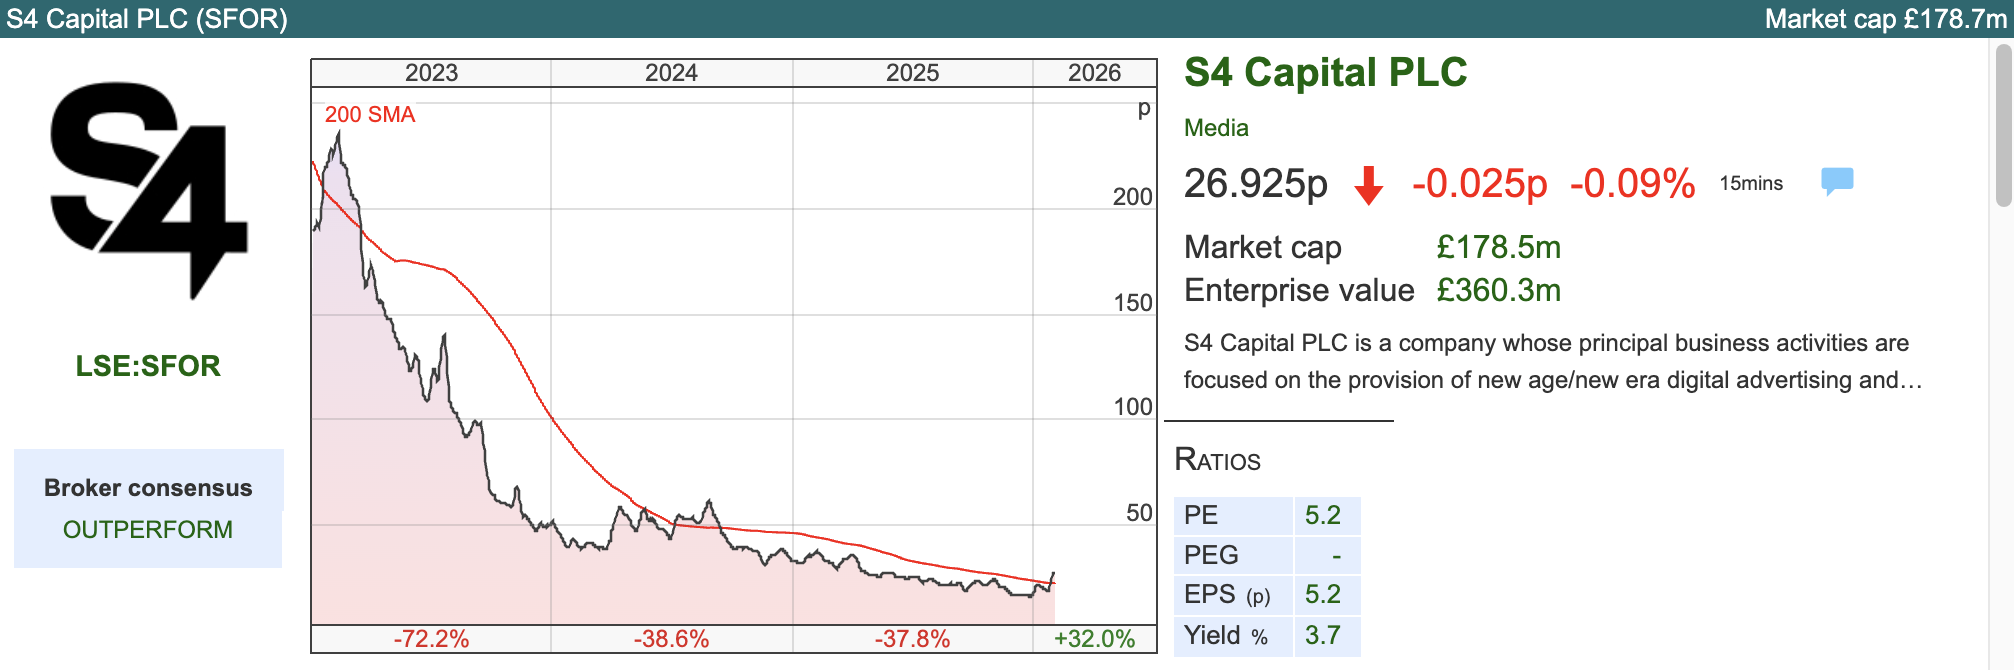 I wrote in November last year that for the smaller UK marketing firms SFOR, SAA and NFG “expectations are now so low that any sign of recovery and these could really bounce hard.” SFOR shares rose +45% last week as Martin Sorrell’s digital marketing agency said that FY Dec 2025F trading is now ahead of consensus (Net revenue £664m, operational EBITDA of £75m). “Bounce hard” indeed.
The old consensus was for net revenue down -12% and a -15% fall in operational EBITDA, both versus FY Dec 2024. Management now expect -8.5% net revenue, with an improved margin of 12%, implying operational EBITDA of £83m, now down -6%.
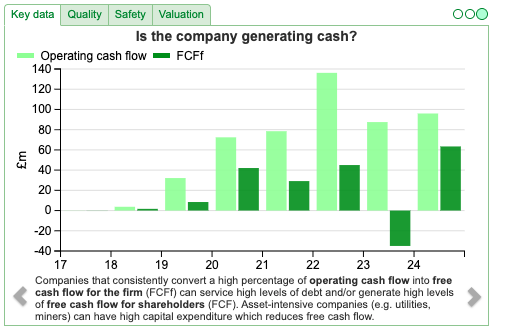
Bear in mind that operational EBITDA of £89m last year translated into a statutory loss of £307m in the FY Dec 2024 results though. Most of those “below the line” items are non cash, so operating cashflow and Free Cashflow for the firm (FCFf) are positive as the ShareScope graph below shows.
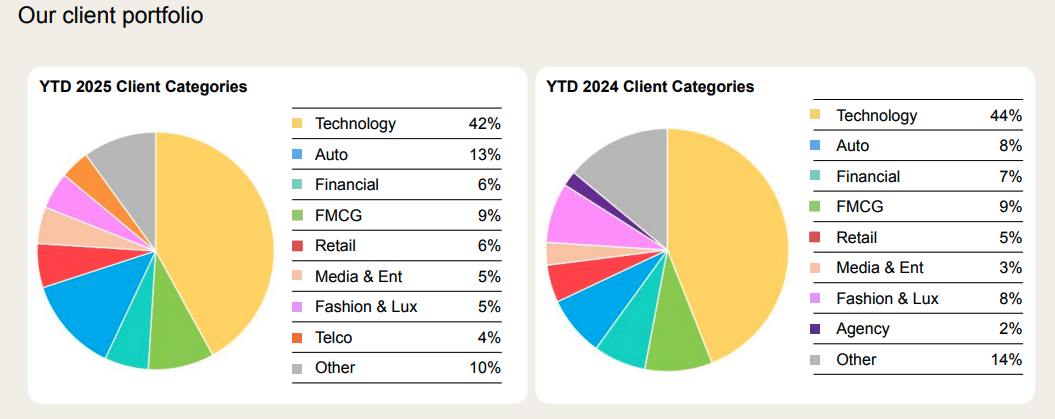
Net debt will be “significantly below” current consensus of £133m (2024 £143m). Net debt to EBITDA is expected to be approximately 1.1x, which seems manageable as long as revenue doesn’t continue to decline. One thing to note is that over 40% of SFOR’s revenue comes from the, rather bubbly, technology sector. There’s some risk that if US tech comes off the boil, then there’s another lurch down in revenue.
Next Fifteen: NFG also put out an “in line” FY Jan 2026F trading statement. They say that the new financial year is off to a good start, with management confident FY Jan 2027F of like-for-like revenue growth and a further improvement in operating profit and margin, excluding some modest investment spend. For context, net revenue was down -21% FY Jan 2025 and -1% the year before.
Valuation: SFOR are trading on a PER of 5.5x Dec 2026F and EV/EBITDA of 3.5x the same year. For comparison NFG is on 8x Jan 202F and 5x EV/EBITDA.
Opinion: Annoyingly, the SFOR update doesn’t give any idea why the final month of the year has been so strong. Management reduced guidance in November last year, the same week as M&C Saatchi’s profit warning. Perhaps there was some “kitchen sinking” in order to rebase expectations so low that things couldn’t get any worse? Despite the strong bounce, the shares are still down 95% from their peak.
Investment case seems to me very wide variety of outcomes: that is i) either multibag strongly if revenue growth can be restored, or ii) if revenue continues to decline, then it could fail. I wouldn’t bet the house on this, but I can see that this might make sense depending on your risk tolerance.
Luceco FY Dec Trading Update
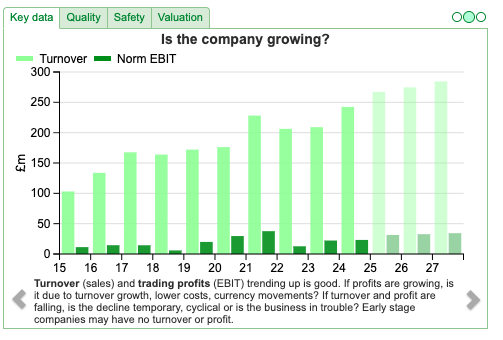
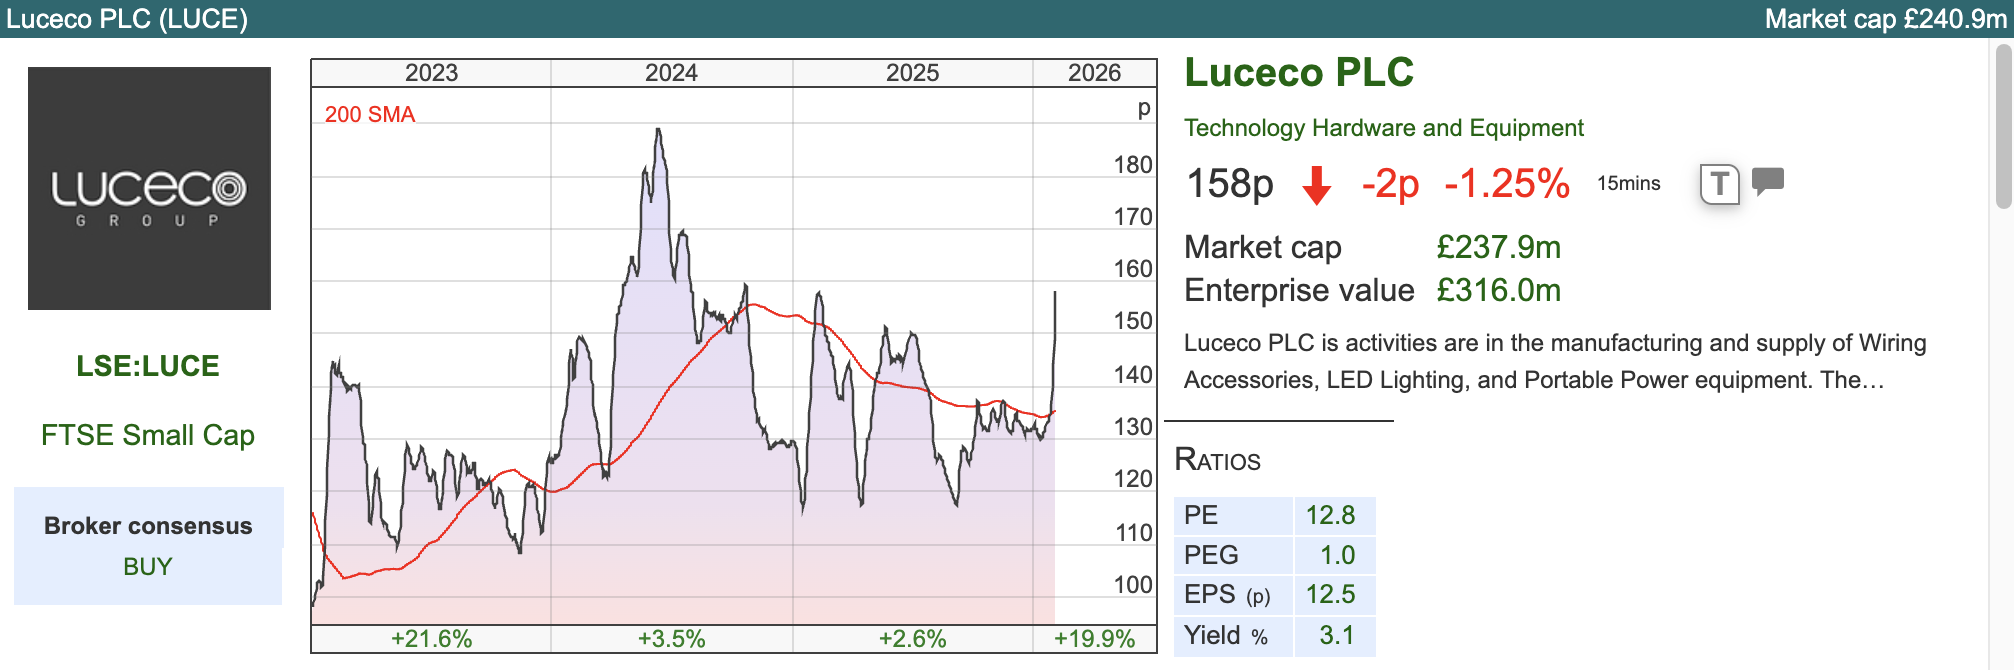 This LED lighting, wiring and EV charger company announced FY Dec performance to exceed previously upgraded expectations (adj op profit £32m). They say that revenue +12% to £271m, with H2 revenue up +6% on a like-for-like basis. Luceco makes these electrical products in China and ships them, principally to the UK, so there is some sensitivity to global trade and shipping costs. Sharescope shows that in FY Dec 2022 revenue fell -10% and profits collapsed -65%.
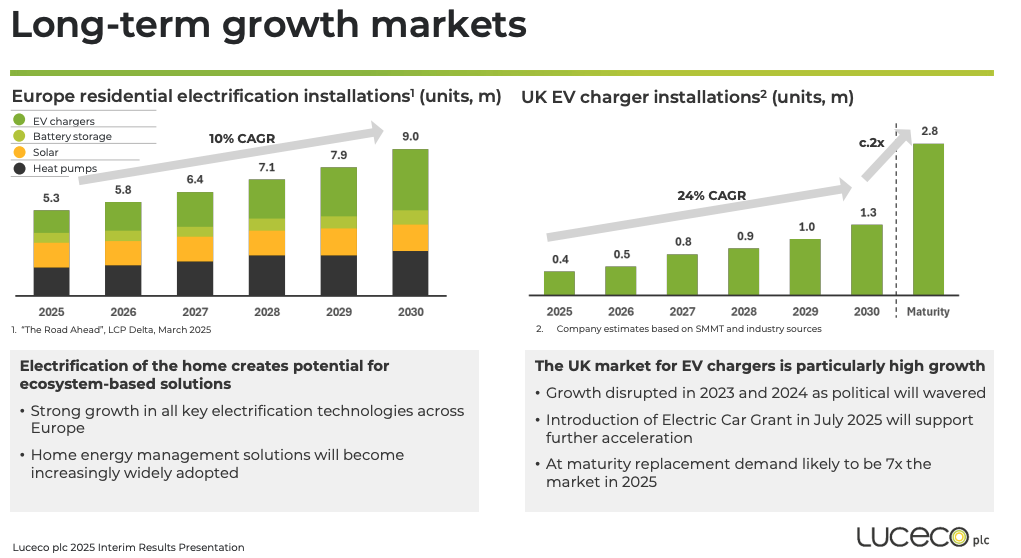
EV charging is only 7% of the group total, but growing at +85% y-o-y. At the half year results management wrote: “The UK’s EV market is experiencing rapid growth due to a combination of factors driven by the global climate agenda, resulting in increased government incentives and therefore rising consumer interest, resulting in an expansion of EV charging infrastructure. The UK has seen an increase in used EV sales as more affordable options become available and consumer battery concerns are addressed.”
Adjusted operating profit is expected to be at least +£33.5m, which implies +15% growth and an adj op margin of 12%. NB last year’s adj op profit of £29m translated into a statutory PBT of £19m. Bank net debt on 31st Dec year end of c.£53m, or 1.3x EBITDA. When I read “bank debt” I always check for acquisition related liabilities (earn outs or similar), but there are no large items on the face of the balance sheet.
Valuation: The shares are on a Dec 2026F PER of 10.6x and an EV/EBITDA of 6.4x the same year. That seems like it’s probably too cheap, depending on how big you think that the EV market might become, the threat from competitors and how attractive the returns are from making EV chargers is.
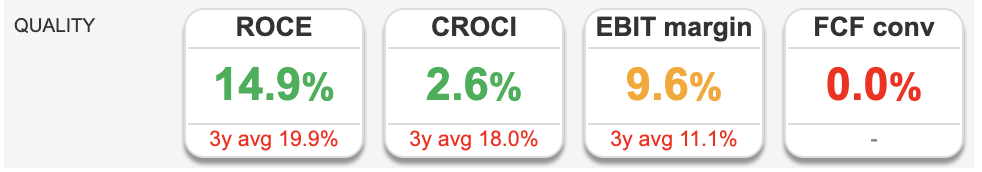 Opinion: Richard wrote it up here, halfway through the share’s -87% drop between Sept 2021 and Oct 2022. So this might not be as boring and stable as first appears. ShareScope’s quality indicators also suggest that although the 3 year average RoCE is impressive, close to 20% the cash conversion is currently weak. Worthy of further investigation, but I don’t own it at the moment.
Bruce Packard
@bruce_packard
This article is for educational purposes only. It is not a recommendation to buy or sell shares or other investments. Do your own research before buying or selling any investment or seek professional financial advice.


Re: LUCE…. When JD Vance came to the UK a few months ago and stayed in the Cotswolds, he stayed at the private residence of LUCE’s owner. All of a sudden, a very positive December trading update… Am I too cynical?
Bruce has commented that the Palladium price spiked during the Pandemic and was the reason for the 70% EBIT margin, I would suggest that the high price of Rhodium was the primary reason for the spike in EBIT margin, the price reaching 27,000 before dropping to around 5,000. It has since recovered to around 10,000
Thanks Robin, yes Rhodium up strongly as well as Palladium. They’re both Platinum Group Metals, which helped SLP deliver that high margin. Bruce