A look at what might be causing the divergence in performance between the FTSE Small Cap (SMX) index -8%, which has outperformed FTSE AIM (AXX) -44% since Sept 2021. Companies covered CAV, WYN and TET.
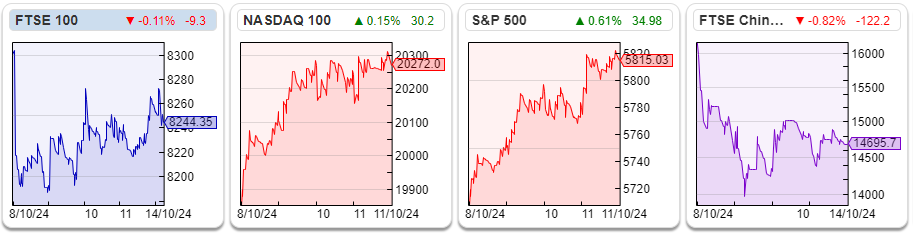
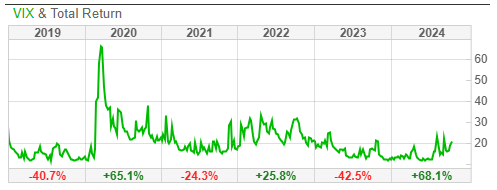
The FTSE 100 was down -0.75% to 8,244 last week. The Nasdaq100 and S&P500 were both up just over +1%. Oddly there was a peculiar divergence in Asia. FTSE China 50 and the Hang Seng were down sharply: -8% and the worst-performing major indices while the other Chinese indices: the CSI 300 Index (Shanghai) and SSE Composite (Shanghai) were the best-performing +4% over the last 5 days. I think the conclusion to draw is that international investors believe the benefit of the Chinese stimulus will not reach Hong Kong, or even the largest stocks listed in the FTSE China 50. Japan’s Nikkei 225, the third best-performing index rose +2.5% and followed the two local Shanghai indices higher, while the VIX rose to above 20.
Hat tip to Sharepad user Cockney Rebel, who points out on his Substack that a divergence closer to home: the FTSE Small Cap (SMX) index has outperformed FTSE AIM (AXX) since the beginning of the sell-off. It makes little sense that the two UK indices focused on the smaller end of the market have diverged so much, with AXX down -44% versus the FTSE Small Cap -8% since Sept 2021.
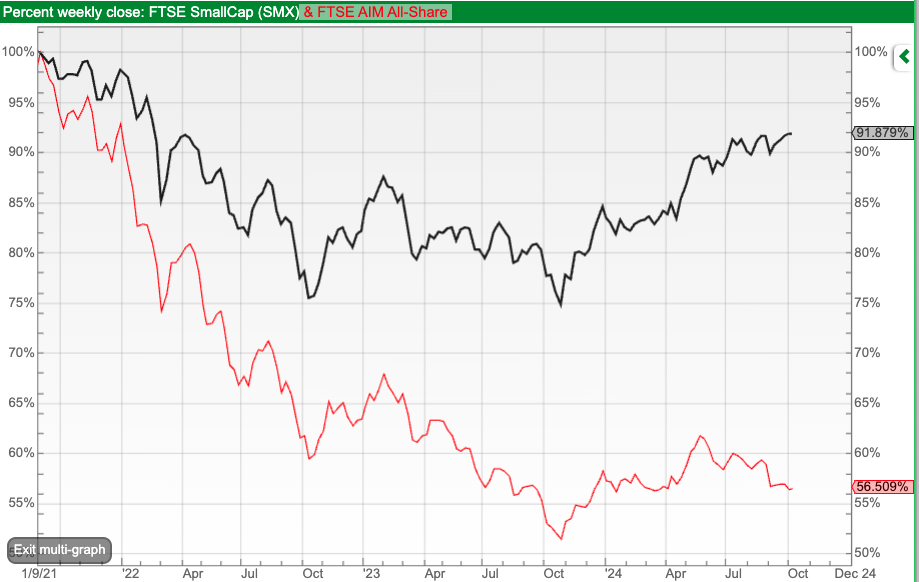
For comparison, Vanguard’s Global Small Cap index tracker (VIGSCA) is up +6% over the same time period.
The recent speculation about the government changing inheritance tax or CGT rules hasn’t helped, but most of the AXX underperformance pre-dates that news. I have a couple of theories: i) the flow of money into passive index trackers has helped the FTSE index more than AIM ii) the FTSE consists of more professionally managed money and AIM is more of a private investors’ market. While many people, including myself, have been focused on the outflows that professional fund managers have seen, perhaps there’s been an even more significant trend of UK self-directed investors having a go at investing during the pandemic, and then losing heart selling AIM stocks into a declining market?
The two explanations are not mutually exclusive, both suggest that attempting to reinvigorate London’s financial markets by weakening investor protection rules would backfire. Naturally, investors want to invest in exciting growth companies, the next Keyword Studios or Judges Scientific; unfortunately AIM’s lower standards have been exploited by some, which has led to disappointing returns. In October we could see more downward pressure on AXX due to concerns about the Budget, but the longer-term divergence versus the other UK small cap index or Vanguard’s global index makes little sense to me.
Speaking of disappointments, a brief mention of RBGP, the litigation finance company, which has delivered another profit warning. I last wrote up the company in August last year, when I suggested that the investment case was high risk and we could be confident that the share price wouldn’t be 20p in two years’ time. The shares have been down another 90% since then. At the time I suggested FinnCap/Cenkos – now renamed Cavendish, could be a better way to benefit from improving capital market conditions.
Hence, this week I look at broker Cavendish’s positive trading update, also Wynnstay’s profit warning and Treatt’s reassuring FY Sept update, when their H2 weighting did materialise with +16% revenue growth H2 v H2 last year.
Cavendish H1 Sept trading update
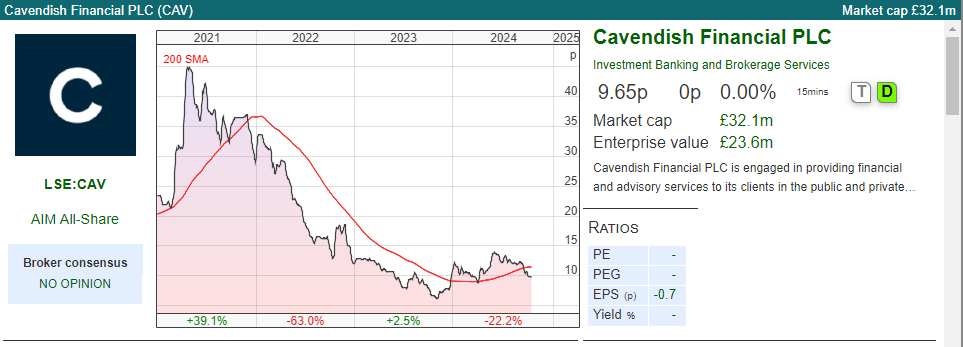
Many readers will be familiar with stockbroking firms and NOMAD to many AIM stocks, which makes its research freely available to private investors. It’s been a difficult few years, and the company merged with Cenkos in September last year, pro-forma revenues FY Mar 2024 were £54m. Management said last week that they expect to be profitable for H1 to September, on revenues of £27.5m. That compares to an FY March loss of £4.3m and another loss of £6.3m the prior year.
Outlook: There are no forecasts in the market, I wouldn’t put much weight on forecasts in this sector anyway, as the timing of IPO’s seems inherently hard to predict. Management also highlight well-publicised uncertainty around the upcoming Budget. Although they were profitable in H1, there’s no comment on H2, except to say that the pipeline is “solid”. I’m not sure that’s the correct image management wish to convey, surely we would prefer a fast-flowing pipeline? Their guidance suggests an image in my mind that the contents of their pipeline resembles a fatberg under London.
Brokers v fund managers: Last week we saw 5 active UK fund managers report Jun-Sept outflows. There’s obviously a symbiotic relationship between brokers, who benefit from trading commissions paid by fund managers and who also need fund managers to buy into their IPOs. If active fund managers are still seeing mid-teens annualised outflows, I’m sceptical about brokers’ IPO pipeline.
I’ve sorted the list by market cap but also highlighted Impax, which has been the worst performer, down -29% YTD as investors have continued to be sceptical about ESG investing. This is the one fund manager I own.
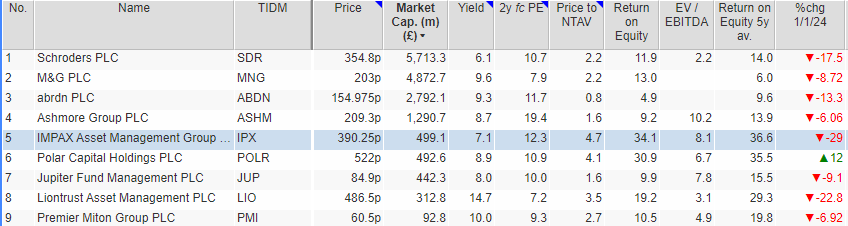
The old rule of thumb was that active fund managers should trade on 4% of Assets under Management (AuM). The table below reveals that heuristic no longer applies as the fund managers, like brokers, are also struggling to deal with the growth in popularity of low-cost passive funds. The new 4% of AuM has shrunk to a range of 0.55% to 1.4% – with Polar Capital the outlier on 2.1% AuM. Most active fund managers are seeing outflows of mid-teens percentage when annualised; that is taking the most recent quarterly number and multiplying by 4x. The table below shows that Impax and Polar Capital trade at a premium, due to their specialist nature whereas Jupiter and Miton trade at a discount.
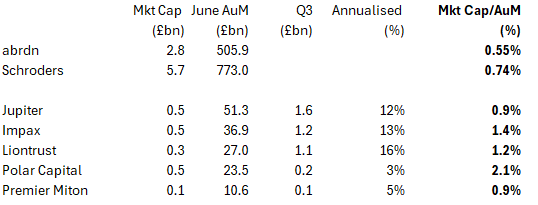
Interestingly there’s nothing to suggest that scale leads to any premium, both Schroders and Arbdn with over £0.5 trillion AuM are trading on less than 0.8% AuM. Blackrock, with over $11.5 trillion AuM trades on 1.2% AuM. Over the quarter, the US behemoth saw $160bn in long-term flows, while an additional $61bn flowed into its cash management products like ICS Sterling Government Liquidity Fund, which charges 10bp to track Sterling Overnight (SONIA).
Valuation: Cavendish had £17m of cash at the end of September, just over half of the firm’s £32m market cap. In good years this company can report a RoCE of almost 30% and an EBIT margin of just under 20%. Assuming £60m of revenues would imply £12m of PBT is achievable – implying the current valuation is less than 4x “peak” earnings. Assuming a normalised EBIT margin of 10% would imply 1.3p EPS per share or a PER current valuation of 8x normalised earnings.
Opinion: Cavendish seems a well-managed company in a difficult sector. The investment case could make sense if you are feeling upbeat about the prospects for AIM in 2025, with the cash providing downside protection. One thought I had was if we look 5 years into the future, Cavendish’s decision to make equity research available to retail investors might create more value than other brokers who have focused on serving professional fund managers, who are seeing outflows and are a melting ice cube.
I haven’t bought any CAV myself, in part because I think that this isn’t just a cyclical downturn. There’s a structural shift towards passive investing and low-cost active ETFs, which is hurting both stockbrokers and active fund managers. I thought that Impax, with its long track record of environmental investing, should be insulated from the trend towards passive, but YTD the shares have been the worst hit. I’d be more likely to average down into Impax than open a new position in CAV.
Wynnstay profit warning
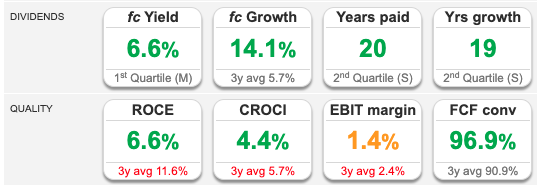
This agricultural supplies group with a 31 Oct year end announced that results will be “materially lower than current market expectations and lower than the previous year”. Sharepad showed FY Oct 2024F revenues were already expected to decline by -10%, but PBT was forecast to be flat. The two main areas of disappointment are: i) underperformance of the Feed division ii) falling margins at Glasson Grain, which blends fertiliser. Agricultural commodities spiked up in the first half of 2022, following Putin’s invasion of Ukraine, but since then we’ve been remarkably lucky that they have declined alongside the natural gas price, which is also down c. 70% from its peak that year. Interestingly the shares were only off -6% on the day of the warning, perhaps reflecting that management had already warned that conditions were difficult, but also because of the better outlook for livestock and dairy in FY Oct 2025F and the 20-year dividend history.
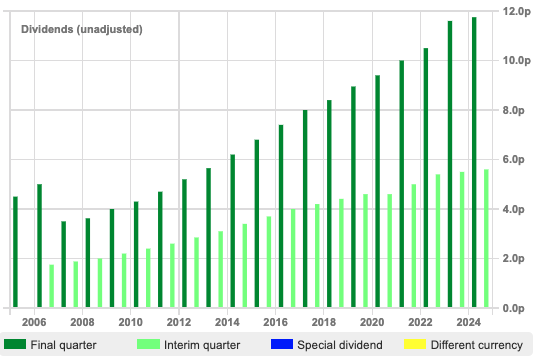
There’s no net cash figure mentioned in the RNS, but it was £18.5m or a quarter of the market cap at the end of April. The FY dividend was £3.9m, so that it would be easily affordable for management to pay an uncovered dividend this year and even next year.
History: The group was founded more than 100 years ago as a farmer’s co-operative in Llansfechain, Wales. Over the decades the business gradually bought hard assets like mills, storage and other plant-growing feed, fertiliser and merchanting businesses. It currently has 12 manufacturing sites and 53 depots, predominately in the West of England and Wales.
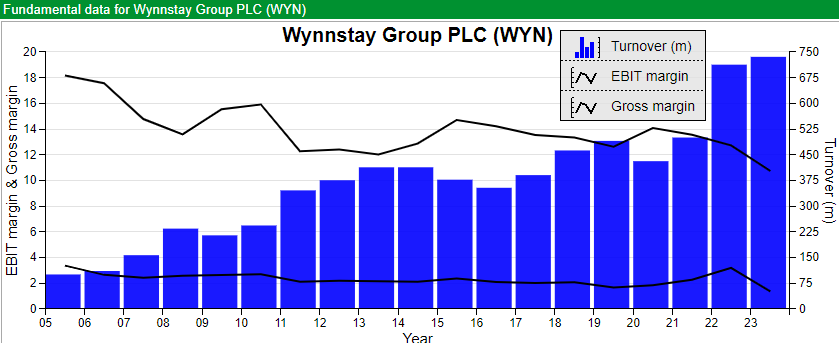
It only became a plc in 1992, and listed on OFEX in 1995 before switching to AIM in 2004. Sharepad shows that the company has enjoyed good topline growth, growing sales from less than £90m in FY Oct 2002 to over £700m, but has always struggled to generate a margin. The long-term price chart shows that while this is not a “buy and forget” stock, investors can make some big gains if they can get their timing right. For instance, the shares 4 bagged after the financial crisis and 3 bagged following the pandemic.
Valuation: The shares are trading on 13x PER Oct 2025F, so not obviously cheap in this market. But I think investors are correct to anticipate a recovery next year and the share price chart looks to be forming a bowl. The dividend yield is 5.5%, so even if the shares don’t recover there should be good yield support.
Opinion: Some exposure to the agricultural sector and rising food prices could be a good idea at the moment. Personally, I’ve done this by owning MP Evans, the Indonesian palm oil company. Timing is hard, the outlook may disappoint again. However, the company appears well run, the conservative balance sheet means that the dividend yield of 5.5% is well supported. I have no position, but at this point in the cycle, I would rather be a buyer of this stock than a seller.
Treatt FY Sept Trading Update
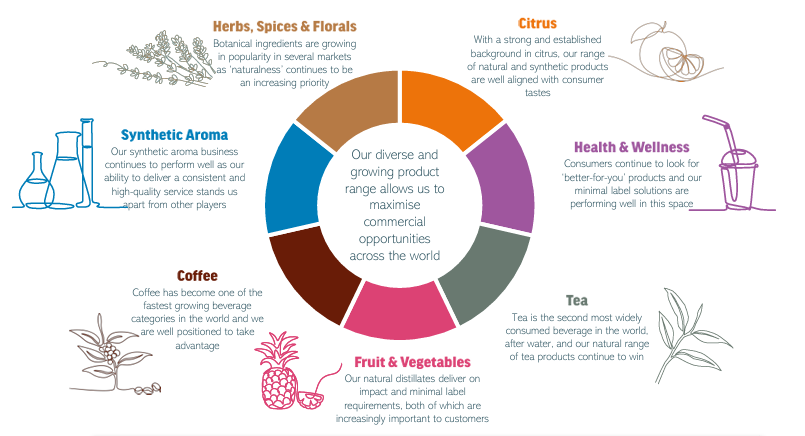
This manufacturer of food extracts and flavourings has had a rough couple of years, but published an “inline” trading update for FY Sept 2024F. Theoretically, TET should have been defensive in an inflationary environment, as management suggested that branded drinks were “affordable luxuries”. Below is an explanation of the company’s product categories.
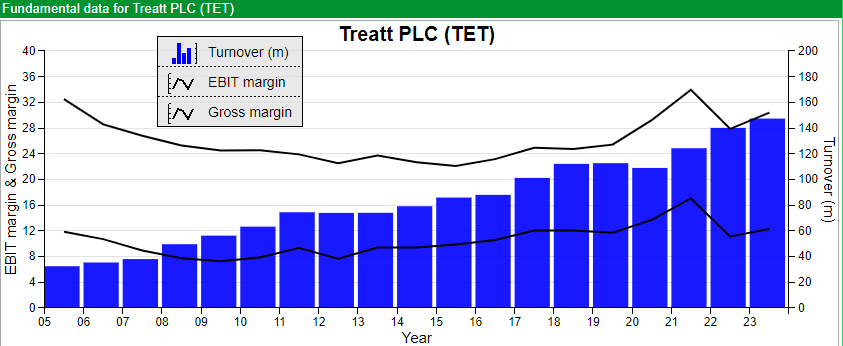
In reality, the gross margin has been hit, falling to 28% at the H1 stage versus a 34% peak FY Sept 2021. That was caused by the price of raw materials increasing while the group lacked pricing power to pass on this cost to customers. Revenue growth has held up well at TET, growing at +9% CAGR since Sept 2020, so in some ways, it’s a similar story to Fevertree, which also saw +10% CAGR in revenue but suffered margin pressure from higher input costs.
Last week TET said FY Sept 2024F revenue will be £155m, up +5%. That may sound unexciting, but H1 revenue was down -5%, implying an H2 acceleration to +16%. So, fortunately, their H2 weighting has come through. The company expects to report PBT before exceptionals of £18.8m, up +9% versus last year. Net debt has come in better than expectations, at less than £1m versus £22m two years ago.
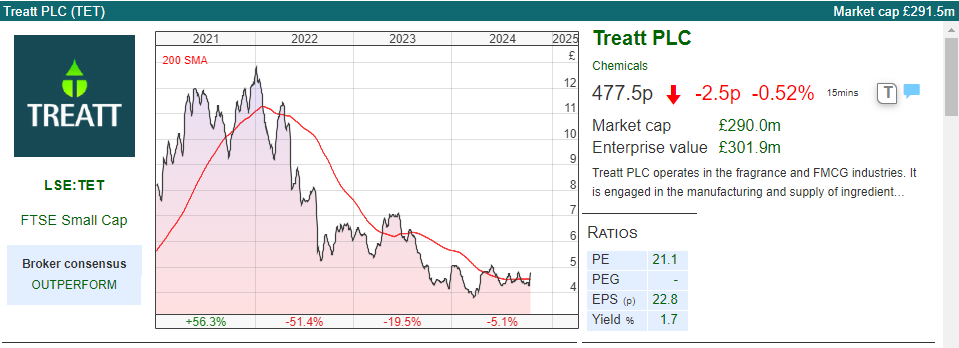
Valuation: The shares are trading on 18x Sept 2025F, dropping to 16x the following year. Similar to WYN, the chart looks to have found support around these levels. Unlike WYN the dividend yield is less than 2%, though I would prefer TET’s long-term track record of less cyclical profitability (below) than WYN. Notice TET’s EBIT margin tends to be around 10%, whereas WYN’s struggles to rise above low single digits.
Opinion: I wrote about the shares in 2022, suggesting scepticism towards management’s explanation of what was going wrong. Management teams will often try to convince investors that the problems are temporary, for instance, a short-term currency movement, rather than long term or difficult-to-fix (eg. lack of pricing power) problem. Fast forward to 2024, and that’s been the case for TET, which has seen their margin mean revert back down towards their pre-2020 long-term average. The share price is also down by two-thirds from its 1280p peak at the end of 2021. On a high-to-mid-teens PER ratio, the shares are not obviously cheap, but the long-term track record is impressive and if the gross margin improves I would imagine that there could be scope to beat expectations in the coming years.
Notes
Bruce owns shares in Impax AM
brucepackard.com
Got some thoughts on this week’s commentary from Bruce? Share these in the SharePad “Weekly Market Commentary” chat. Login to SharePad – click on the chat icon in the top right – select or search for “Weekly Market Commentary” chat.

This article is for educational purposes only. It is not a recommendation to buy or sell shares or other investments. Do your own research before buying or selling any investment or seek professional financial advice.


Bi-Weekly Market Commentary | 15/10/2024 | CAV, WYN, TET | Small cap AXX divergence
A look at what might be causing the divergence in performance between the FTSE Small Cap (SMX) index -8%, which has outperformed FTSE AIM (AXX) -44% since Sept 2021. Companies covered CAV, WYN and TET.
The FTSE 100 was down -0.75% to 8,244 last week. The Nasdaq100 and S&P500 were both up just over +1%. Oddly there was a peculiar divergence in Asia. FTSE China 50 and the Hang Seng were down sharply: -8% and the worst-performing major indices while the other Chinese indices: the CSI 300 Index (Shanghai) and SSE Composite (Shanghai) were the best-performing +4% over the last 5 days. I think the conclusion to draw is that international investors believe the benefit of the Chinese stimulus will not reach Hong Kong, or even the largest stocks listed in the FTSE China 50. Japan’s Nikkei 225, the third best-performing index rose +2.5% and followed the two local Shanghai indices higher, while the VIX rose to above 20.
Hat tip to Sharepad user Cockney Rebel, who points out on his Substack that a divergence closer to home: the FTSE Small Cap (SMX) index has outperformed FTSE AIM (AXX) since the beginning of the sell-off. It makes little sense that the two UK indices focused on the smaller end of the market have diverged so much, with AXX down -44% versus the FTSE Small Cap -8% since Sept 2021.
For comparison, Vanguard’s Global Small Cap index tracker (VIGSCA) is up +6% over the same time period.
The recent speculation about the government changing inheritance tax or CGT rules hasn’t helped, but most of the AXX underperformance pre-dates that news. I have a couple of theories: i) the flow of money into passive index trackers has helped the FTSE index more than AIM ii) the FTSE consists of more professionally managed money and AIM is more of a private investors’ market. While many people, including myself, have been focused on the outflows that professional fund managers have seen, perhaps there’s been an even more significant trend of UK self-directed investors having a go at investing during the pandemic, and then losing heart selling AIM stocks into a declining market?
The two explanations are not mutually exclusive, both suggest that attempting to reinvigorate London’s financial markets by weakening investor protection rules would backfire. Naturally, investors want to invest in exciting growth companies, the next Keyword Studios or Judges Scientific; unfortunately AIM’s lower standards have been exploited by some, which has led to disappointing returns. In October we could see more downward pressure on AXX due to concerns about the Budget, but the longer-term divergence versus the other UK small cap index or Vanguard’s global index makes little sense to me.
Speaking of disappointments, a brief mention of RBGP, the litigation finance company, which has delivered another profit warning. I last wrote up the company in August last year, when I suggested that the investment case was high risk and we could be confident that the share price wouldn’t be 20p in two years’ time. The shares have been down another 90% since then. At the time I suggested FinnCap/Cenkos – now renamed Cavendish, could be a better way to benefit from improving capital market conditions.
Hence, this week I look at broker Cavendish’s positive trading update, also Wynnstay’s profit warning and Treatt’s reassuring FY Sept update, when their H2 weighting did materialise with +16% revenue growth H2 v H2 last year.
Cavendish H1 Sept trading update
Many readers will be familiar with stockbroking firms and NOMAD to many AIM stocks, which makes its research freely available to private investors. It’s been a difficult few years, and the company merged with Cenkos in September last year, pro-forma revenues FY Mar 2024 were £54m. Management said last week that they expect to be profitable for H1 to September, on revenues of £27.5m. That compares to an FY March loss of £4.3m and another loss of £6.3m the prior year.
Outlook: There are no forecasts in the market, I wouldn’t put much weight on forecasts in this sector anyway, as the timing of IPO’s seems inherently hard to predict. Management also highlight well-publicised uncertainty around the upcoming Budget. Although they were profitable in H1, there’s no comment on H2, except to say that the pipeline is “solid”. I’m not sure that’s the correct image management wish to convey, surely we would prefer a fast-flowing pipeline? Their guidance suggests an image in my mind that the contents of their pipeline resembles a fatberg under London.
Brokers v fund managers: Last week we saw 5 active UK fund managers report Jun-Sept outflows. There’s obviously a symbiotic relationship between brokers, who benefit from trading commissions paid by fund managers and who also need fund managers to buy into their IPOs. If active fund managers are still seeing mid-teens annualised outflows, I’m sceptical about brokers’ IPO pipeline.
I’ve sorted the list by market cap but also highlighted Impax, which has been the worst performer, down -29% YTD as investors have continued to be sceptical about ESG investing. This is the one fund manager I own.
The old rule of thumb was that active fund managers should trade on 4% of Assets under Management (AuM). The table below reveals that heuristic no longer applies as the fund managers, like brokers, are also struggling to deal with the growth in popularity of low-cost passive funds. The new 4% of AuM has shrunk to a range of 0.55% to 1.4% – with Polar Capital the outlier on 2.1% AuM. Most active fund managers are seeing outflows of mid-teens percentage when annualised; that is taking the most recent quarterly number and multiplying by 4x. The table below shows that Impax and Polar Capital trade at a premium, due to their specialist nature whereas Jupiter and Miton trade at a discount.
Interestingly there’s nothing to suggest that scale leads to any premium, both Schroders and Arbdn with over £0.5 trillion AuM are trading on less than 0.8% AuM. Blackrock, with over $11.5 trillion AuM trades on 1.2% AuM. Over the quarter, the US behemoth saw $160bn in long-term flows, while an additional $61bn flowed into its cash management products like ICS Sterling Government Liquidity Fund, which charges 10bp to track Sterling Overnight (SONIA).
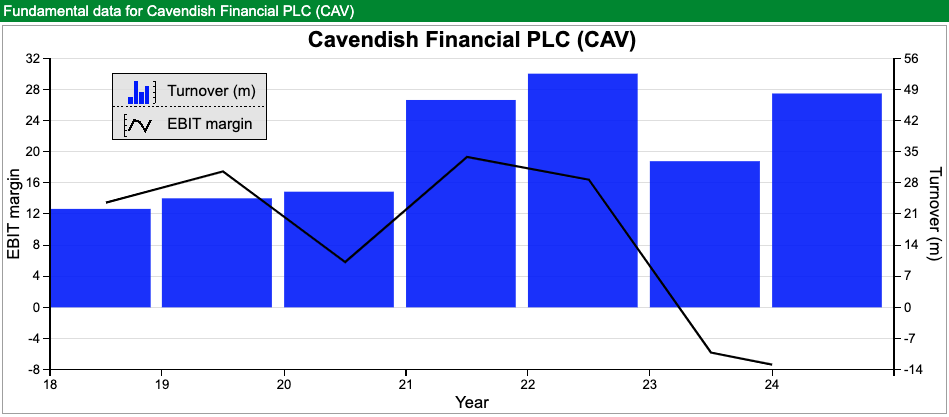
Valuation: Cavendish had £17m of cash at the end of September, just over half of the firm’s £32m market cap. In good years this company can report a RoCE of almost 30% and an EBIT margin of just under 20%. Assuming £60m of revenues would imply £12m of PBT is achievable – implying the current valuation is less than 4x “peak” earnings. Assuming a normalised EBIT margin of 10% would imply 1.3p EPS per share or a PER current valuation of 8x normalised earnings.
Opinion: Cavendish seems a well-managed company in a difficult sector. The investment case could make sense if you are feeling upbeat about the prospects for AIM in 2025, with the cash providing downside protection. One thought I had was if we look 5 years into the future, Cavendish’s decision to make equity research available to retail investors might create more value than other brokers who have focused on serving professional fund managers, who are seeing outflows and are a melting ice cube.
I haven’t bought any CAV myself, in part because I think that this isn’t just a cyclical downturn. There’s a structural shift towards passive investing and low-cost active ETFs, which is hurting both stockbrokers and active fund managers. I thought that Impax, with its long track record of environmental investing, should be insulated from the trend towards passive, but YTD the shares have been the worst hit. I’d be more likely to average down into Impax than open a new position in CAV.
Wynnstay profit warning
This agricultural supplies group with a 31 Oct year end announced that results will be “materially lower than current market expectations and lower than the previous year”. Sharepad showed FY Oct 2024F revenues were already expected to decline by -10%, but PBT was forecast to be flat. The two main areas of disappointment are: i) underperformance of the Feed division ii) falling margins at Glasson Grain, which blends fertiliser. Agricultural commodities spiked up in the first half of 2022, following Putin’s invasion of Ukraine, but since then we’ve been remarkably lucky that they have declined alongside the natural gas price, which is also down c. 70% from its peak that year. Interestingly the shares were only off -6% on the day of the warning, perhaps reflecting that management had already warned that conditions were difficult, but also because of the better outlook for livestock and dairy in FY Oct 2025F and the 20-year dividend history.
There’s no net cash figure mentioned in the RNS, but it was £18.5m or a quarter of the market cap at the end of April. The FY dividend was £3.9m, so that it would be easily affordable for management to pay an uncovered dividend this year and even next year.
History: The group was founded more than 100 years ago as a farmer’s co-operative in Llansfechain, Wales. Over the decades the business gradually bought hard assets like mills, storage and other plant-growing feed, fertiliser and merchanting businesses. It currently has 12 manufacturing sites and 53 depots, predominately in the West of England and Wales.
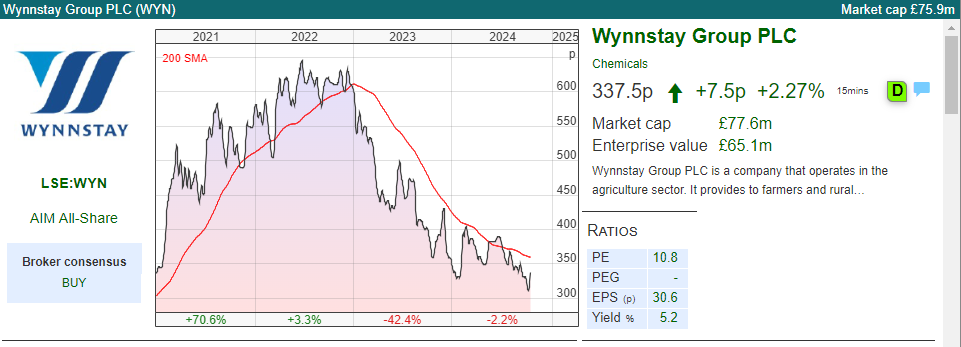
It only became a plc in 1992, and listed on OFEX in 1995 before switching to AIM in 2004. Sharepad shows that the company has enjoyed good topline growth, growing sales from less than £90m in FY Oct 2002 to over £700m, but has always struggled to generate a margin. The long-term price chart shows that while this is not a “buy and forget” stock, investors can make some big gains if they can get their timing right. For instance, the shares 4 bagged after the financial crisis and 3 bagged following the pandemic.
Valuation: The shares are trading on 13x PER Oct 2025F, so not obviously cheap in this market. But I think investors are correct to anticipate a recovery next year and the share price chart looks to be forming a bowl. The dividend yield is 5.5%, so even if the shares don’t recover there should be good yield support.
Opinion: Some exposure to the agricultural sector and rising food prices could be a good idea at the moment. Personally, I’ve done this by owning MP Evans, the Indonesian palm oil company. Timing is hard, the outlook may disappoint again. However, the company appears well run, the conservative balance sheet means that the dividend yield of 5.5% is well supported. I have no position, but at this point in the cycle, I would rather be a buyer of this stock than a seller.
Treatt FY Sept Trading Update
This manufacturer of food extracts and flavourings has had a rough couple of years, but published an “inline” trading update for FY Sept 2024F. Theoretically, TET should have been defensive in an inflationary environment, as management suggested that branded drinks were “affordable luxuries”. Below is an explanation of the company’s product categories.
In reality, the gross margin has been hit, falling to 28% at the H1 stage versus a 34% peak FY Sept 2021. That was caused by the price of raw materials increasing while the group lacked pricing power to pass on this cost to customers. Revenue growth has held up well at TET, growing at +9% CAGR since Sept 2020, so in some ways, it’s a similar story to Fevertree, which also saw +10% CAGR in revenue but suffered margin pressure from higher input costs.
Last week TET said FY Sept 2024F revenue will be £155m, up +5%. That may sound unexciting, but H1 revenue was down -5%, implying an H2 acceleration to +16%. So, fortunately, their H2 weighting has come through. The company expects to report PBT before exceptionals of £18.8m, up +9% versus last year. Net debt has come in better than expectations, at less than £1m versus £22m two years ago.
Valuation: The shares are trading on 18x Sept 2025F, dropping to 16x the following year. Similar to WYN, the chart looks to have found support around these levels. Unlike WYN the dividend yield is less than 2%, though I would prefer TET’s long-term track record of less cyclical profitability (below) than WYN. Notice TET’s EBIT margin tends to be around 10%, whereas WYN’s struggles to rise above low single digits.
Opinion: I wrote about the shares in 2022, suggesting scepticism towards management’s explanation of what was going wrong. Management teams will often try to convince investors that the problems are temporary, for instance, a short-term currency movement, rather than long term or difficult-to-fix (eg. lack of pricing power) problem. Fast forward to 2024, and that’s been the case for TET, which has seen their margin mean revert back down towards their pre-2020 long-term average. The share price is also down by two-thirds from its 1280p peak at the end of 2021. On a high-to-mid-teens PER ratio, the shares are not obviously cheap, but the long-term track record is impressive and if the gross margin improves I would imagine that there could be scope to beat expectations in the coming years.
Notes
Bruce owns shares in Impax AM
brucepackard.com
Got some thoughts on this week’s commentary from Bruce? Share these in the SharePad “Weekly Market Commentary” chat. Login to SharePad – click on the chat icon in the top right – select or search for “Weekly Market Commentary” chat.
This article is for educational purposes only. It is not a recommendation to buy or sell shares or other investments. Do your own research before buying or selling any investment or seek professional financial advice.