In this month’s funds article, David Stevenson goes bubble hunting, asking whether we should worry more about deflation than inflation, and go full-on contrarian, digging into Chinese technology ETFs.

Is there an earnings Bubble?
Be under no illusions; what we’re seeing at the moment in the equity markets is no bubble, in the classic sense of illusory profits. Corporate earnings are booming. Profits as a share of total GDP (versus labour) are at all-time highs and rising, while the AI boom is feeding through into huge economic shifts.
And that’s true globally, as Deutsche Bank analysts confirm. In a report from earlier on in August, they note that earnings beats are running extremely strong globally across a variety of metrics, with record breadth in the US and Japan. Global earnings growth accelerated from an already exceptional 26% in Q1 to 39% in Q2, driven by broad-based strength across regions and sectors, with positive earnings growth in every sector. The surge reflects simultaneous tailwinds from AI-driven Tech demand, rebounding PMIs, and higher oil and commodity prices, which drove strong sales growth and record-high margins.
Deutsche reports that earnings growth accelerated sharply across all regions, with the US, Japan, and EM posting exceptional growth and Europe posting its strongest growth in nearly four years. While AI-driven Tech remained the key driver in the US, growth also broadened notably, with positive growth in all sectors and increasing contributions from outside Tech. Japan and EM growth also continued to be boosted by AI demand, while Europe benefited from a rebound in Energy & Materials. Earnings in all four regions have broken above their post-pandemic trends, highlighting the strength of the current earnings cycle.
“Consensus earnings estimates have been revised sharply higher globally this year, with the largest upgrades in EM, particularly Asia ex-China, where AI-driven demand for Korea and Taiwan continues to fuel significant earnings momentum. The consensus sees very strong growth across regions in 2026, led by Asia ex-China, alongside robust growth in Japan and the US driven by the Tech boom and in Latam and EMEA by higher commodity prices. While earnings growth is projected to moderate in 2027, the consensus still looks for double-digit growth across most major regions.”
So, what’s the concern here? Maybe we’re in an earnings bubble, with corporates getting away with raising prices while cutting costs and boosting profits. That’s feeding into surging global earnings-per-share growth. Yet consumers worldwide remain annoyed and strapped for cash. Political pressure is rising to do something about affordability, and there’s always the possibility that the whole AI bandwagon might hit a big speed bump very soon. At that point, will we realize in hindsight that this was peak earnings? An earnings bubble that was crushed by populists, bond investors (see below), Japan, and an AI slowdown?
Inflation vs Deflation
Lurking beneath most debates about macro and its impact markets is the inflation vs deflation debate. On the one side, the inflationistas’ case is obvious and hard to ridicule. The Iran war, in all its glorious ineptitude, has put a fire under energy and commodity prices, and there’s a decent chance this will push up rates in the next 12 months. Allied to this is a considerable body of opinion that the US economy is running hot, that food prices are rising, and that US government spending – frankly, nearly all G7 government spending – is too high. Lurking beneath this contemporary narrative is a deeper argument that questions whether an ageing society is condemned to face inflationary pressures, eloquently made by Charles Goodhart and Manoj Pradhan in their book The Great Demographic Reversal. Add deglobalisation, tariff wars, and the breakup of the old hyper-liberal world order, which are pushing up prices and stopping cheap Chinese imports, and you have the makings of an inflationary squall that could see inflation rates stay above 3%, or even 4%, for years.
This narrative is certainly influential amongst all types of investors. It influences central bank decision-making, which in turn influences interest rate policy, which in turn impacts equity market investors who fear rate hikes.
Ranged against the inflationistas are the deflationaries, arguably led by Fed Chair Kevin Warsh. There’s a strong technological bent to this argument, with AI supposedly unleashing powerful deflationary pressures, not least by making a whole swathe of G7 workers unemployable (white collar ones especially). In this camp there’s also the ageing society thinkers who take the opposite view to Goodhart and Pradhan, i.e an ageing society is inherently deflationary as Japan shows (until recently). More practically there’s also a more ‘half glass empty’ crew of bond investors who worry that the AI bubble will burst, sparking a monstrous slowdown which will drag down economic growth, crush inflation and make a lot of big data centre owners very poor indeed.
In this camp you’ll find plenty of tech investors and those like Ed Yardeni of Yardeni Research who’ve been arguing for years that we are midway through a Roaring Twenties decade.
I’m simplifying this debate. There’s plenty of colour and nuance on both sides, but the outline matters hugely. They affect rates and risk. If you believe the higher-for-longer inflationistas, you’ll be fearful of bonds and eager to buy inflation protection. If you believe the technology-inspired deflationaries, the Roaring Twenties could turn into the Roaring Thirties. By contrast, if you worry about an AI deflationary crash, you’ll be seeking illiquid safe havens. I have no idea which side of this debate is right, though I think the market consensus leans towards the inflationistas and underestimates the deflationaries’ argument. Whoever is right or wrong, the outcome really, really matters for all our portfolios.
China Technology Funds

I’m the first one to admit that I have ambivalent feelings about China Tech specifically and China generally. On the bearish side, I think there are some obvious worries about corporate governance in a country run by avowed Communists. In terms of markets, this translates into the whole Made in China agenda—a brazen example of global mercantilism! The government is obviously stoking up its local tech hardware sector – and pushing money to its favoured businesses. What could possibly go wrong with such a monumental industrial policy?
On the flip side, in a more positive light, I find it hard to ignore China’s technological advances and think they have a smart strategy for both AI and chips. Whether it will be profitable is debatable, but they shouldn’t be underestimated. More to the point, there are some fantastic Chinese tech giants that run impressive business machines generating huge profits – notably Alibaba, as reported this week, and Tencent, both of which I own in small amounts. Valuations for Chinese tech firms are very low compared with US peers, and more than a few contrarian investors I follow reckon Chinese technology is a decent hedge against US tech mania. I’m not entirely convinced by that contrarian narrative, but I don’t think it’s idiotic either – I simply think investors should do their homework and think through their options.
In that spirit, I thought I’d focus a short note this week on the handful of Chinese technology funds you can buy as ETFs. I have no fixed opinion on any of these five indices and their accompanying ETFs—each has its virtues. But they all represent a cost-effective way to buy broad exposure to a particular theme, in this case, Chinese technology.
China Tech ETFs
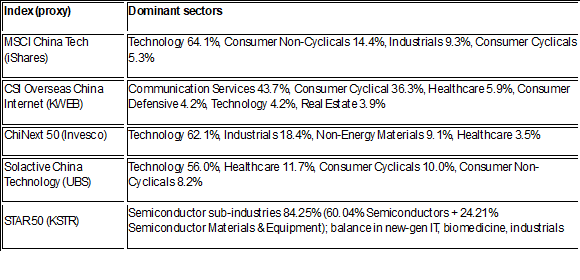
The five indices – and accompanying ETFs – split into two families: offshore consumer-internet/platform exposure (CSI Overseas China Internet, tracked by KWEB; and, more diluted, MSCI China Tech and Solactive China Technology) versus onshore mainland hard-tech exposure (STAR 50 and ChiNext 50). The STAR 50, for instance, is overwhelmingly a semiconductor bet: 84.25% of the index sits in chip sub-industries (60.04% “Semiconductors” plus 24.21% “Semiconductor Materials & Equipment”), whereas KWEB is almost purely internet/e-commerce with negligible chip exposure.
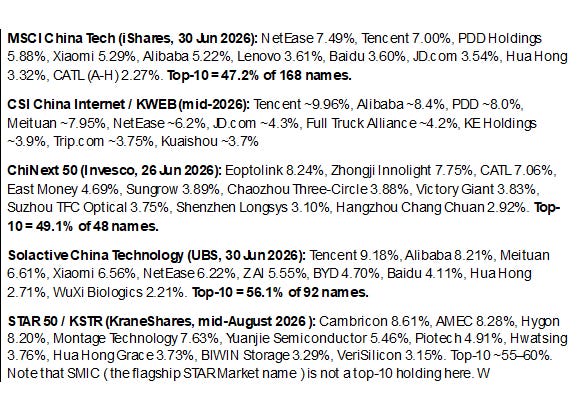
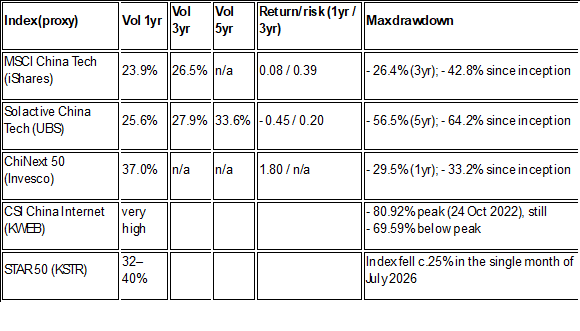
Over the period 2021–2025, all five indices and ETFs struggled before partially recovering; the mainland A-share indices (STAR 50, ChiNext 50) experienced the most violent swings. STAR 50/KSTR is the most volatile (annualized volatility roughly 32–40%) and among the most concentrated (top 10 c55–60%), while KWEB suffered the biggest historical losses—an 80% drawdown as of 24 October 2022.
For a UK-based investor, all five are accessible via LSE-listed UCITS ETFs, but fees and scale differ sharply: iShares MSCI China Tech (CTCE, 0.45%) is the cheapest and by far the largest; KraneShares STAR 50 (KSTR, 0.82%) is the priciest and smallest.
Despite the shared “China tech” label, these are not very alike! They differ in listing venue (offshore Hong Kong/US versus onshore A-shares), sector tilt (internet platforms versus semiconductors versus new-energy/optical), breadth (roughly 34 to 168 constituents), and concentration. An investor who holds KWEB and KSTR together, for example, holds two largely distinct China exposures: offshore consumer internet vs onshore semiconductors.
Index methodology and UK-listed ETFs
MSCI China Technology Index. The iShares ETF tracks this specific screened/capped variant, drawn from the MSCI China Index parent and confined to selected GICS technology sub-industries, with certain Broadline Retail names admitted only if they derive 50% or more of revenue from catalogue/mail-order (i.e., e-commerce) segments. It captures large and mid-caps across A-shares, H-shares, B-shares, Red chips, P chips, and foreign listings (ADRs), applies MSCI’s capping methodology, and excludes low-ESG and controversial-business names. UK vehicle: iShares MSCI China Tech UCITS ETF – LSE ticker CTCE (GBP), also CTEC (USD, Euronext Amsterdam/SIX), Xetra CBUK; TER 0.45%; physical full replication; accumulating; 168 holdings; fund size c. €1.9bn on justETF.
CSI Overseas China Internet Index (H11137). Designed to measure China-based companies whose primary business is internet or internet-related, listed OUTSIDE mainland China (Hong Kong, NASDAQ, NYSE). A “China-based company” must be incorporated in mainland China, headquartered there, or derive at least 50% of its revenue there. The provider removes names with an average daily trading value of less than roughly $3m or an average market cap of less than roughly $2bn. UK vehicle: KraneShares CSI China Internet UCITS ETF – LSE ticker KWEB (USD), with EUR- and GBP-hedged share classes added on the LSE in 2026; TER 0.75% (UCITS); physical; c.34 holdings. (The older US-listed KWEB charges 0.69%.)
ChiNext 50 (the ETF tracks the “ChiNext 50 Capped Index”). The 50 largest and most liquid stocks on the ChiNext board (Shenzhen’s growth/innovation segment) are all mainland A-shares, free-float market-cap weighted with a cap and reviewed semi-annually (May and November). It deliberately sidesteps real estate, energy, utilities, and traditional consumer sectors, concentrating around 90% in technology, industrials, healthcare, and financials. UK vehicle: Invesco ChiNext 50 UCITS ETF – LSE tickers CHNX (GBX) and CN50 (USD), Xetra CNFY; TER 0.49%; physical full replication; accumulating; launched 17 June 2024, with circa 48–50 holdings; fund size c. €207m (justETF, July 2026). It is the only ETF tracking this index.
Solactive China Technology Index. Free-float market-cap weighted with a 10% single-name cap, tracking the 100 largest technology-driven Chinese companies deriving the majority of revenue from innovative activities (cloud computing, medical technology, future mobility, digital entertainment). Its “new economy” reach is broader than pure information and communications technology, i.e it includes EV, biotech, and robotics names. UK vehicle: UBS Solactive China Technology UCITS ETF – LSE tickers CHTE (GBX) and CHTU (USD), Xetra UIC2, SIX CQQQ; TER 0.47%; physical; accumulating; launched 5 March 2021; c.92 holdings; fund size c. €223m. It is the only ETF tracking the index.
SSE Science and Technology Innovation Board 50 Index (STAR 50, code 000688). The 50 largest, most liquid securities on Shanghai’s STAR Market (mainland A-shares plus red-chip depositary receipts and different-voting-right companies), selected by excluding the bottom 10% by trading value and then taking the top 50 by average total market cap. Free-float market-cap weighted, single-name cap 10%, top-five cap 40%. It is dominated by semiconductors – 84.25% of the index by KraneShares/Bloomberg’s classification as of 30 June 2026 alongside new-generation IT and biomedicine. UK vehicle: KraneShares ICBCCS (rebranded “ICBCUBS”) SSE STAR Market 50 Index UCITS ETF – LSE ticker KSTR (USD), ISIN IE00BKPJY434; TER 0.82%; physical; accumulating; listed on the LSE 26 May 2021; ICBC Credit Suisse Asset Management as sub-adviser. It is the smallest and priciest of the UK-listed group.
Year-by-year performance

Sector composition
STAR 50 is 84.25% semiconductors, while KWEB has almost no chip exposure and is dominated by internet/e-commerce platforms classed as Communication Services and Consumer Cyclical. MSCI China Tech and Solactive sit in between: both are internet-heavy at the top but carry meaningful hardware, healthcare, and (for Solactive) EV weightings.
Top 10 holdings for each Index
Risk and return measures
Some thoughts and observations?
- For diversified “China tech” core exposure, iShares MSCI China Tech (CTCE) seems the most ‘mainstream and ‘diversified’: it’s the cheapest (0.45%), largest and most liquid, broadest (168 names), blending internet platforms with hardware and some new energy stocks under ESG screens.
- For a pure offshore internet/consumer bet, KWEB. That said, investors might want to consider switching out of this ETF if Beijing resumes aggressive platform regulation, which triggered the 2021–22 collapse.
- For a concentrated semiconductor/hard-tech bet, KSTR (STAR 50): highest fee (0.82%), smallest, most volatile, 84.25% chips.
- For an onshore new-energy/optical/industrial-tech tilt without the megacap internet names, ChiNext 50 (CN50, 0.49%) is an option, but remember it has a very short track record (launched June 2024) and 37% one-year volatility.
- UBS Solactive (CHTE) looks to be a reasonable “new economy” middle ground (internet + healthcare + EV) at a TER of 0.47%, but its long-run record is the weakest of the group. Treat it as a diversified-tech alternative to iShares.
David Stevenson
Twitter: @advinvestor
This article is for educational purposes only. It is not a recommendation to buy or sell shares or other investments. Do your own research before buying or selling any investment or seek professional financial advice.