
In this article, Michael looks at things to look for before buying stocks in order to check up on potential red flags.

Before buying any stock, it’s important to do some quick checks to stop you from buying a complete crock. Depending on the type of trade will depend how deep you go.
For example, an intraday trade that I am buying/shorting based on news, I’ll be looking at the news, how the stock reacted in the last update, how that update compares to what could have been expected, and probably not care about the financials in huge detail apart from if they are potentially going to move the price (for example, a breach in debt covenants or it being obvious the company is running on fumes for cash).
If it’s a significant trend trade, or a Trade 2 Hold (T2H), then the research will be more thorough.
Here’s a list of things you should consider checking before buying a stock (or even shorting!).
Stage 4 downtrends
Stage 4 downtrends are the thieves of private investor capital. They lure people in, only for people to get trapped, and end up holding far longer than they should.
Unless you wake up one morning and are Blackrock and need the liquidity on downtrends to do your buying, then there is no excuse for a trader to be buying stocks on the way down.
Investing is a different business. Investors are buying a business based on the fundamentals, which can become cheaper, thus making the stock attractive. I’m not going to say that averaging down and buying stage 4 downtrends doesn’t work for investors – the truth is I’m not an investor so it’s not something I can speak with conviction on.
But as someone with almost ten years of experience trading UK stocks, I can say with conviction that buying stage 4 downtrends (again, as a trader) is a one-way ticket to No Gains Valley.
Don’t even be tempted. Just avoid them.
And if you’re not sure what a stage 4 downtrend is, here is an example.
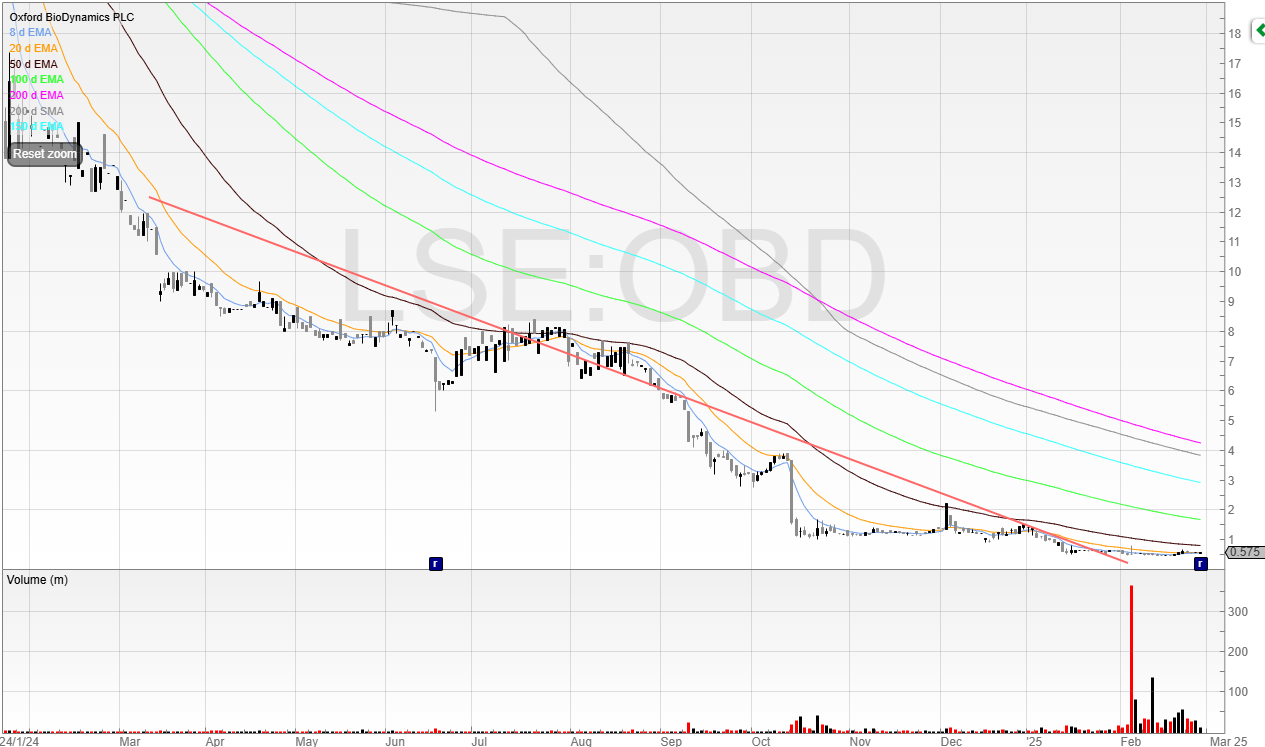
Any stock where you can draw a line of best fit that falls from left to right is a stage 4 downtrend. Declining prices and negative momentum are hallmarks of stage 4 stocks.
Some warning signs to watch out for:
- Moving averages trending down (especially longer term)
- Stock trading below moving averages
- Higher volume on down days
- Lower highs and failure to break into new highs
- Constant selling and lack of interest
Often profit warnings and stage 3 stocks are pre-cursors to stage 4 downtrends.
Here’s an article I wrote for ShareScope detailing the four stages of a stock.
Despite it being nearly six years old, it doesn’t make it any less relevant.
Engaging with such stocks often leads to further depreciation, as downward trends can persist longer than anticipated. It’s crucial to recognise the stock’s current phase and avoid those in a pronounced decline.
Weak balance sheets
Despite companies paying thousands of pounds per month for PR agencies as well as additional fees for brokers, you’d think that many companies would receive better advice and not leave raising capital until the last minute.
Well, you’d be wrong, and many companies only bother to raise capital when the coffers are almost fully drained.
The best time to raise capital is when you don’t need it, as you’re coming from a position of strength. But either terrible advice or misplaced optimism (or both?) often lead to a company believing that in a few months the share price will be higher, and they can raise at a higher level.
This is often not the case, as deadlines are missed and the share price slips.
And when you know a company needs the capital, investors and those putting up the capital can play hard ball.
Always check the balance sheet for cash and then look at the cash flow statement too.
One thing you can do is to take the company’s operating cash flow and then divide this by the amount of months in the results (six for interims, 12 for full year) and then work this back against the cash balance.
This will give you a rough idea of the company’s cash position, and sometimes can be used to short the stock and cover in a placing. I’ve covered avoiding dogs and shorting stocks in this way in detail here in my video for how I research UK stock to swing trade for a living.
Check the forecasts
Checking the future forecasts of the company is always useful to see what is factored in.
If earnings are set to grow a paltry 5% and yet the stock is trading on a PE of 40 – what’s left for me?
You can do this by going to Financials > Forecasts on ShareScope.
Here’s an example for Me Group International.
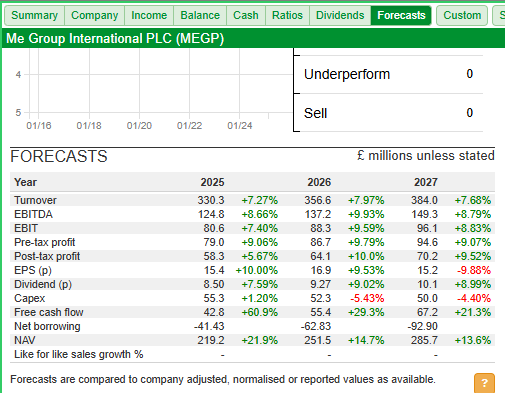
You can then see the company’s PE in Financials > Ratios. Or you can add this into the blue screen as a column.

Check the RNSs
Checking the recent RNSs will help you develop the story of the stock and the narrative driving the price.
For example, has there been a recent upgrade? Is the stock trading in line at a punchy valuation? Has there been significant director buying or a fund selling down?
Doing this would’ve avoided you getting suckered into Card Factory when it was clear that Teleios were selling into any strength.
This can be seen on the chart marked by arrows. Card Factory would put out good news and Teleios would take advantage of the liquidity and dump the shares.
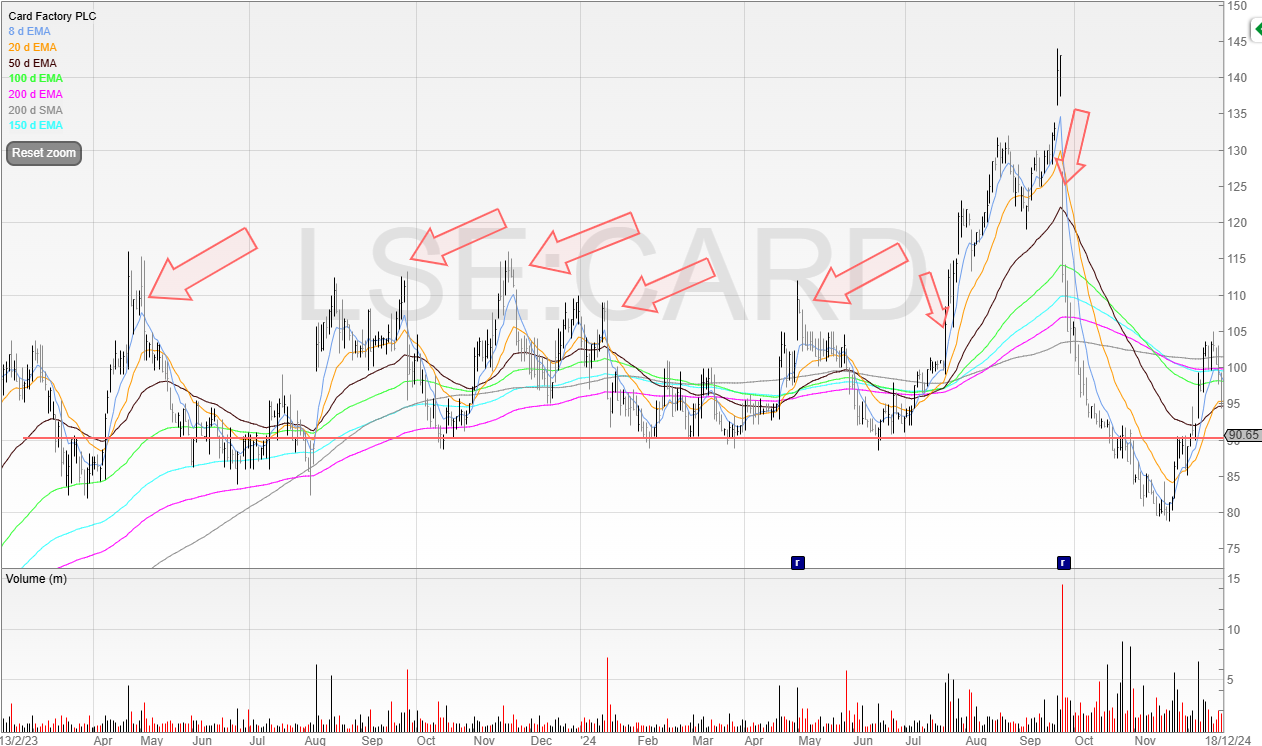
This went on for 18 months and could’ve been avoided by understanding why the price moved.
To do this, you have to look at moves, reverse engineer them, and make a note.
Trading is one big game of pattern recognition.
Conclusion
Technical analysis is of primary importance for traders. But those who ignore fundamental analysis are missing out on useful information.
If you can use both to gain an advantage – why wouldn’t you?
A trader has to use all the tools at their disposal rather than choosing a camp and staying in it.
~
Michael Taylor
Get Michael’s trade ideas: newsletter.buythebullmarket.com
Twitter: @shiftingshares
Got some thoughts on this week’s article from Michael? Share these in the SharePad chat. Login to SharePad – click on the chat icon in the top right – select or search for a specific share or the “Traders chat”
This article is for educational purposes only. It is not a recommendation to buy or sell shares or other investments. Do your own research before buying or selling any investment or seek professional financial advice.


