
Michael breaks down the breakout including why and how to play this trading pattern.
For those who have followed my articles then it’ll come as no surprise that I love trading breakouts.
Why?
Simply put: trading breakouts is a powerful strategy for capturing significant price movements in stocks. When a stock’s price moves above a defined resistance level with increased volume, it signals a breakout. This movement often indicates strong demand and can lead to substantial profits if timed correctly.
Obviously, not every single breakout yields a profit. No strategy in the market does (unless you’re an Instagram trader). Breakouts are particularly effective in a bull market because rising market sentiment provides a favourable backdrop for these stocks to gain momentum and continue their upward trajectory. In short, you’re going with the trend. And as the old saying goes, the trend is your friend.
There are two reasons why I find breakouts an optimum strategy in bull markets.
Firstly, it’s a strong signal of momentum. Breakouts show in the price action that there is significant buying interest, pushing the stock to new highs. This momentum can be sustained as new buyers enter the market.
Secondly, for a stock to break out it needs to take out a clear psychological barrier.
When a stock breaks through a resistance level, it often clears psychological barriers for traders, leading to fewer sellers and more buyers. This creates the momentum we want to ride.
This resistance level provides a clear entry point, which reduces ambiguity and guesswork involved in placing trades.
I like breakouts from clearly defined resistance points, where the stock has hit a resistance level several times. This means the resistance is more significant, and should the price break out of this then the price is clearly telling us there could be a significant move.
I also use the closing levels as the breakout level. I once heard a trader say “Amateurs open the market, pros close it”. It sounded cool but also makes sense, as the close is the price everyone is willing to hold their positions overnight into the next session.
How to find breakouts
Finding potential breakouts involves a mix of technical analysis and market awareness. Here’s a step-by-step approach:
- Identify resistance levels
Look for stocks that are approaching significant resistance levels. These levels are typically previous highs where the stock has faced selling pressure.
You can do this by using my filters on SharePad. Search “Michael” to see all of my available filters on the SharePad library.
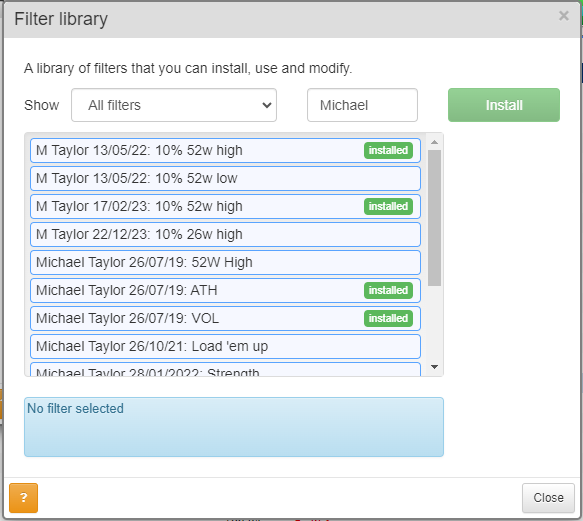
You can use the 10% within 52-week high filter to get stocks within 10% of their respective 52-week highs.
Whilst the 10% within 26-week high will yield more results, the 26 weeks are often not as significant as the 52-week highs. So it’s your choice between which filters to use.
2. Volume trends
If a stock is in a stage 2 uptrend then ideally, we want stronger volume on up days than down days. This shows accumulation in the stock. High volume indicates strong interest and increases the likelihood of a successful breakout although often we can only see this at the end of the day’s trading once the breakout has occurred.
3. Monitor consolidation patterns
Stocks often consolidate in a tight range before breaking out. This consolidation can be identified by decreasing volatility and volume.
We want volatility after the breakout. We don’t want the stock to run up sharply into resistance and give traders a chance to use us as liquidity for their profits.
Tight base breakouts are preferred. See Intercede here as an example (I am long).
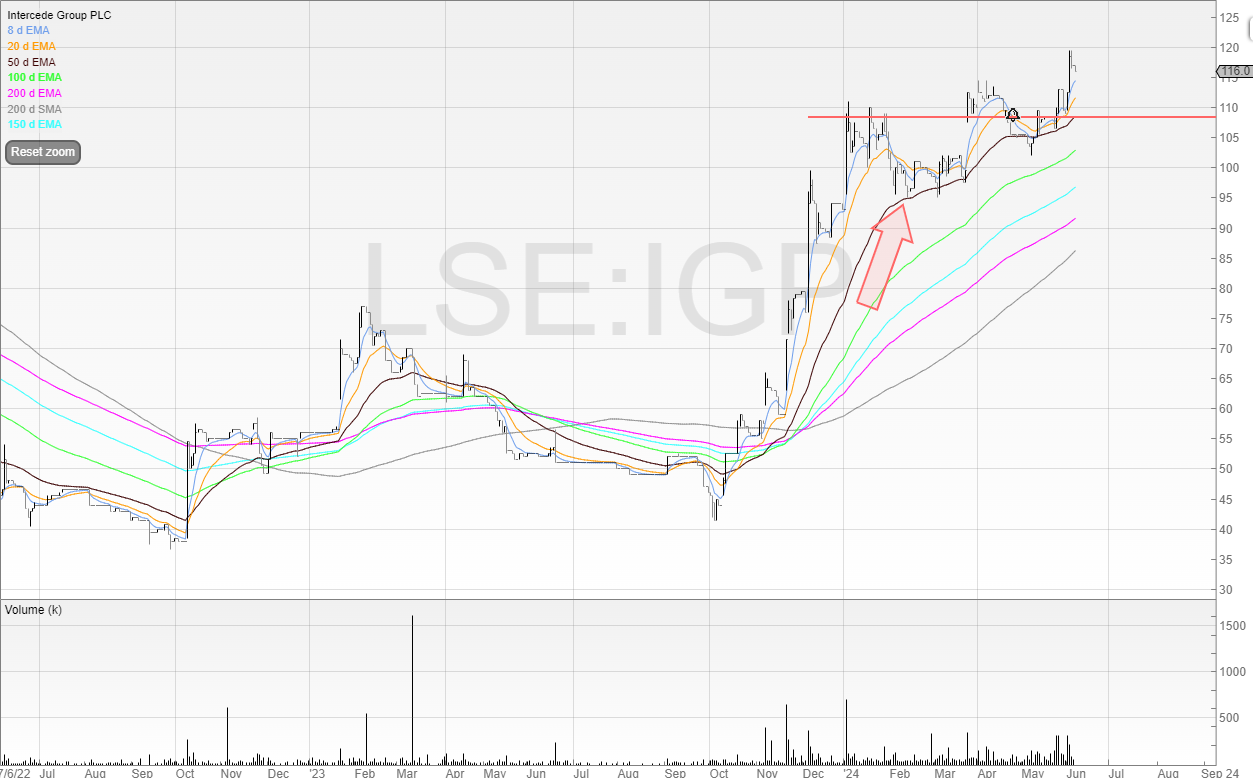
The reason we want periods of low volatility and tight trading ranges is because these are like coiled springs ready to release. This consolidation phase often precedes a breakout, making it an ideal setup for traders.
The risks and rewards of breakouts.
Breakouts come with their own set of risks and rewards:
We know successful breakouts can lead to significant gains as the stock moves quickly to new highs.
We can even average up on new breakouts in the trend and use our paper profits to finance higher risk.
By entering at the breakout point and setting stop losses below the recent range outside of stop loss liquidity, we can optimise the risk-reward level.
There is some free training I’ve created on stop-loss liquidity and breakouts here.
But like with any trading pattern, there are risks.
Sometimes, a stock may move above the resistance level temporarily before reversing back down. This can lead to losses if not managed properly. We call these false breakouts, or fakeouts!
Breakouts can be accompanied by high volatility – especially if the price has seen significant price appreciation coming into the resistance level. This can result in rapid price swings and potential losses.
And in bearish markets, breakouts are far less reliable because of the overall market sentiment, which can weigh heavily on individual stock performance.
Conclusion
Trading breakouts in a bull market can be a highly profitable strategy when executed with discipline and proper risk management.
By identifying key resistance levels, monitoring volume patterns, and waiting for clear confirmation, traders can capitalise on the strong momentum that breakouts offer.
However, it is crucial to be aware of the risks, such as false breakouts and increased volatility, and to manage these risks with well-placed stop losses and a sound trading plan.
In summary, breakouts leverage the power of market psychology and momentum to provide clear entry points and the potential for significant gains, making them a favoured strategy for many traders in bullish conditions.
Breakouts are my bread and butter in bull markets – and I hope you use them with success too.
Michael Taylor
Buy The Bull Market free and premium trading newsletter available at: newsletter.buythebullmarket.com
Twitter: @shiftingshares
Got some thoughts on this week’s article from Michael? Share these in the SharePad chat. Login to SharePad – click on the chat icon in the top right – select or search for a specific share or the “Traders chat”

This article is for educational purposes only. It is not a recommendation to buy or sell shares or other investments. Do your own research before buying or selling any investment or seek professional financial advice.


