
Breakaway gaps, otherwise known as pro gaps, can signify a major change in sentiment and the start of a new primary trend. In this article I will show you how to find pro gaps and more importantly show you some money management tactics to help you get on board a potential new trend in a risk managed way.

A quick introduction to different types of gaps
A gap occurs when a stock opens at a different price to where it closed. Up or down. This can be caused by several things; most will be insignificant to the longer-term investor. It might gap up a couple of percent on an earnings report or read across from another stock in the same business sector that has had strong earnings. It might have been tipped in a magazine or newspaper. These smaller gaps are not going to trigger a game changing shift in sentiment long term, though might be of interest to the more active trader.
Meaningful gaps worth studying
There are three types of gaps that will be of a higher calibre to the smaller day-to-day gaps caused by stock tips and earnings chatter. I’ve listed both popular names for each type of gap below.
- Breakaway Gaps (Pro Gaps) – Found at the start of a new trend as price gaps out of a range.
- Continuation Gaps (runaway gaps) – Found during the continuation of the trend.
- Exhaustion Gaps (reversal gaps) – Found at the end of the trend.
The Three Main Gap Types can be found on the chart of META from 2022-23
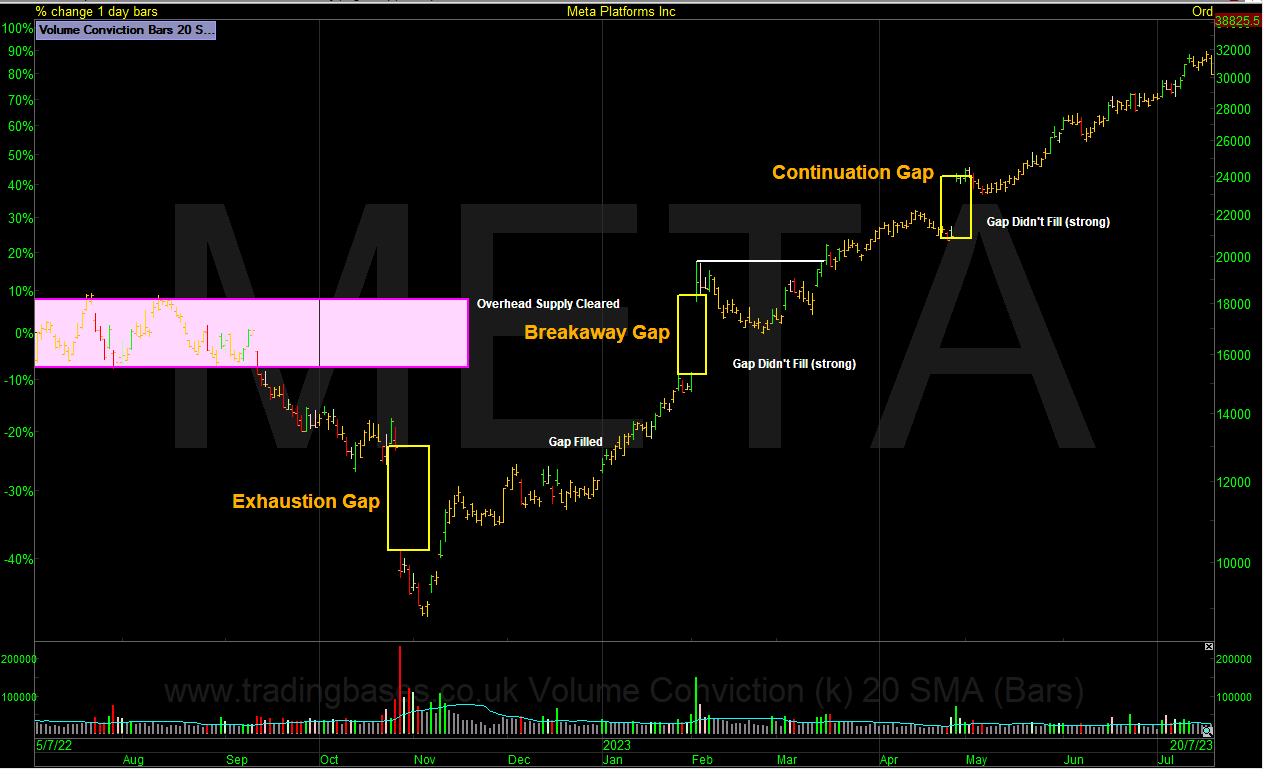
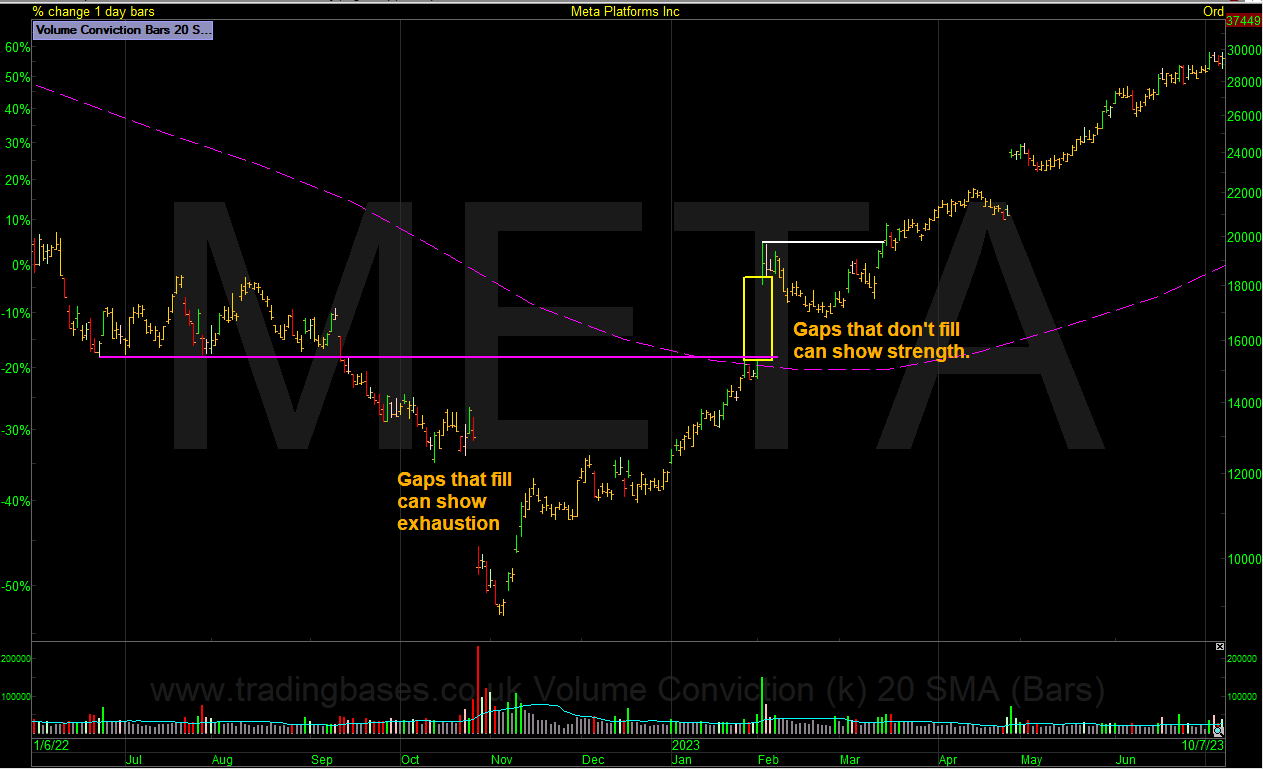
The chart above shows the three main gap types using the period from 2022-23 of META (formally Facebook) and I’ve highlighted in white text where the exhaustion gap filled and where the breakaway and continuation gaps didn’t fill. For an exhaustion gap to be confirmed firstly the gap must fill and secondly the previous trend must end. This does not mean the prior bear trend has turned into a confirmed bull trend yet as the price action could simply trade sideways in a range for an extended period following an exhaustion gap. Next, we have the breakaway gap where META gaps up 20% and clears the prior range thus Breaking away. The key to a strong breakaway gap is simply that the gap doesn’t fill. The same goes for the continuation gap. A gap up of 15% to a higher high and the gap doesn’t fill. To fill means simply to pullback to the pre gap closing price. The strongest gaps won’t fill. All the gaps mentioned will be meaningful in percent move and volume traded on the day and it’s only in hindsight that we can say this was an exhaustion gap, this was a strong breakaway or continuation gap. At the right-hand edge where we do business, we don’t have the benefit of hindsight. Some gaps will fill and then continue in the direction of the gap but the key to being in the strong ones is not to rely on the gap fill first but accept it might happen anyway. This is done through position sizing and will be covered later in the article.
To fill or not to fill? Exhaustion gaps will fill, strong breakaway gaps won’t fill
How Do We Find Pro Gaps?
This is the easy bit. Pro caps will all be found on the biggest winners or biggest losers of the day and will be the stock that’s making the headlines.
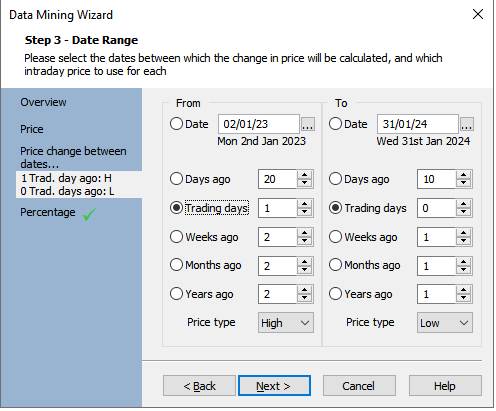
How do we screen for gaps In ShareScope Data Mining?
Add Criterion, Price, Price change between dates (copy settings below), Percentage, Finish and then set the slider to chosen gap size. Try 5% as a minimum.
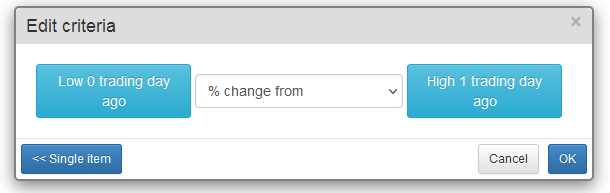
How do we screen for gaps In SharePad?
In SharePad apply a filter and add price “high on date” then hit the combine items button and add price “low on date” to create. Set High to 1 and Low to 0.
How Common are Pro Gaps?
Pro gaps are not that common so must be considered another tool in the strategy playbook. You would starve to death if you were going to focus on pro gaps alone, but the key is to know exactly how to approach them when a stock you want to own gaps out of its range in a big way on game changing news.
Make sure it’s something you want to own
Consider you’re holding time when planning the trade. If you’re a short-term swing trader on the secondary trend you will want to wait for a nimble entry that has a good risk to reward. If on the other hand you’re an investor who wants to get onboard a potential primary trend that will last a minimum of a year or more, then timing won’t be so critical.
Examples of Gaps to Study
META (FaceBook) 2013-14 examples:

The gap up in 2012 failed to break out of the prior range and the gap filled over the next few weeks before reversing higher. Note the post gap pull back managed to stay above the prior low which is a key area to hold. 2013 we get a true pro gap where price gaps cleanly out of the prior range on huge volume. The rest is history.
TSLA (Tesla) 2013 example:
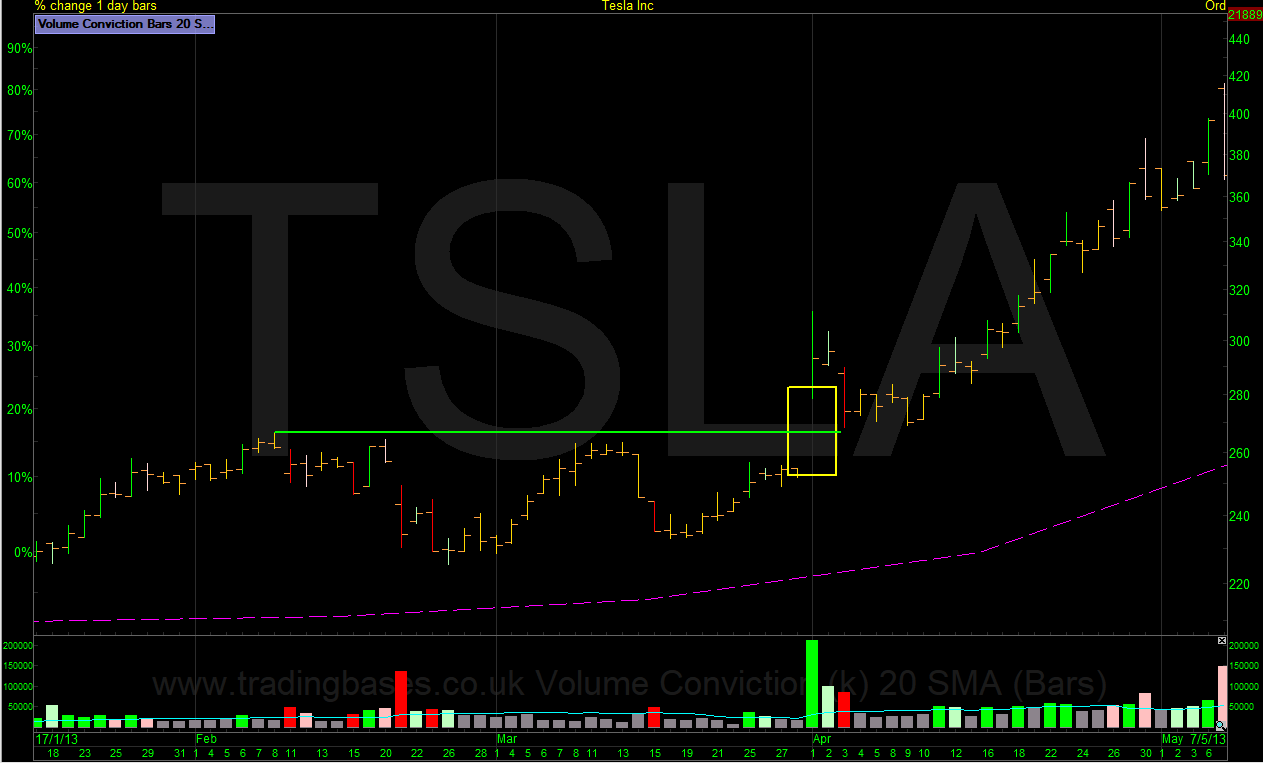
In 2012 Tesla gapped up over 10% out of a potential stage-1 base on huge volume. A clean breakaway gap. Over the following few sessions price pulled back into the baseline before reversing higher. The gap didn’t fill, and the strong action continued as Tesla trended 400% higher in the coming months in orderly fashion.
TSLA (Tesla) 2019 example:
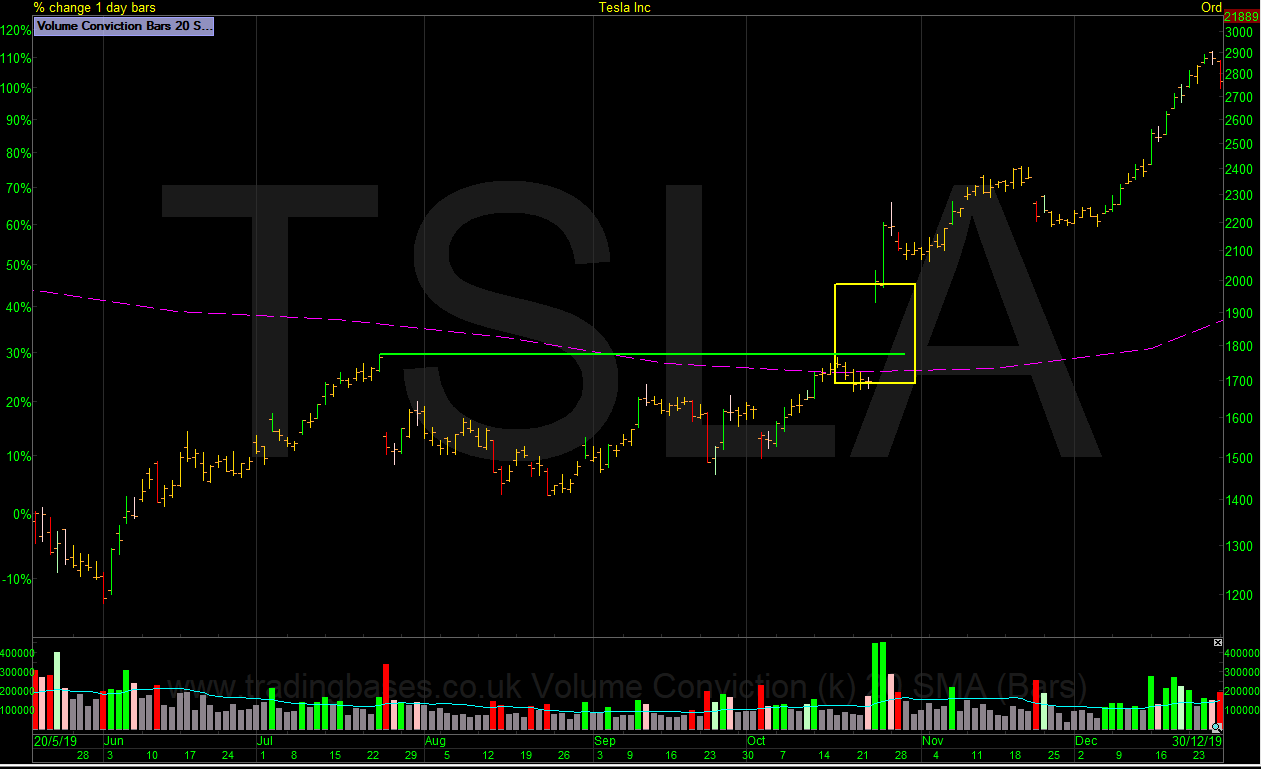
In 2019 Tesla gapped up about 16% out of a potential stage 1 base on huge volume. The very next day it went higher still before running out of steam. Over the following 5 or so trading days it pulled back in orderly fashion before taking off again. The breakaway gap turned out to be the first rung of a primary trend ladder that went up about 2000%.
NVDA (NVIDIA) Example from 2004:
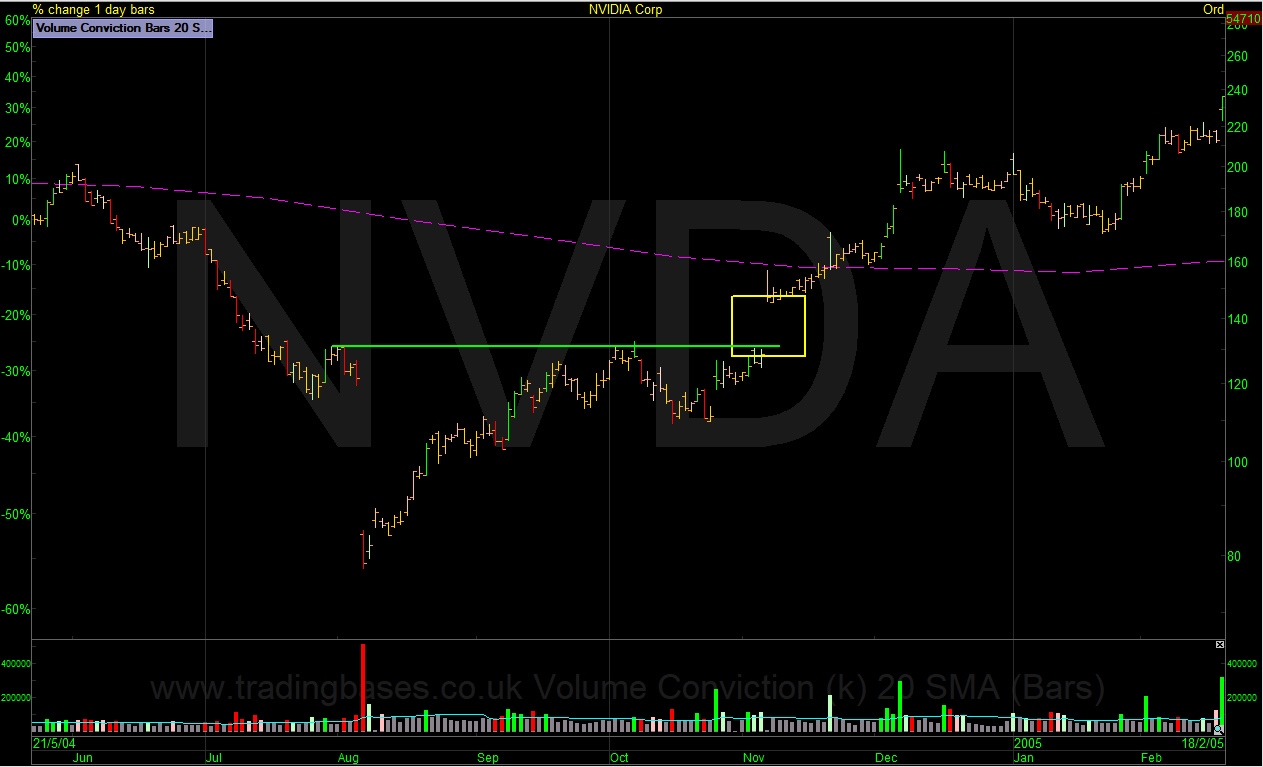
In 2004 NVDA gapped down about 30% and over the following weeks the gap filled giving the telltale sign that this could have been an exhaustion gap. Over the coming months NVIDIA formed a potential stage 1 base before gapping +14% higher out of the range. A clean breakaway gap was followed by a +500% primary trend.
Mechanics of the breakaway gap
We need to look at the entry and exit rules that will get us onboard the potential new primary trend in a pre-planned way by defining the bracket. Where we get long and where we are wrong.
The bracket is the entry minus the exit. This is crucial to risk management. If you don’t know where you are wrong, you don’t know how much is at risk. Chances are if the gap up agrees with your fundamental beliefs you are going to back that belief with a heavier weighting due to the pound signs dangling in front of the eyes. The next thing you know is you’re considering averaging down as your research is good but the pullback in price that followed is obviously wrong. If a stock pulls back deeper than its normal price action you are probably wrong anyway. If you spend 5 minutes studying where you are wrong for your own timeframe before buying, it can solve all your weighting and timing problems instantly. Everyone has an exit. The wise investor can position size for the exit. Consider this. You’re going to get punched on the nose. You can either decide how hard you would like to be punched or you can close your eyes and hope. But trust me the markets like to hurt people so I’m going to size for a soft hit. With that in mind lets run through the mechanics of adding risk management to price action for the worst-case scenario being a soft hit.
TSLA bracket 25-10-2019 with entry price in green and exit in purple:
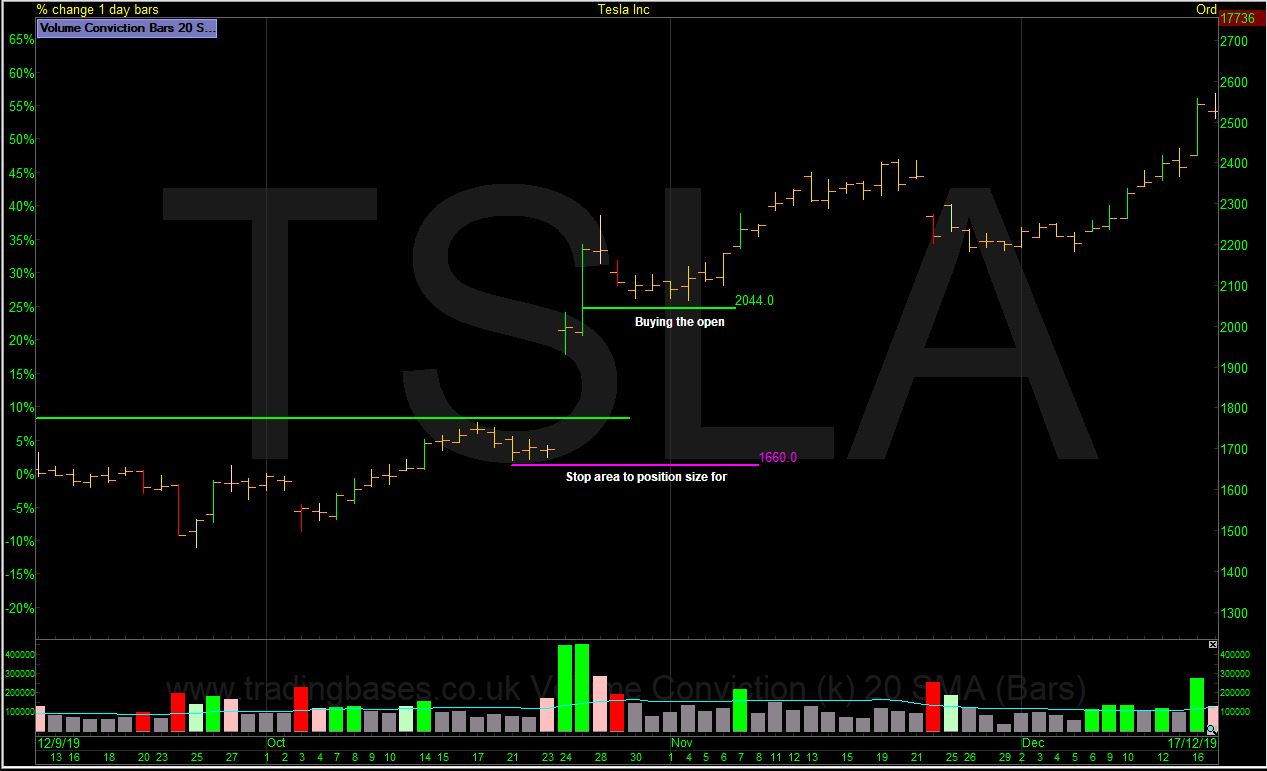
The stop loss price used for position sizing should be placed where price should not visit even if the gap fills. Placing it below the last pullback low makes sense to me. If there is no pullback low near the gap fill, then a weekly or monthly low is a sensible option. It’s at this point where most people will tell me that my stop loss is obvious, and everyone will know where it is. That is very true but that is also where the market shouldn’t trade if I am right and gives me the reward to risk that will compound the account meaningfully when I catch a trend.
Position Sizing for the Bracket
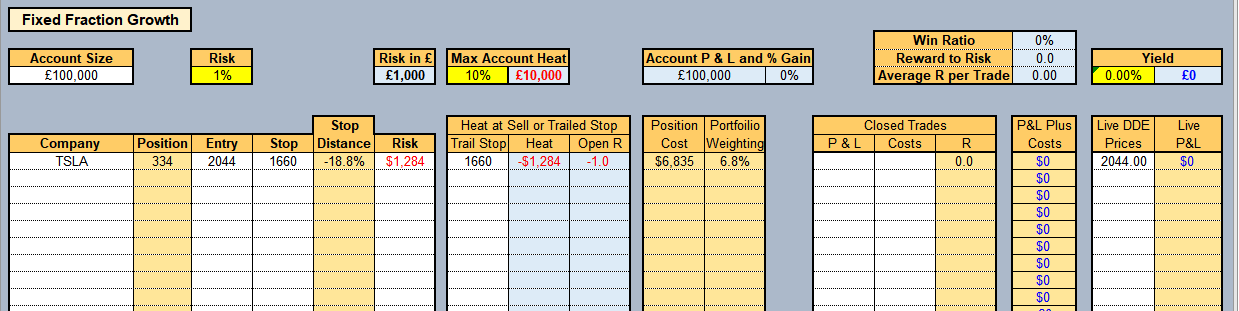
Using the trade management sheet available to members at my site I’ve loaded the Tesla bracket. I’ve used a generic £100,000 account and chosen a fixed fractional risk of 1%. This means I am risking 1% of my closed balance on every trade. I’ve converted the £1000 risk into dollars for TSLA ($1284) and the calculation says to risk $1284 at my stop price if wrong I should buy 334 shares of TSLA.
The Calculation is ((Risk / Bracket) x 100) = Shares.
Three Scenario’s. A Loser – The Available Move – Trailing a 100d Low Stop Loss
A loser is the cost of doing business and a soft hit of 1% of account has been sized for. This risk is personal to the individual. I’ve used 1% out of £100k for easier understanding.
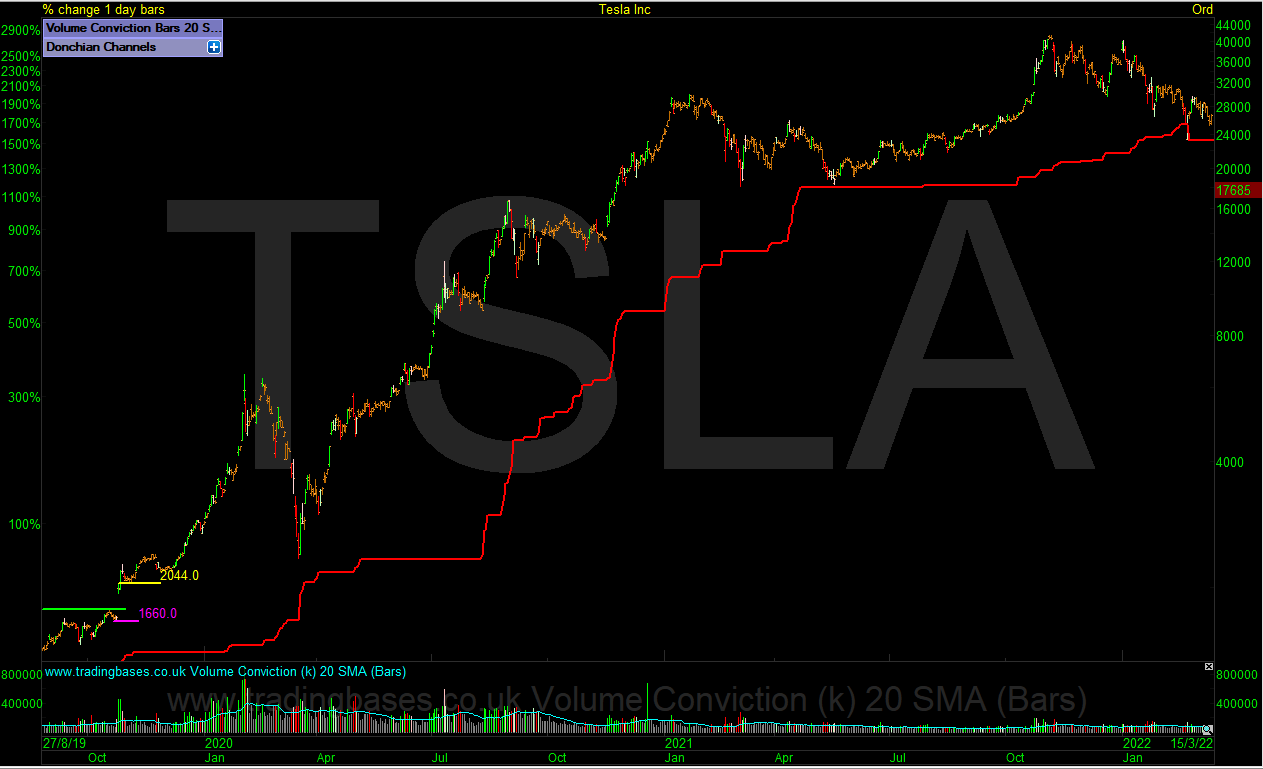
The available move is measured to the high before the trailing stop is triggered. This TSLA move had a huge available move of 102.6 times the initial risk. Percentage is not important.
The 100d low trailing stop captured 61.1 times the initial risk.
TSLA Primary Trend with the 100d Low Trailing Stop added:
NVDA – The Scenic Route:
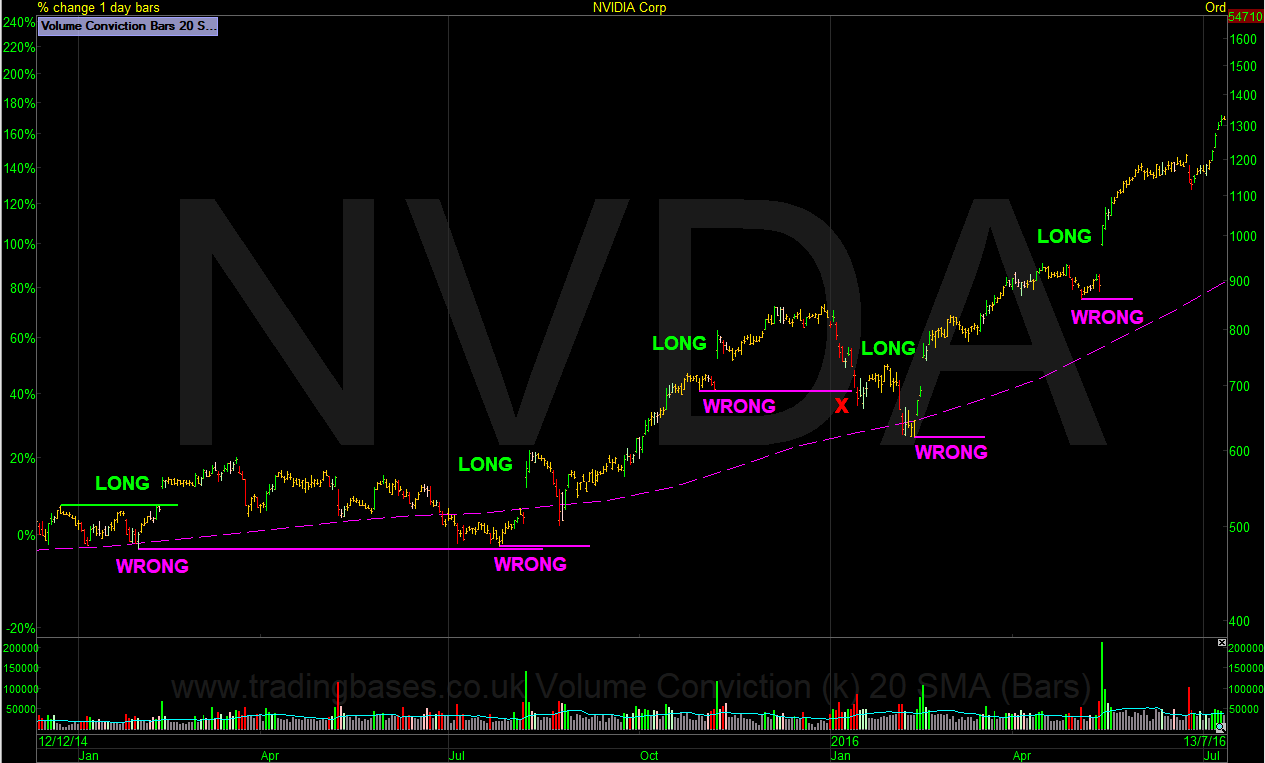
The chart of NVDA above shows the reality of longer-term investing. 4 out of 5 signals got you onboard the trend. The failed signal was a potential continuation gap. A trailing stop would have kept you in from the first and second signals, but the price action of those early signals deserves the scenic route title I give to the less orderly emerging trends. This is food for thought regarding my earlier comment, make sure it’s something you want to own as they don’t all trend smoothly.
TSLA – The Swing Trader (days to weeks):
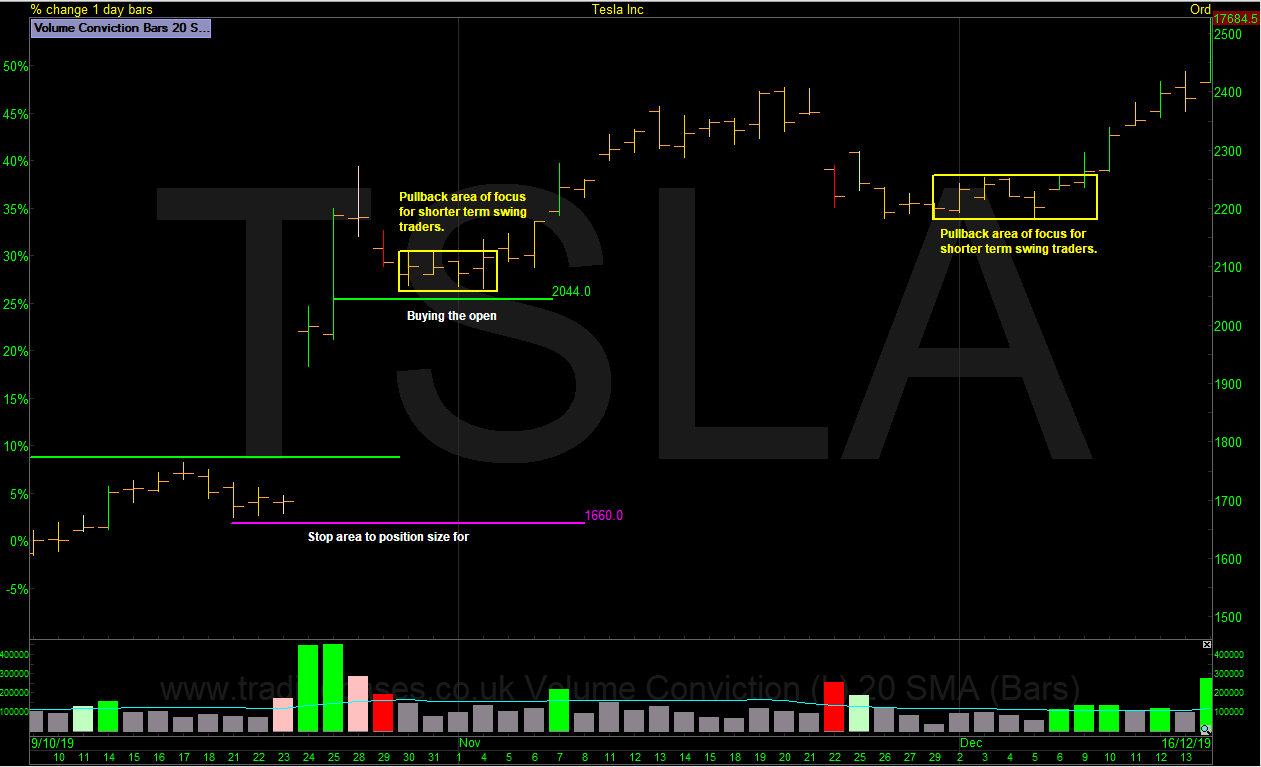
Returning to the TSLA example, this is how I would tackle the same breakaway gap from a secondary trend swing trade perspective. I would be waiting for a pullback entry to key off giving a tight wrong area. This will increase whipsaws and be sized differently to a primary trend position trade.
Final Note
What I have shared here is what I look for in potential emerging trends, how I choose a robust stop area and how I position size for this setup. My risk tolerance is personal to me. I also give an example of a trailing stop. This should be used as pointer for further research into the world of systematic investing and not as a stand-alone trading system. I would prescribe at least 100 hours of intense research and back testing to really get to know your gaps.
Jason Needham
@stealthsurf
www.youtube.com/@TradingBases
This article is for educational purposes only. It is not a recommendation to buy or sell shares or other investments. Do your own research before buying or selling any investment or seek professional financial advice.


