
Richard uses the results of his Five strikes scoring system to go in search of high-quality sectors. It is leading him to challenge long-held beliefs about what makes a good long-term investment.

Scoring companies, when they publish annual reports, means that over the course of a year, I will have conducted a survey of a large slug of the market: Specifically the SharePad list of UK-listed shares excluding investment trusts (but only those that have earned positive cash flow over the last three years).
Because the first months of my survey have coincided with the Spring reporting season, we already have a large sample of companies, 533 out of a total of 1,463 companies listed in the UK have reported, so perhaps we can zoom out a bit and take a look at what kind of business my endeavours are uncovering.
To recap, by giving each company a “strike” if I find something in the numbers that is potentially negative, I am discovering a pool of investments that make good candidates for a portfolio of buy-and-hold shares.
A company earns a strike if it is domiciled abroad, the directors are not invested meaningfully in the business, it listed in recent years, has spent more on acquisitions than it has earned in cash, profitability in terms of Return on Capital Employed (ROCE) or Cash Return on Capital Invested (CROCI) has been weak, debt is high, turnover has fallen in real terms, or the company has raised substantial sums from shareholders.
I consider many years of data using a custom table (One custom table to rule them all) and at five strikes I stop counting, which is why the system is called Five Strikes and You’re Out. It is the companies that deserve less than three strikes that are most interesting.
The companies that score 3 and 4 are relegated to a slush pile.
Beholden to our early successes
My first reaction to the data was surprise. I expected to find lots of companies like the ones I already own because I found them, albeit less systematically, by looking for similar qualities.
By and large, these are companies that manufacture and/or distribute a wide variety of physical things: drones, kitchens, packaging, model soldiers, lighting, nuclear containment vessels, tableware, components for industrial equipment, vehicle trackers, smart watches, flavours for soft drinks, animal feed additives, promotional tat, polymers, and books – to give you just a taste of my portfolio today!
The few companies that provide a service, provide a tangible one, holidays, for example, or at least a service as a product, like software.
There may be a deep psychological reason this portfolio is so one-sided.
Apparently, we make sense of things by creating templates. The first time we see a car, we might liken it to a box on wheels. When we see more boxes on wheels, we will refine our decision to exclude very large boxes on wheels, boxes that carry people, rather than goods. Very soon we have our template for a car. Once it sticks, a car is a car, and we do not question it. This means we can move on and learn new things, and it is why first impressions are so important*.
Maybe what we consider to be a good investment depends to a large extent on our early experiences of investing. Physical goods are tangible, we can appreciate them by looking at them (or pictures of them), touching them and tasting them.
The idea that you can add value to materials or components by combining them into products and distributing them efficiently is readily understood and so is the notion that if a company does this in a special way, it has unique know-how, then it should profit.
Manufacturing companies and distributors are great businesses to cut our analytical teeth on because they are readily understandable and there are many of them. They can also be excellent long-term investments.
But the economy has become more service-oriented over the decades, and those of us still using our original template for what makes a good investment may be missing out.
I am blinkered, not just by my predilection for the physical world but biases against service companies. Much of the value added by companies that provide a service may be in the minds of employees and it is difficult to put faith in a business when the intellectual property is not institutionalised, and it walks out of the door at the end of every day.
Five Strikes and You’re Out is making me confront these prejudices. It is finding lots of service industries, like mortgage brokers, franchises, estate agents, law firms and recruitment companies. They have performed quite well, for quite some time.
Best sectors: preliminary results
To get a feel for these businesses, we can identify which sectors of the stock market have the highest-scoring companies in them.
SharePad categorises shares at four levels of granularity. The broadest category is industry, followed by supersector, then sector and finally subsector.
Each level pigeon-holes companies more precisely than the one before it.
I chose subsectors, the highest fidelity because that is more likely to give us an inkling about what the company actually does. At the industry level, a recruitment company is categorised as an “industrial”, which is not very helpful, while at the subsector level, it will probably be in the Business Training and Employment Agencies category, which is better.
I exported the names of the companies that had scored highly (0 to 2) along with their subsectors from SharePad, plonked them into a spreadsheet and got it to count up how many high scorers there were in each subsector.
Service businesses are scoring highly, and not necessarily the ones you would think:
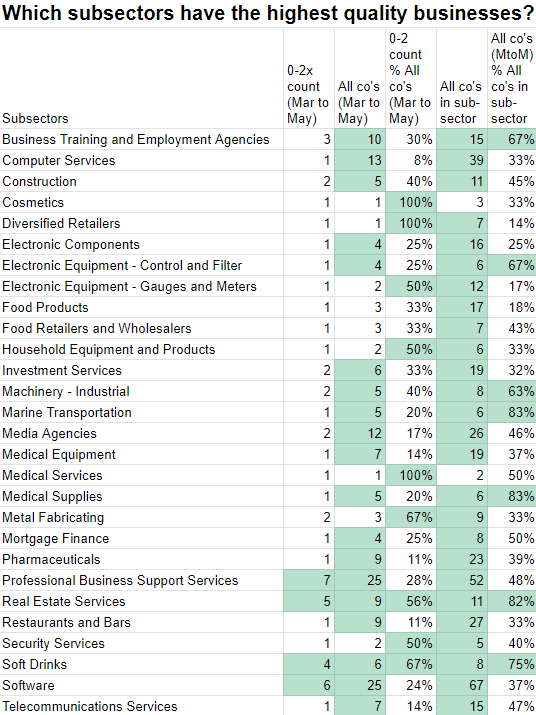
Data source: SharePad. This spreadsheet shows my working out.
53 of the 533 companies that reported in the period scored between 0, 1 or 2 and they were distributed between 29 subsectors. You can see how many of the high-scoring shares were in each subsector in the second column. Unhelpfully, the category with the highest number of highest-scoring shares was the Professional Business Support Services subsector, which had 7. By their nature, some subsectors are clearly defined and others are catch-alls. Professional business support services is a catch-all.
The third column (All co’s Mar to May) shows the total number of businesses that reported in the period for each subsector. Once again professional business support services tops the list, along with software, with 25 businesses each.
The green highlight in these two columns applies to subsectors that have three or more high-scoring businesses in them, to help us identify those that contain a number of good businesses.
The next column is the number of high-scoring companies as a percentage of the total number that reported (0-2x count Mar to May % All co’s Mar to May). On this basis, software and professional services are less impressive subsectors.
The winning subsectors here were soft drinks and real estate services. In each of these subsectors, more than half of the companies that reported in the period scored between 0 and 2. The only other subsectors to achieve this feat (also highlighted in green) contained less than 3 high-scoring businesses.
If we are looking for businesses in subsectors that readily make money, we should perhaps be looking at soft drinks and real estate services first.
Subsectors that contain one or two high scorers, and lots of low scorers may also be telling us something. Perhaps their high scores means they are doing something really special…
High-scoring shares by subsector
|
Name |
Subsector |
AR date |
10y CROCI |
Score |
|
FDM |
Business Training and Employment Agencies |
Apr |
41.50% |
0 |
|
PageGroup |
Business Training and Employment Agencies |
Apr |
21.40% |
1 |
|
Robert Walters |
Business Training and Employment Agencies |
Apr |
14.40% |
1 |
|
Computacenter |
Computer Services |
Apr |
14.30% |
0 |
|
Morgan Sindall |
Construction |
Mar |
11.60% |
2 |
|
TClarke |
Construction |
Apr |
4.96% |
2 |
|
Warpaint London |
Cosmetics |
May |
12.90% |
1 |
|
Next |
Diversified Retailers |
Apr |
22.80% |
2 |
|
Luceco |
Electronic Components |
Mar |
10.40% |
2 |
|
Rotork |
Electronic Equipment – Control and Filter |
Mar |
15.80% |
1 |
|
Judges Scientific |
Electronic Equipment – Gauges and Meters |
Mar |
16.20% |
0 |
|
Glanbia |
Food Products |
Mar |
7.81% |
2 |
|
Greggs |
Food Retailers and Wholesalers |
Apr |
12.80% |
1 |
|
Churchill China |
Household Equipment and Products |
May |
6.64% |
1 |
|
Alpha International |
Investment Services |
Apr |
19.20% |
1 |
|
Aquis Exchange |
Investment Services |
Mar |
-8.95% |
2 |
|
Somero Enterprises Inc |
Machinery – Industrial |
Apr |
32.80% |
1 |
|
Spirax-Sarco Engineering |
Machinery – Industrial |
Apr |
10.70% |
1 |
|
Irish Continental |
Marine Transportation |
Mar |
3.56% |
2 |
|
4imprint |
Media Agencies |
Apr |
27% |
0 |
|
Next 15 |
Media Agencies |
May |
15.70% |
1 |
|
Medica |
Medical Equipment |
Apr |
12.10% |
2 |
|
Integrated Diagnostic |
Medical Services |
Apr |
14.60% |
2 |
|
Advanced Medical Solutions |
Medical Supplies |
Apr |
9.34% |
1 |
|
Bodycote |
Metal Fabricating |
Mar |
8.84% |
2 |
|
Hill & Smith |
Metal Fabricating |
Apr |
7.81% |
2 |
|
Mortgage Advice Bureau Ltd |
Mortgage Finance |
Apr |
40.70% |
0 |
|
Animalcare |
Pharmaceuticals |
May |
6.22% |
2 |
|
Christie |
Professional Business Support Services |
May |
8.20% |
0 |
|
Keystone Law |
Professional Business Support Services |
May |
23.60% |
1 |
|
Andrews Sykes |
Professional Business Support Services |
May |
19.80% |
1 |
|
Intertek |
Professional Business Support Services |
Mar |
17.50% |
1 |
|
Science |
Professional Business Support Services |
Apr |
12.20% |
1 |
|
Inchcape |
Professional Business Support Services |
Apr |
10.30% |
1 |
|
Fintel |
Professional Business Support Services |
Apr |
13.60% |
2 |
|
M Winkworth |
Real Estate Services |
Apr |
27.40% |
0 |
|
Rightmove |
Real Estate Services |
Mar |
331% |
1 |
|
Property Franchise (The) |
Real Estate Services |
Apr |
18% |
1 |
|
Belvoir |
Real Estate Services |
Apr |
13.60% |
1 |
|
LSL Property Services |
Real Estate Services |
Apr |
11.20% |
2 |
|
Domino’s Pizza |
Restaurants and Bars |
Mar |
19.80% |
1 |
|
Johnson Service |
Security Services |
Mar |
17.80% |
2 |
|
Nichols |
Soft Drinks |
Mar |
16.80% |
0 |
|
Fevertree Drinks |
Soft Drinks |
Apr |
15.30% |
0 |
|
Barr (AG) |
Soft Drinks |
Apr |
12.10% |
1 |
|
Kakuzi Ltd |
Soft Drinks |
Mar |
2.52% |
2 |
|
Aptitude Software |
Software |
Mar |
13.80% |
0 |
|
Spectra Systems Corp |
Software |
May |
11.20% |
1 |
|
Alfa Financial Software |
Software |
Mar |
29.80% |
2 |
|
Sopheon |
Software |
Mar |
10.90% |
2 |
|
Eleco |
Software |
Apr |
9.62% |
2 |
|
Learning Technologies |
Software |
Apr |
7.19% |
2 |
|
Gamma Communications |
Telecommunications Services |
Mar |
16.50% |
1 |
Source: SharePad. Columns are subsorted by score, and 10-year average Cash Return on Capital Invested (CROCI). The table only includes companies that reported between 20 March and 29 May.
The shares in incoherent subsectors and subsectors with very few constituents cannot really be analysed in this way. We can take them one by one, or zoom out a bit.
~
*Apologies for the cod-psychology. I am reading a book called Mindwandering by Moshe Bar. It is fascinating.
Contact Richard Beddard by email: richard@beddard.net or on Twitter: @RichardBeddard
Got some thoughts on this week’s article from Richard? Share these in the SharePad chat. Login to SharePad – click on the chat icon in the top right – select or search for a specific share.
This article is for educational purposes only. It is not a recommendation to buy or sell shares or other investments. Do your own research before buying or selling any investment or seek professional financial advice.


