With the ‘rescue’ of Credit Suisse over the weekend, Bruce ponders what might happen next and which indicators to focus on. Companies covered BUR and TCAP.
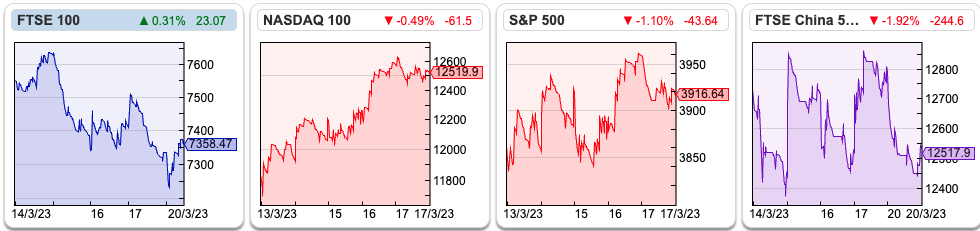
The FTSE 100 fell -2.5% to 7,358 over the last 5 days. The Nasdaq100 and S&P500 were up +1.4% and 5.8% respectively, indicating that the sell-off in markets has been largely about the financial sector, rather than companies operating in the broader economy. The US 2Y government bond yield fell sharply last week, from a peak of 4.86% at the beginning of March to 3.77%, as investors revised their view of Central Bank interest rate expectations. The price of gold rose +5% to $1,922 and oil (Brent Crude, most traded BZ-MT) fell -8% to $75 per barrel.
Over the weekend Credit Suisse was ‘rescued’ by UBS, in an all-share deal valuing CS equity at $3.25bn (CHF 3bn) or CHF0.76 per share. That’s well below Credit Suisse’s Friday closing price of CHF1.86, but better than UBS’s original offer of just CHF0.25 per share (or $1bn). The combined entity will have $1.7 trillion of total assets (UBS $1.1tn and Credit Suisse $575bn). UBS shares fell -12% to CHF 15 on Monday morning as investors digested the news.
Earlier last week the Swiss National Bank (SNB, the Central Bank) had provided Credit Suisse with CHF 50bn ($54bn) of liquidity support. But this was inadequate, and the SNB has now provided a further CHF100bn. There are many unanswered questions – for instance:
Unanswered questions:
Why did the crisis resolution mechanisms not work as they were supposed to? If this was really a bank run, with uninsured depositors removing their money, why didn’t the Central Bank provide enough support? Or if there was a solvency issue, what has UBS taken on? What were the Saudi’s (Credit Suisse’s largest shareholder) thinking when they said last week that they would not support the bank?
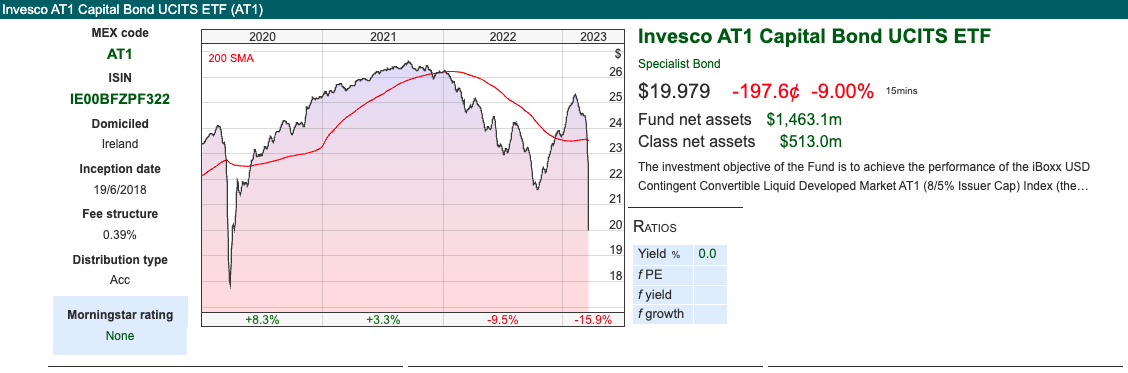
More broadly: what will be the effects of wiping out Credit Suisse’s CHF 16bn ($17bn) of Additional Tier 1 Capital? These AT1 capital holders were wiped out by the Swiss regulator, while equity investors were not; so how do bond investors price that risk in future? NB Deutsche Banks AT1 bonds were trading at 60c in the dollar on Monday, and BNP Paribas 70c on the dollar. On Sharepad we can track the Invesco AT1 Capital Bond ETF (ticker LSE:AT1). The recent sell-off looks to be of similar magnitude to the pandemic sell-off in March-April 2020.
Also, are customer deposits leaving weaker banks to find a home at stronger banks? Or is money leaving the banking system completely, and going into Money Market Funds (MMFs)? The FT reported inflows of $120bn into the latter last week, it’s hard to believe that such a large movement of money can slosh outside of the banking system without causing problems. This substacker has suggested the Fed’s Reverse Repo Facility (RRP) is worth watching for precisely that reason.
Putting those two themes together, wouldn’t it be fun if the MMFs which are currently benefiting from deposit flight from the banking system, owned the banks’ AT1 debt that is now being re-priced? What will be the regulatory response? What effect will that have on banks’ net interest margins, capital ratios and return on equity in the medium term?
Who is next?
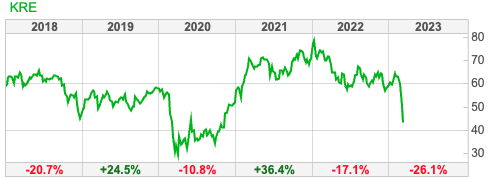
One indicator worth following is KRE, the KBW regional banks index, which was down -14% last week (or -26% YTD).
Of the US regional banks, First Republic Bank (FRC) was down -72% last week, despite a consortium of JP Morgan and 10 other banks agreeing to deposit $30bn at FRC. Charles Schwab, the US retail broker, shares recovered last week, but are still off -30% YTD. Closer to home currency trader Argentex, which I own, fell -16% in the last week, while Equals was down -9%, presumably as investors are worried about counterparty risk.
Rule of thumb:
There is an old banks’ analyst rule of thumb, that the banks that did badly in the last crisis, tend not to be the most vulnerable in the next one. Instead, it is the banks that sailed through the last crisis largely unscathed that become overconfident and are most exposed to the next crisis. This is certainly true of Credit Suisse and Silicon Valley Bank, which mostly avoided the problems of the GFC 2007-9.
On that basis, we might see problems at Japanese, Canadian, Nordic or Australian Banks. One of my favourite features of Sharepad is the ability to explore international companies and make comparisons. I have put together a ‘watch list’ of global banks and financials. I have sorted this by country, so far the Canadian banks are holding up well, but in Europe, Soc Gen and Deutsche Bank were both down -18% in the last 5 days.
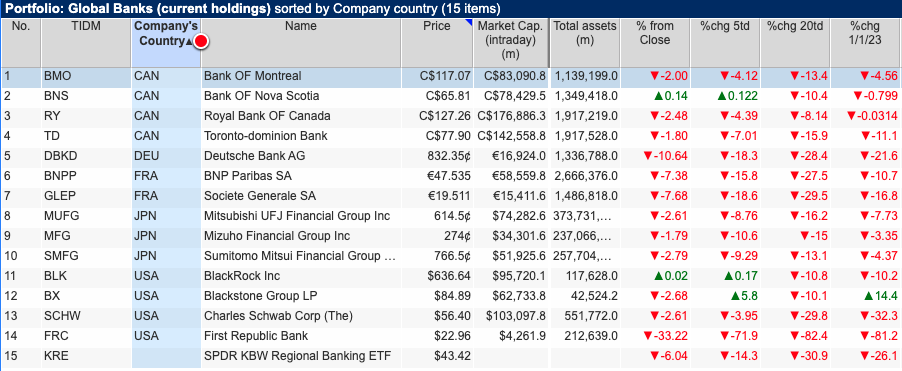
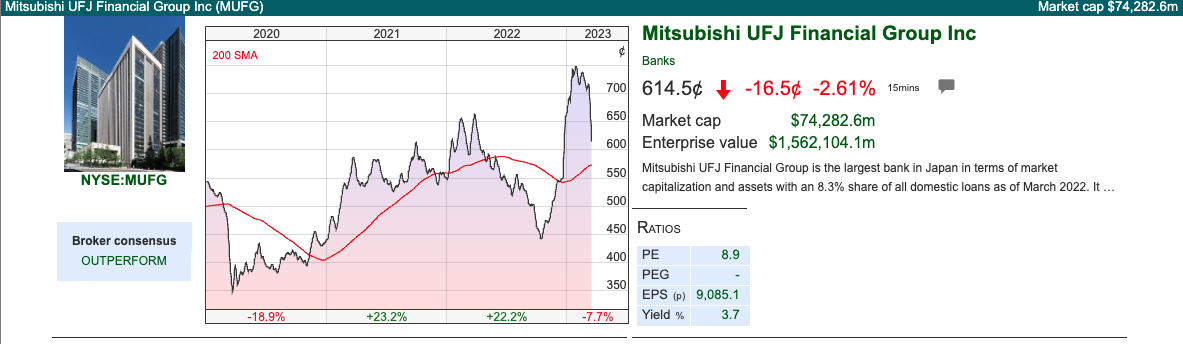
Japanese banks’ balance sheets are so large it’s hard to believe that they won’t be affected by rising interest rates or duration concerns. MUFJ has almost 400 trillion yen of assets ($3 trillion at today’s exchange rate) of which c. $1 trillion is banking loans while $640bn is investment securities.
This week I look at a couple of financials which appear cheap. Don’t worry, they are not banks! There’s significant complexity in what TCAP and Burford do, so these might not be for everyone. However, neither company has the risk of customers asking for their deposits back, so they don’t operate with the liquidity/funding risk that a bank has to. TCAP’s net debt was just £11m, although the gross exposure is higher and there’s some counterparty risk.
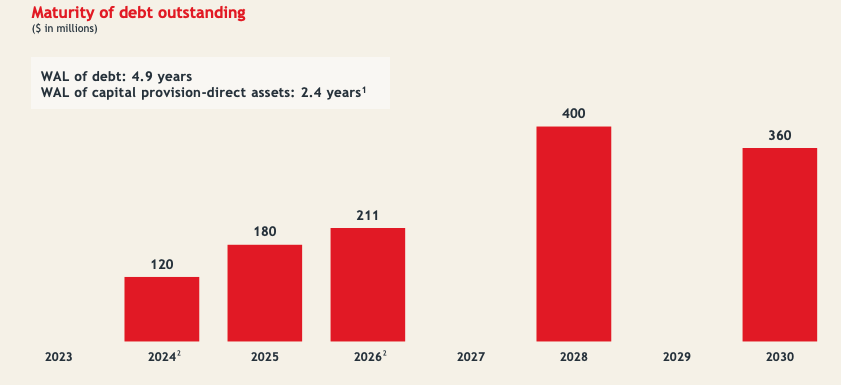
On the liability side, Burford has no bonds that mature this year, and $120m coming due in 2024 (less than 10% of the group borrowing). However, there’s considerable uncertainty on the asset side of the balance sheet (legal disputes, roughly half of which are fair value gains) that BUR carries on its balance sheet.
TP ICAP FY Dec Results
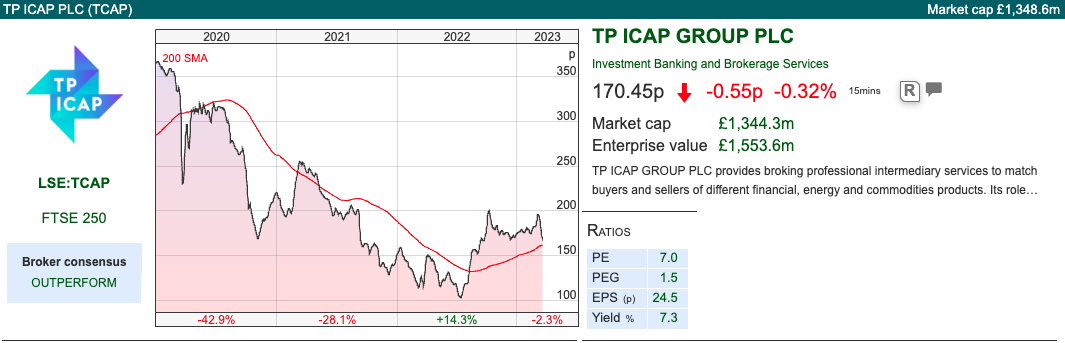
This Inter Dealer Broker (IDB) reported FY results, formed in 2016 by merging Tullett Prebon (Terry Smith) and Icap (Michael Spencer) businesses. Revenue was +7% on a constant currency basis, however much of TCAP’s revenue is earned in dollars, but sterling is the reporting currency, so reported revenue was even better, up +13% to £2.1bn. Reported PBT was up 4.5x to £113m. Adjusted PBT was £226m, the most significant items were amortisation and impairment of intangibles (£65m) and employment and general costs (£56m). The latter aren’t an exceptional item that I would adjust out, however, TP ICAP bought Liquidnet (completed March 2021) and hence there were some restructuring and redundancy costs which probably were exceptional in nature.
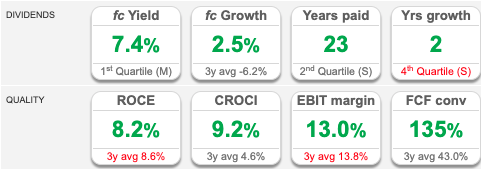
Net debt was £11m (gross cash £888m, debt ex-lease liabilities £794m), which is a reduction from £243m net debt at the end of 2021. They increased the total DPS for the year to 12.4p, a +31% increase. There’s an intention to free up £100m of cash, and so far they have achieved £30m. They then talk about returning surplus capital to shareholders. It’s worth bearing in mind that in note 18 they also list out contingent liabilities, which are historic matters where TCAP is a defendant from regulators, counterparties and previous employees seeking damages from previous behaviour (Libor, Swap reference rates, wrongful termination of employment etc). Sadly that seems like a normal cost of doing business in the finance sector, I don’t think TCAP is any worse than many other financial businesses.
Outlook: On 1st Dec 2020 TCAP held a Capital Markets Day and outlined targets for 2023. They hoped to grow revenues, at +4% CAGR into the medium term and improve operating margin from 15% to 18% by 2023F. Last week’s RNS revised down those expectations.
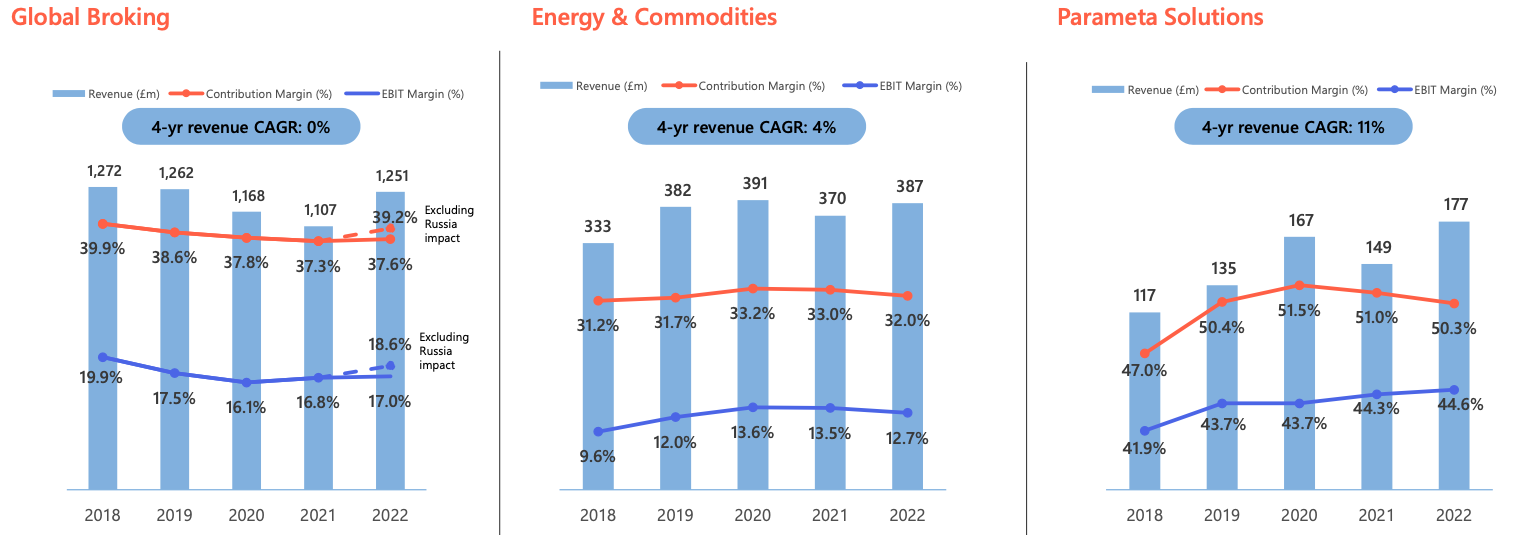
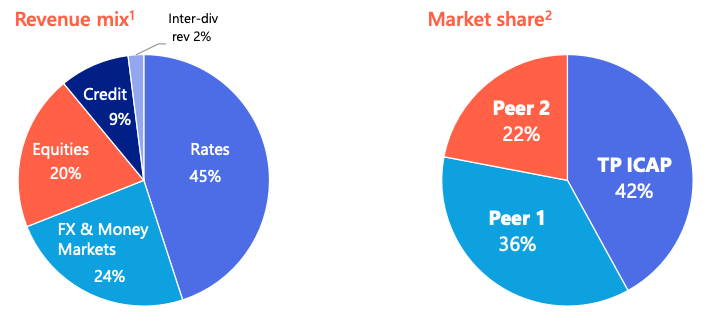
Revenue in Global Broking (which is 60% of the group) has flatlined since 2019. Even worse, the acquisition of Liquidnet, a credit and equities trading network with over 1,000 buyside clients, which they announced in September 2020 (deal completed March 2021) has failed to deliver. Following a decline in Liquidnet’s 2022 revenues, management have revised down group targets, to an adjusted EBIT margin of 14% (previously 18%).
They have already written down £20m of goodwill on the acquisition, which is likely the correct accounting treatment but seems remarkable for a deal that was only completed in March 2021. They paid close to $575m (the price might have been $125m higher, because of earn-outs, most of which presumably won’t now be paid). TCAP funded this by raising £315m in a rights issue at 140p per share and cut the group dividend by 50%. Total intangible assets stood at £1.8bn at the end of Dec 2022 versus shareholders’ equity of £2.2bn.
Energy & Commodities (18% of group revenue) grew at +4%, which seems a good performance given the disruption from Covid then Russia’s invasion of Ukraine.
The bright spot was Parameta Solutions (8% of group revenue), which grew the top line at CAGR at +11% over the last 4 years, and increased its divisional EBIT margin from 41.9% to 44.6%. They were asked on the call whether this business was ‘core’ or if they might look to sell it. The answer was non-committal, which I interpreted that they might sell if a buyer was going to pay a handsome price. In March last year Justin Hughes, an activist hedge fund manager took a position and urged management to stop buying companies and start selling. He suggested Parameta alone could be worth £1.5bn, versus a market cap for the entire group of £1.3bn.
Valuation: The shares are trading on 6x PER Dec 2024F falling to 5x PER Dec 2025F. Both the low PER multiple and high dividend yield is 7.4%, signals that some investors believe that payout is not sustainable though.
Opinion: This business seems to have the complexity of a bank, but a much lower market cap. However, although they specialise in Over The Counter (OTC) broking, rather than on-exchange transactions, it ought to be enjoying the network effects of being an intermediary with a 42% high market share. I took a position halfway through last year, and have taken another bite following these results.
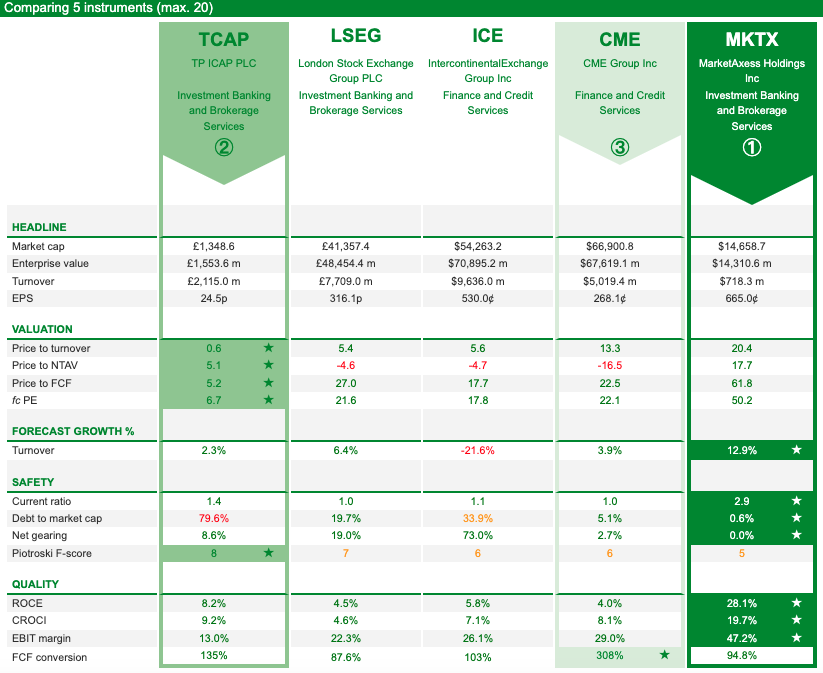
One of the aspects of IDBs I find most fascinating is the huge discount they trade at relative to exchanges, like the London Stock Exchange (LSEG), ICE (which bought the NYSE in 2013) or the CME and MarketAxess, which trade on 13x and 20x revenue respectively, versus 0.6x for TCAP.
Burford FY Dec Results delayed
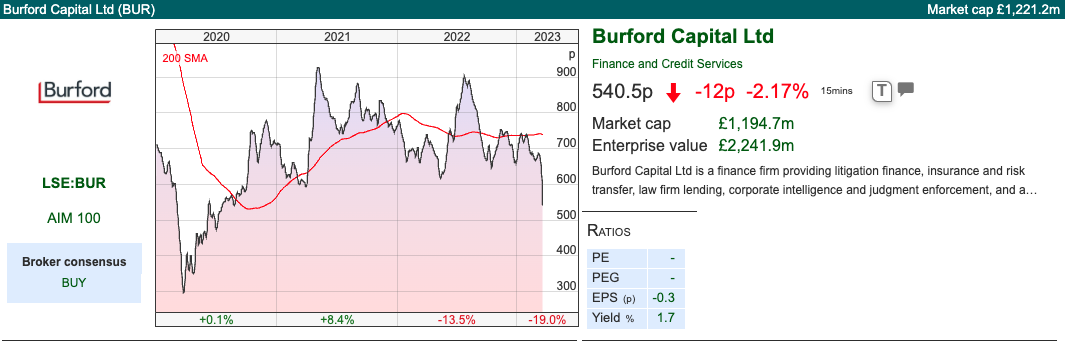
Burford, the dual listed (AIM and New York) litigation finance company have said that their FY Dec results will be delayed by 45-60 days, because of discussions with their US regulator, the Securities and Exchange Commission (SEC) probing how they account for the legal finance assets on their balance sheet. This includes historic results which might require a restatement, with presumably lower profits. The shares sold off -20% on the morning of the RNS.
Last week was a bad week to announce that the SEC is questioning your fair value accounting, however, unlike banks with uncertain long-dated assets, Burford has extended its maturity duration out to 2028 and beyond – so the group does not borrow short-term to lend long and there is no risk of short term deposit outflow like a bank run.
As the company is still agreeing the accounting treatment with the SEC, they haven’t released a full p&l or balance sheet. However, they have given some figures, saying that as the court system has returned to normal following the pandemic disruption, they are enjoying the benefit of more cases reaching conclusion. They have achieved $350m (2021: $264 million) of gross realisations, which converts to $137m of gains (2021: $128 million) versus their previous Fair Value marks. Cash receipts were up +28% to $296 million, and YTD have already received a further $90m. One thing to notice is that the year-end cash balance has fallen by a third, to $210m as they redeployed the cash that they have received back into funding more cases.
Burford’s only cumulative ROIC was 88%, down from 93% FY 2021. That 88% figure is not a fair value figure, but the actual returns they’ve achieved since 2009. The 88% ROIC is a blend of three numbers: i) 244% ROIC on $278m of cases that have won in court versus ii) -83% ROIC on $102m on cases that they’ve lost in court. By far the largest component though is the iii) 55% ROIC on the $800m cases that have settled before going to court.
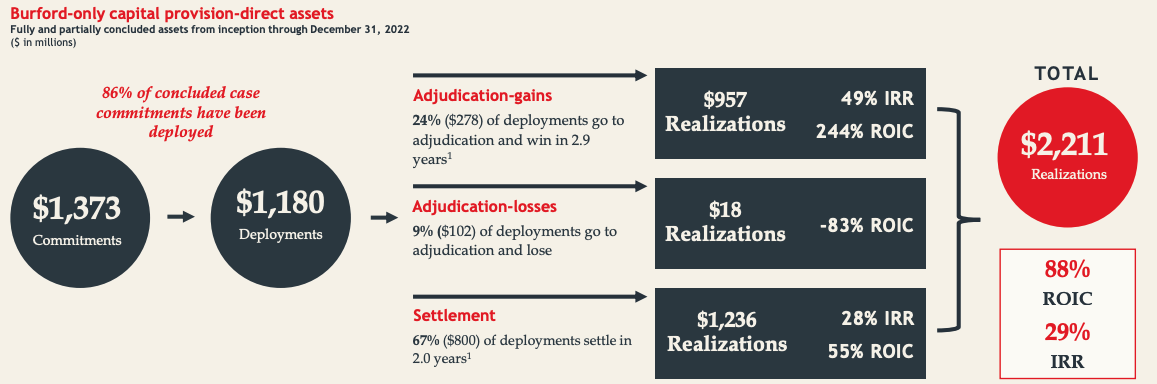
Excluding the Petersen case, where they are suing the Argentinian Government over the expropriation of the oil company YPF, the ROIC drops to 69%.
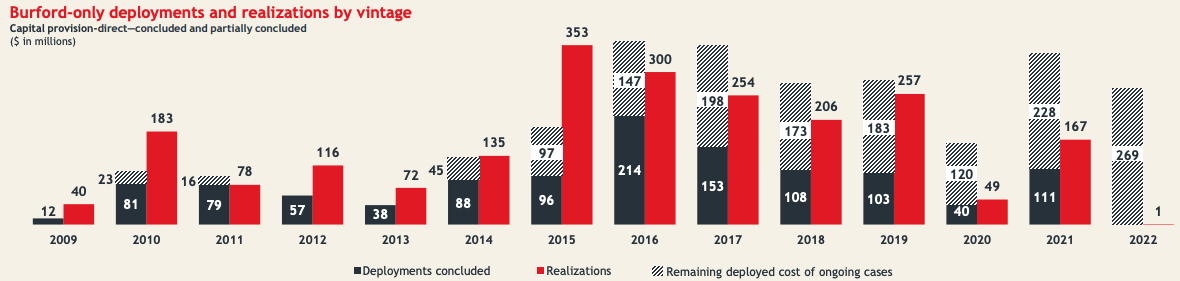
BUR’s annual ROIC figure on completed cases can be extremely volatile, 2011 was a disappointing vintage with negative return of 2%, as they deployed $79m, but only received back $78m. That compares to the best year, 2015, where they deployed $96m into 20 cases, but received back $353m achieving a ROIC of 268%. There are 4 cases ($97m deployed) from 2015 still ongoing.
For comparison, Litigation Capital Management reports an 11-year cumulative ROIC of 163%.
Petersen update: Burford is awaiting a court judgement on its case against the Argentinian Government for expropriating YPF, a listed oil company. The court filings were completed in June last year, but they are awaiting oral arguments, then either there’s a summary judgement or the case could go to trial within 115 days. At the end of 2021, management had valued this case on their balance sheet at $777m versus a $50m cost (ie $727m unrealised gain).
This looks like it is going to be a nightmare for market makers when the decision is announced. BUR expect it to appear on the Public Access to Court Electronic Records (PACER) system www.pacer.uscourts.gov without any prior warning. Burford will tell the stock market a decision has been released, without any details about its outcome or contents. They go on to say:
It is reasonable to expect that a summary judgment decision, in this case, would be voluminous and complex. Burford will only be able to provide any substantive public comment on the decision after it and its litigation counsel have had sufficient time to undertake a review and analysis of it. As such, it is very unlikely that such a comment will occur on the day the decision is released.
I’m glad that I’m not an analyst covering the stock, with fund managers and market makers demanding to know whether it is positive or negative for the share price within the first 10 minutes after the judgement becomes public.
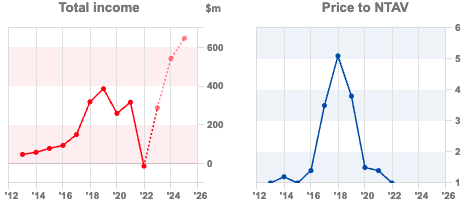
Valuation: The shares are trading on a dividend yield of 1.9% and NAV of 1.0x. That’s much better than the likes of CGEO or IPO which trade on a c. 50% discount to NAV. However, Blackstone (BX), which has hard-to-value Private Equity assets, trades on 8.4x NAV on the NYSE.
Opinion: I can’t see that this is going to trade at a premium until the Petersen case is resolved, one way or the other. That seems to me the likely catalyst for a re-rating, rather than the SEC possibly forcing a restatement of historic profits. I own the shares, as I think that litigation funding as part of a diversified portfolio makes sense. I can imagine that this is not for everyone though.
Notes
The author owns shares in Burford, TP ICAP and Argentex.
Bruce Packard
brucepackard.com
Got some thoughts on this week’s commentary from Bruce? Share these in the SharePad “Weekly Market Commentary” chat. Login to SharePad – click on the chat icon in the top right – select or search for “Weekly Market Commentary” chat.
This article is for educational purposes only. It is not a recommendation to buy or sell shares or other investments. Do your own research before buying or selling any investment or seek professional financial advice.


Weekly Market Commentary | 21/03/23 | BUR, TCAP | Who is next?
With the ‘rescue’ of Credit Suisse over the weekend, Bruce ponders what might happen next and which indicators to focus on. Companies covered BUR and TCAP.
The FTSE 100 fell -2.5% to 7,358 over the last 5 days. The Nasdaq100 and S&P500 were up +1.4% and 5.8% respectively, indicating that the sell-off in markets has been largely about the financial sector, rather than companies operating in the broader economy. The US 2Y government bond yield fell sharply last week, from a peak of 4.86% at the beginning of March to 3.77%, as investors revised their view of Central Bank interest rate expectations. The price of gold rose +5% to $1,922 and oil (Brent Crude, most traded BZ-MT) fell -8% to $75 per barrel.
Over the weekend Credit Suisse was ‘rescued’ by UBS, in an all-share deal valuing CS equity at $3.25bn (CHF 3bn) or CHF0.76 per share. That’s well below Credit Suisse’s Friday closing price of CHF1.86, but better than UBS’s original offer of just CHF0.25 per share (or $1bn). The combined entity will have $1.7 trillion of total assets (UBS $1.1tn and Credit Suisse $575bn). UBS shares fell -12% to CHF 15 on Monday morning as investors digested the news.
Earlier last week the Swiss National Bank (SNB, the Central Bank) had provided Credit Suisse with CHF 50bn ($54bn) of liquidity support. But this was inadequate, and the SNB has now provided a further CHF100bn. There are many unanswered questions – for instance:
Unanswered questions:
Why did the crisis resolution mechanisms not work as they were supposed to? If this was really a bank run, with uninsured depositors removing their money, why didn’t the Central Bank provide enough support? Or if there was a solvency issue, what has UBS taken on? What were the Saudi’s (Credit Suisse’s largest shareholder) thinking when they said last week that they would not support the bank?
More broadly: what will be the effects of wiping out Credit Suisse’s CHF 16bn ($17bn) of Additional Tier 1 Capital? These AT1 capital holders were wiped out by the Swiss regulator, while equity investors were not; so how do bond investors price that risk in future? NB Deutsche Banks AT1 bonds were trading at 60c in the dollar on Monday, and BNP Paribas 70c on the dollar. On Sharepad we can track the Invesco AT1 Capital Bond ETF (ticker LSE:AT1). The recent sell-off looks to be of similar magnitude to the pandemic sell-off in March-April 2020.
Also, are customer deposits leaving weaker banks to find a home at stronger banks? Or is money leaving the banking system completely, and going into Money Market Funds (MMFs)? The FT reported inflows of $120bn into the latter last week, it’s hard to believe that such a large movement of money can slosh outside of the banking system without causing problems. This substacker has suggested the Fed’s Reverse Repo Facility (RRP) is worth watching for precisely that reason.
Putting those two themes together, wouldn’t it be fun if the MMFs which are currently benefiting from deposit flight from the banking system, owned the banks’ AT1 debt that is now being re-priced? What will be the regulatory response? What effect will that have on banks’ net interest margins, capital ratios and return on equity in the medium term?
Who is next?
One indicator worth following is KRE, the KBW regional banks index, which was down -14% last week (or -26% YTD).
Of the US regional banks, First Republic Bank (FRC) was down -72% last week, despite a consortium of JP Morgan and 10 other banks agreeing to deposit $30bn at FRC. Charles Schwab, the US retail broker, shares recovered last week, but are still off -30% YTD. Closer to home currency trader Argentex, which I own, fell -16% in the last week, while Equals was down -9%, presumably as investors are worried about counterparty risk.
Rule of thumb:
There is an old banks’ analyst rule of thumb, that the banks that did badly in the last crisis, tend not to be the most vulnerable in the next one. Instead, it is the banks that sailed through the last crisis largely unscathed that become overconfident and are most exposed to the next crisis. This is certainly true of Credit Suisse and Silicon Valley Bank, which mostly avoided the problems of the GFC 2007-9.
On that basis, we might see problems at Japanese, Canadian, Nordic or Australian Banks. One of my favourite features of Sharepad is the ability to explore international companies and make comparisons. I have put together a ‘watch list’ of global banks and financials. I have sorted this by country, so far the Canadian banks are holding up well, but in Europe, Soc Gen and Deutsche Bank were both down -18% in the last 5 days.
Japanese banks’ balance sheets are so large it’s hard to believe that they won’t be affected by rising interest rates or duration concerns. MUFJ has almost 400 trillion yen of assets ($3 trillion at today’s exchange rate) of which c. $1 trillion is banking loans while $640bn is investment securities.
This week I look at a couple of financials which appear cheap. Don’t worry, they are not banks! There’s significant complexity in what TCAP and Burford do, so these might not be for everyone. However, neither company has the risk of customers asking for their deposits back, so they don’t operate with the liquidity/funding risk that a bank has to. TCAP’s net debt was just £11m, although the gross exposure is higher and there’s some counterparty risk.
On the liability side, Burford has no bonds that mature this year, and $120m coming due in 2024 (less than 10% of the group borrowing). However, there’s considerable uncertainty on the asset side of the balance sheet (legal disputes, roughly half of which are fair value gains) that BUR carries on its balance sheet.
TP ICAP FY Dec Results
This Inter Dealer Broker (IDB) reported FY results, formed in 2016 by merging Tullett Prebon (Terry Smith) and Icap (Michael Spencer) businesses. Revenue was +7% on a constant currency basis, however much of TCAP’s revenue is earned in dollars, but sterling is the reporting currency, so reported revenue was even better, up +13% to £2.1bn. Reported PBT was up 4.5x to £113m. Adjusted PBT was £226m, the most significant items were amortisation and impairment of intangibles (£65m) and employment and general costs (£56m). The latter aren’t an exceptional item that I would adjust out, however, TP ICAP bought Liquidnet (completed March 2021) and hence there were some restructuring and redundancy costs which probably were exceptional in nature.
Net debt was £11m (gross cash £888m, debt ex-lease liabilities £794m), which is a reduction from £243m net debt at the end of 2021. They increased the total DPS for the year to 12.4p, a +31% increase. There’s an intention to free up £100m of cash, and so far they have achieved £30m. They then talk about returning surplus capital to shareholders. It’s worth bearing in mind that in note 18 they also list out contingent liabilities, which are historic matters where TCAP is a defendant from regulators, counterparties and previous employees seeking damages from previous behaviour (Libor, Swap reference rates, wrongful termination of employment etc). Sadly that seems like a normal cost of doing business in the finance sector, I don’t think TCAP is any worse than many other financial businesses.
Outlook: On 1st Dec 2020 TCAP held a Capital Markets Day and outlined targets for 2023. They hoped to grow revenues, at +4% CAGR into the medium term and improve operating margin from 15% to 18% by 2023F. Last week’s RNS revised down those expectations.
Revenue in Global Broking (which is 60% of the group) has flatlined since 2019. Even worse, the acquisition of Liquidnet, a credit and equities trading network with over 1,000 buyside clients, which they announced in September 2020 (deal completed March 2021) has failed to deliver. Following a decline in Liquidnet’s 2022 revenues, management have revised down group targets, to an adjusted EBIT margin of 14% (previously 18%).
They have already written down £20m of goodwill on the acquisition, which is likely the correct accounting treatment but seems remarkable for a deal that was only completed in March 2021. They paid close to $575m (the price might have been $125m higher, because of earn-outs, most of which presumably won’t now be paid). TCAP funded this by raising £315m in a rights issue at 140p per share and cut the group dividend by 50%. Total intangible assets stood at £1.8bn at the end of Dec 2022 versus shareholders’ equity of £2.2bn.
Energy & Commodities (18% of group revenue) grew at +4%, which seems a good performance given the disruption from Covid then Russia’s invasion of Ukraine.
The bright spot was Parameta Solutions (8% of group revenue), which grew the top line at CAGR at +11% over the last 4 years, and increased its divisional EBIT margin from 41.9% to 44.6%. They were asked on the call whether this business was ‘core’ or if they might look to sell it. The answer was non-committal, which I interpreted that they might sell if a buyer was going to pay a handsome price. In March last year Justin Hughes, an activist hedge fund manager took a position and urged management to stop buying companies and start selling. He suggested Parameta alone could be worth £1.5bn, versus a market cap for the entire group of £1.3bn.
Valuation: The shares are trading on 6x PER Dec 2024F falling to 5x PER Dec 2025F. Both the low PER multiple and high dividend yield is 7.4%, signals that some investors believe that payout is not sustainable though.
Opinion: This business seems to have the complexity of a bank, but a much lower market cap. However, although they specialise in Over The Counter (OTC) broking, rather than on-exchange transactions, it ought to be enjoying the network effects of being an intermediary with a 42% high market share. I took a position halfway through last year, and have taken another bite following these results.
One of the aspects of IDBs I find most fascinating is the huge discount they trade at relative to exchanges, like the London Stock Exchange (LSEG), ICE (which bought the NYSE in 2013) or the CME and MarketAxess, which trade on 13x and 20x revenue respectively, versus 0.6x for TCAP.
Burford FY Dec Results delayed
Burford, the dual listed (AIM and New York) litigation finance company have said that their FY Dec results will be delayed by 45-60 days, because of discussions with their US regulator, the Securities and Exchange Commission (SEC) probing how they account for the legal finance assets on their balance sheet. This includes historic results which might require a restatement, with presumably lower profits. The shares sold off -20% on the morning of the RNS.
Last week was a bad week to announce that the SEC is questioning your fair value accounting, however, unlike banks with uncertain long-dated assets, Burford has extended its maturity duration out to 2028 and beyond – so the group does not borrow short-term to lend long and there is no risk of short term deposit outflow like a bank run.
As the company is still agreeing the accounting treatment with the SEC, they haven’t released a full p&l or balance sheet. However, they have given some figures, saying that as the court system has returned to normal following the pandemic disruption, they are enjoying the benefit of more cases reaching conclusion. They have achieved $350m (2021: $264 million) of gross realisations, which converts to $137m of gains (2021: $128 million) versus their previous Fair Value marks. Cash receipts were up +28% to $296 million, and YTD have already received a further $90m. One thing to notice is that the year-end cash balance has fallen by a third, to $210m as they redeployed the cash that they have received back into funding more cases.
Burford’s only cumulative ROIC was 88%, down from 93% FY 2021. That 88% figure is not a fair value figure, but the actual returns they’ve achieved since 2009. The 88% ROIC is a blend of three numbers: i) 244% ROIC on $278m of cases that have won in court versus ii) -83% ROIC on $102m on cases that they’ve lost in court. By far the largest component though is the iii) 55% ROIC on the $800m cases that have settled before going to court.
Excluding the Petersen case, where they are suing the Argentinian Government over the expropriation of the oil company YPF, the ROIC drops to 69%.
BUR’s annual ROIC figure on completed cases can be extremely volatile, 2011 was a disappointing vintage with negative return of 2%, as they deployed $79m, but only received back $78m. That compares to the best year, 2015, where they deployed $96m into 20 cases, but received back $353m achieving a ROIC of 268%. There are 4 cases ($97m deployed) from 2015 still ongoing.
For comparison, Litigation Capital Management reports an 11-year cumulative ROIC of 163%.
Petersen update: Burford is awaiting a court judgement on its case against the Argentinian Government for expropriating YPF, a listed oil company. The court filings were completed in June last year, but they are awaiting oral arguments, then either there’s a summary judgement or the case could go to trial within 115 days. At the end of 2021, management had valued this case on their balance sheet at $777m versus a $50m cost (ie $727m unrealised gain).
This looks like it is going to be a nightmare for market makers when the decision is announced. BUR expect it to appear on the Public Access to Court Electronic Records (PACER) system www.pacer.uscourts.gov without any prior warning. Burford will tell the stock market a decision has been released, without any details about its outcome or contents. They go on to say:
It is reasonable to expect that a summary judgment decision, in this case, would be voluminous and complex. Burford will only be able to provide any substantive public comment on the decision after it and its litigation counsel have had sufficient time to undertake a review and analysis of it. As such, it is very unlikely that such a comment will occur on the day the decision is released.
I’m glad that I’m not an analyst covering the stock, with fund managers and market makers demanding to know whether it is positive or negative for the share price within the first 10 minutes after the judgement becomes public.
Valuation: The shares are trading on a dividend yield of 1.9% and NAV of 1.0x. That’s much better than the likes of CGEO or IPO which trade on a c. 50% discount to NAV. However, Blackstone (BX), which has hard-to-value Private Equity assets, trades on 8.4x NAV on the NYSE.
Opinion: I can’t see that this is going to trade at a premium until the Petersen case is resolved, one way or the other. That seems to me the likely catalyst for a re-rating, rather than the SEC possibly forcing a restatement of historic profits. I own the shares, as I think that litigation funding as part of a diversified portfolio makes sense. I can imagine that this is not for everyone though.
Notes
The author owns shares in Burford, TP ICAP and Argentex.
Bruce Packard
brucepackard.com
Got some thoughts on this week’s commentary from Bruce? Share these in the SharePad “Weekly Market Commentary” chat. Login to SharePad – click on the chat icon in the top right – select or search for “Weekly Market Commentary” chat.
This article is for educational purposes only. It is not a recommendation to buy or sell shares or other investments. Do your own research before buying or selling any investment or seek professional financial advice.