Bruce updates a chart Terry Smith first published in the FT in 2014, looking at Tesco EPS progress versus declining Return on Capital. Other companies featured IPX, SDRY, GRG and AGFX.
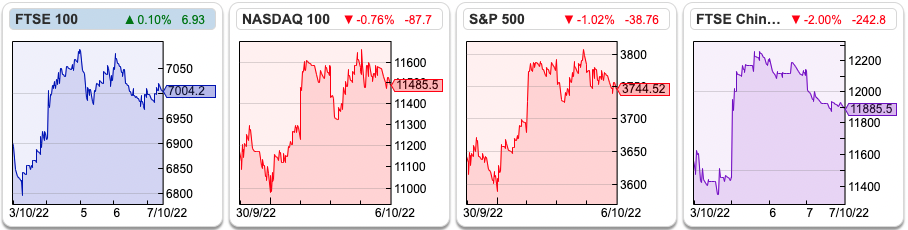
The FTSE 100 recovered to just above 7000 last week and the pound recovered to 1.12 to the dollar. The Nasdaq100 and S&P500 rallied c. +4.5% while the US 10Y Govt bond yield was 3.85% and the UK 10y gilt was 4.22% versus 3.0% a month ago. Brent crude rose +12% during the week to $93 per barrel as OPEC plus members said they would cut production by 2m barrels a day, roughly 2% of global oil consumption.
Portfolio review
I am down -30% YTD (ex-cash balance), versus AIM -33%. I didn’t sell anything in H1, though I did take some profit in Impax AM last year, as the shares had increased by 30x. Unless I believe a share is significantly overvalued, I won’t sell and just suffer the paper loss in drawdowns. That approach means the damage has been done by my long term “buy and hold” positions, which had grown by the start of the year to be significantly concentrated in my top 5 largest holdings.
Impax AM, a top 5 holding and my worst performer is down -63% YTD to 540p. That seems harsh given that Impax AM said last week they’re still seeing inflows of £606m in the quarter to September. Assets under Management (AuM) fell by -4.1% over the last 12 months. The share price reaction -45% in the last 12M and -63% YTD disagrees, so in retrospect, I should have sold the entire position and paid the CGT.
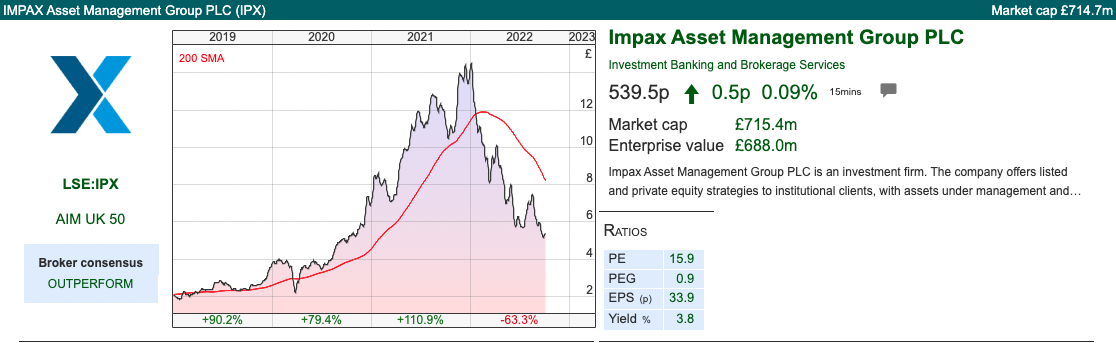
Similarly, Games Workshop another top 5 position is down -40% YTD to £60. Both companies report high profitability (Impax 26% RoCE, Games Workshop 59% RoCE, each 3 year average) but do not always generate smooth revenue progression. Whenever investors believe growth will slow, the high valuation tends to be punished with a steep sell off.
If you’re going to do low-frequency, buy-and-hold investing then i) concentrating on companies with sustainably high RoCE makes sense ii) you’ll see large paper losses when investors fret that growth and/or profitability could disappoint. Only in Excel spreadsheets is growth a constant, so it follows that over a long enough time horizon ii) is inevitable.
Those observations are backed up by the data. Christopher Meyer has analysed Hundred baggers and points out that most quality ‘multi-bagger’ stocks suffer 50% or greater drawdowns. Amazon, -28% YTD, is the most famous example, falling 95% following the internet bubble bursting. Looking at the Amazon share price chart in log scale shows it has had a >20% drawdown in 19 of 25 years that it’s been listed. Apple since it listed in 1980 has seen an 80% decline peak to trough, twice! Meta is down -59% YTD, so “poor” Mark Zuckerberg has lost around $70bn – though he’s still one of the top 500 richest people in the world.
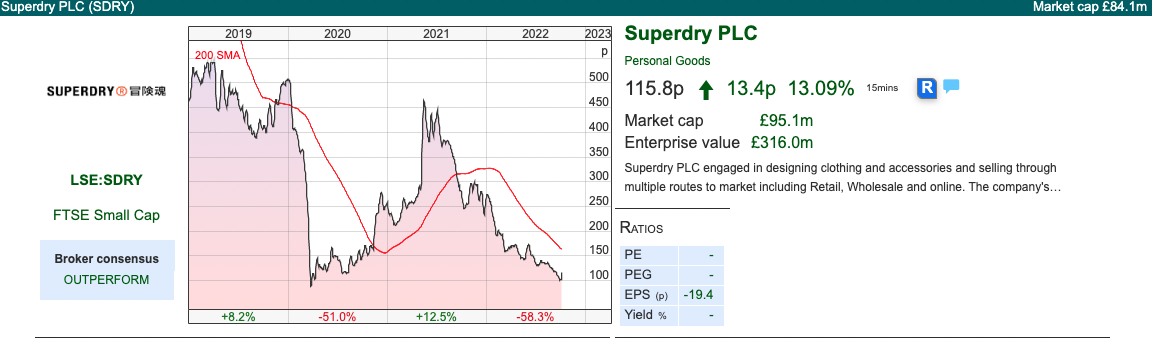
I mentioned Superdry -58% YTD last week had fallen from a peak above £20 at the beginning of 2018 to £1, and to keep an eye out for retailers who are starting to see a top-line recovery. SDRY reported on Friday, revenue growing at +9.6% and they expect the recovery to continue FY 2023. The shares are trading on below 5x PER Apr 2023F. A way to play the potential recovery, in my view.
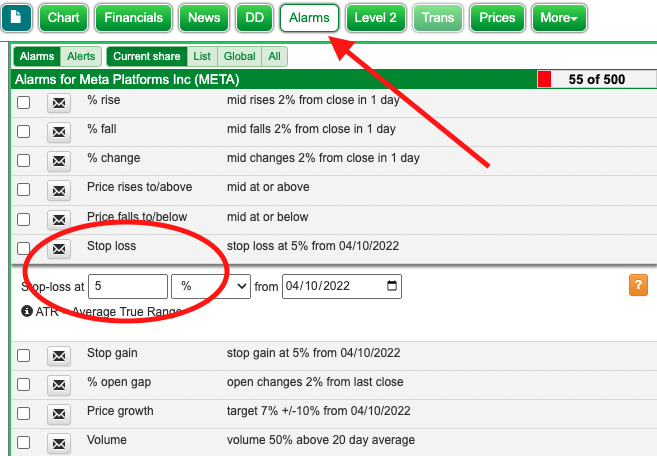
I can understand if investors can’t stomach paper losses from large drawdowns, so an alternative is to use Sharepad’s “Alarms” tab to tell you when a stock has fallen by X amount. You can apply the same alarm to a single share or list of shares (ie your portfolio). The default is a 5% fall as a stop loss, but it’s easy to customise it to a decline that suits your trading style. There’s a whole suite of other alarms that you can set, although I tend to keep things simple.
This week I look at currency trader Argentex, which is raising guidance helped by volatility in markets and Greggs, famous for its sausage rolls. But I start with Tesco because it fits into my theme of why buy-and-hold investors ought to look for companies with sustainably high profitability.
Tesco H1 results to end August
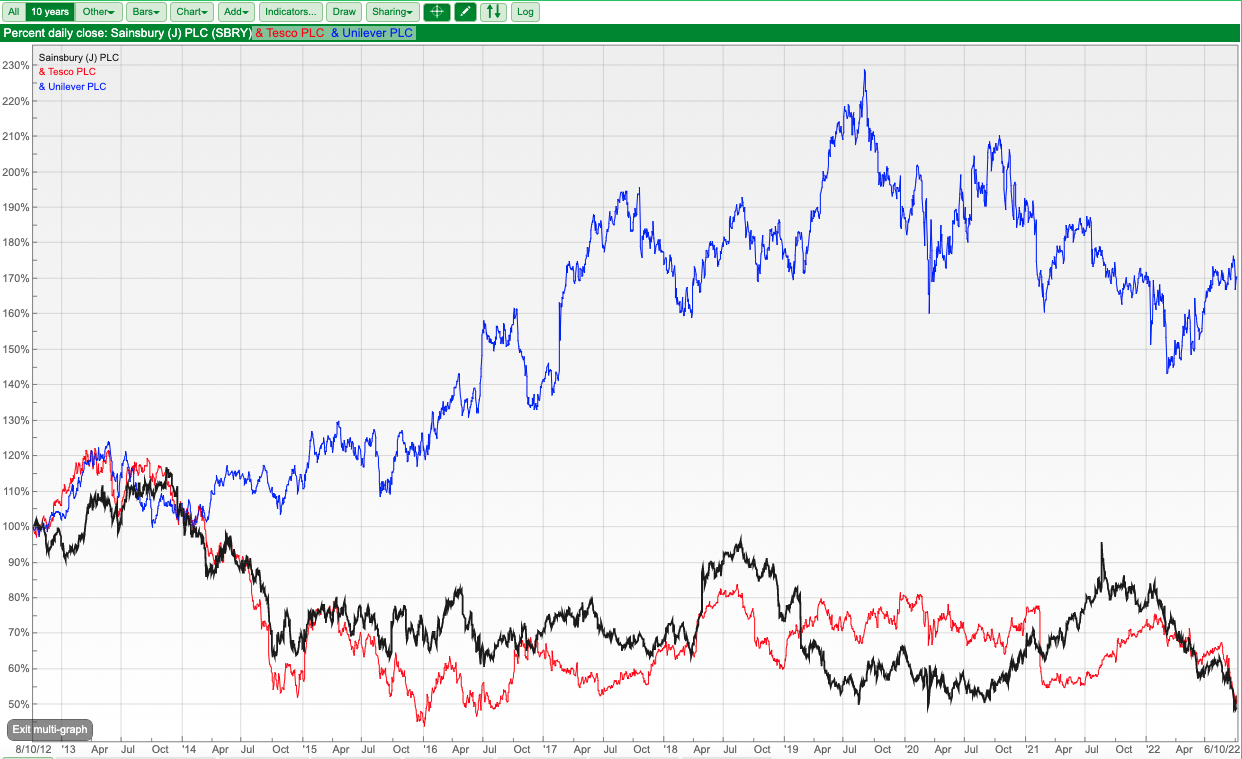
I noted last week in my sector review how badly FTSE 100 supermarkets had done, so I was curious to see what has gone wrong. Households are still buying food, if anything the rising cost of living might encourage shoppers to switch to supermarkets’ own labels, away from Heinz Baked Beans or Unilever brands like Hellmann’s mayonnaise. Yet Unilever share price is flat YTD, while Tesco is down -31%. I’ve used Sharepad’s multigraph feature to show over the last decade, the divergence in performance is much larger, with supermarkets (Tesco in red, Sainsbury in black) down c. -50% versus Unilever (blue) +70%.
Tesco reports sales excluding the fuel that it sells through its petrol stations. Rising petrol prices meant those sales rose +39% in their H1, but rising energy prices is not something that management control so it is adjusted out by the company. Group sales on the company-reported basis were up +3.1% to £28.2bn for the H1 to the end of August. Like-for-like retail sales were up less than +1% in the UK, +10% in Europe and +14% at Booker. Tesco bought Booker, which owns Budgens and Londis and was a wholesale supplier to other convenience stores in 2017 for £3.7bn. Interestingly they say that online like-for-like sales declined by -11%, as customers returned to shopping in their stores. Online sales participation was 13%, which is still +3.6% higher than before the pandemic.
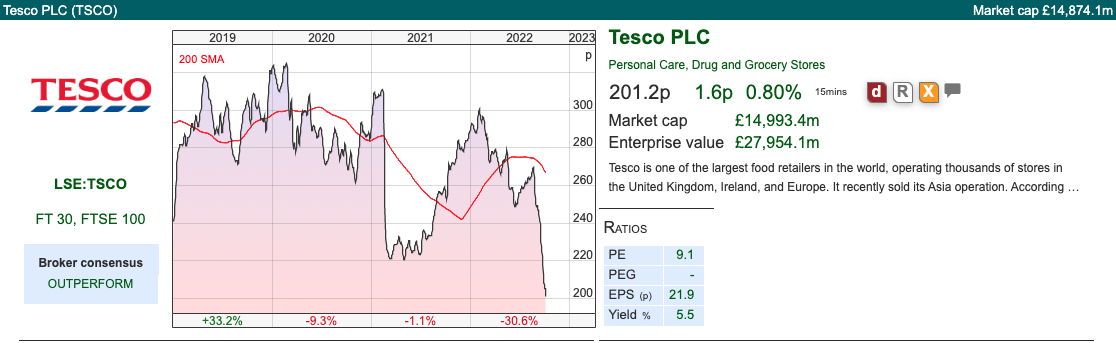
The supermarket’s adjusted operating profit was down -10% to £1.3bn in their H1, and there was a £626m non-cash charge for impairment of assets. The operating margin, after adjusting for fuel sales and the impairment charge, was just 4.0%. Below the line in ‘other comprehensive income’ there was a further £2bn charge for the remeasurement of the pension deficit. Most of Tesco’s pension obligations are now in surplus on an IAS19 basis (£1bn surplus recorded on the asset side of the balance sheet, £242m deficit on the liability side) but values still swing around based on assumptions and performance of pension plan assets.
The £626m impairment is because Tesco has sold-and-leaseback some of its stores, and now that discount rates are rising, the reduces the value of those assets and corresponding liabilities. This article from 2015 suggests that the sale and leaseback contracts with British Land were linked to inflation. That makes me cautious of the idea that supermarkets are now beneficiaries of rising inflation. Net debt including £8bn of lease liabilities was £10bn, or 2.5x EBITDA. If Tesco had kept the freehold on their properties, then I think they’d be better positioned, or at least the movements in the balance sheet and charges through the p&l would be easier for investors to understand.*
Net finance costs were a further £325m, around half of which was paying lease liabilities and a third of which was debt service cost. The debt service cost was flat, but the cost of lease liabilities fell -9% to £189m. I couldn’t find any explanation of the sensitivities. Staff costs are obviously rising, particularly lorry drivers. Statutory PBT, which includes the £626m non-cash lease impairment, was down -64% to £413m.
There’s also Tesco Bank, which was set up in the 1990s, from memory it was a JV with the Bank of Scotland. There was much excitement at the time that new entrant supermarkets would take market share from banks, and their superior data analytic skills (Tesco owns DunnHumby, the data science business started in a kitchen at Chiswick) would generate better deals for customers and higher profits for shareholders. 25 years later Tesco Bank reported revenue of £540m in H1, and PBT of £60m. The bank has £6.8bn of loans, and £5.5bn of deposits – for context it’s about 70x smaller than Lloyds Bank’s loan book.

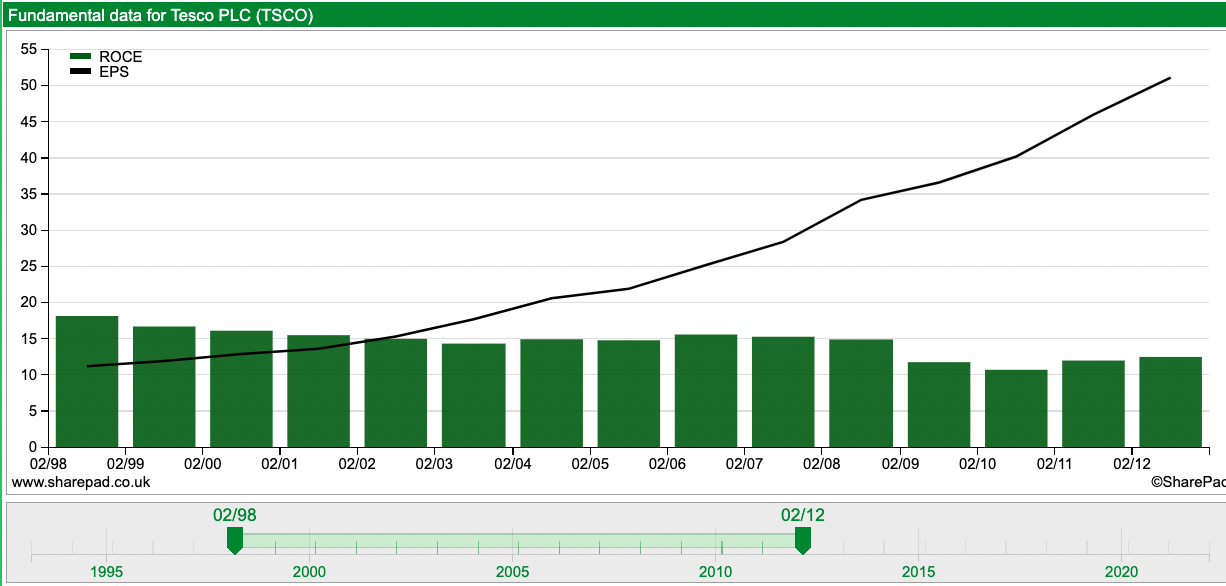
Tesco has been and still is, under pressure from the rise of the German no-frills supermarkets, Aldi and Lidl, in an escalating price war. This price war has lasted a decade, and last week’s results show no signs that a cease-fire will be declared. Even before that though, there were reasons to be cautious on Tesco, as outlined by a certain Terry Smith in this 2014 letter to the FT. The former banks’ analyst pointed out that though valuation is superficially attractive, EPS growth had been achieved with rising net debt and accounting gimmickry. Notwithstanding the aggressive accounting which Tesco was later forced to re-state, RoCE had fallen from almost 20% in the late 90’s to 12% 15 years later. I’ve used Sharepad to recreate Terry’s original 2014 chart showing EPS (black line) rising but RoCE (green bars) falling.
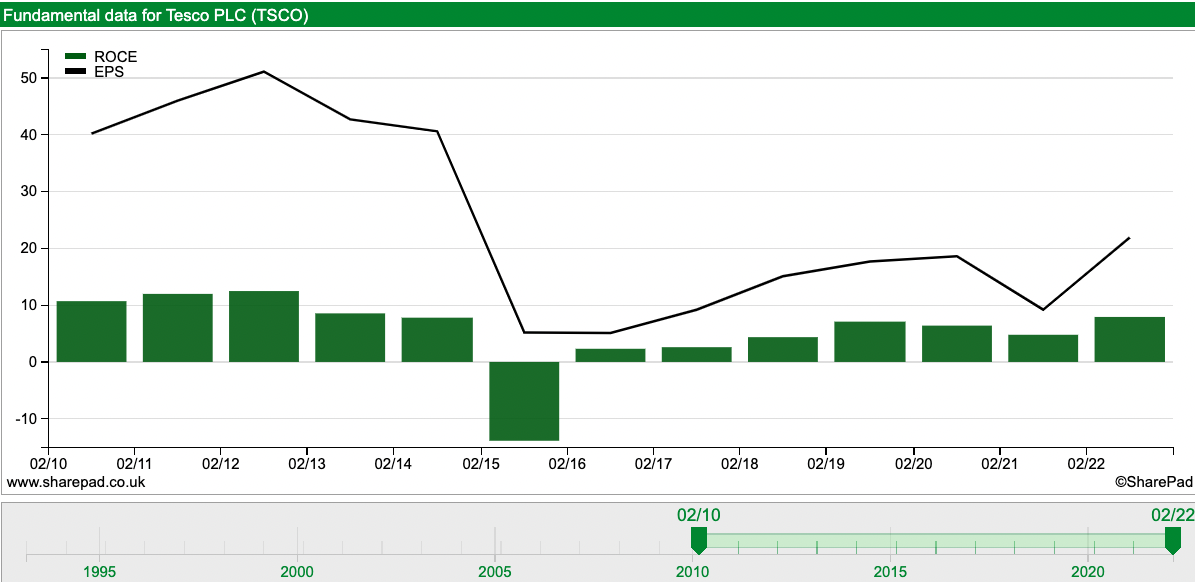
Below is the same chart, but updated for the most recent decade. I’ve used adjusted EPS, because Tesco’s reported EPS in 2015 was -80p, when they reported a £5.7bn loss and restatement prior years, which throws the scale off.
The chart shows that despite the ‘kitchen sink’, which included accounting restatements in 2015, RoCE has not risen above 10% since 2012, hence although EPS has now recovered to 20p FY Feb 2022, this has not created value for shareholders. More capital is being employed to generate lower returns. The low RoCE figure explains the decades-long divergence of the share price with Unilever: 3-year average RoCE of 21.4% according to Sharepad.
Data analytics: Tesco owns Dunnhumby, which analyses Loyalty Clubcard data. The insights generated have failed to help Tesco achieve any competitive advantage though. The subsidiary was put up for sale in 2015 with Goldmans, Tesco’s adviser, optimistic £2bn valuation. The sale was scrapped when WPP was the only bidder left, willing to pay c. £600m. The sale process revealed that rather than helping Tesco achieve higher profits, Dunnhumby was instead generating profits by re-selling insights gleaned from Tesco customers’ data to consumer brands like Coca-Cola and Diageo.
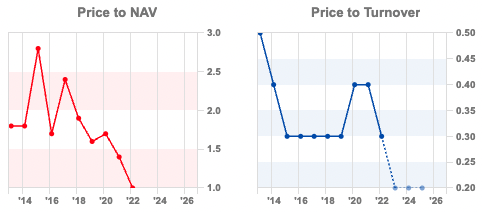
Valuation: Tesco is trading on 9x Feb 2024F and Feb 2025F PER, suggesting the company is low growth. However, the 3 year average RoCE is 6.1%, implying that unless RoCE improves, increases in EPS would not drive a re-rating higher. We can also see that in the de-rating of Price/NAV and Price/Turnover, in the chart below.
Opinion: The shares are not expensive on a PER, but I think the company is a cautionary lesson. Low RoCE companies can stay low returning for decades, despite the best efforts of management to improve returns. A company that can maintain RoCE at 20% and grow at +6% per year is worth a much higher PER multiple than a company with 6% RoCE growing at +20% a year. Buffett has summarised this as ‘a good company at a fair price, rather than a fair company at a good price’.
None of this is an exact science though, there are trade-offs and it is possible to drive too hard in the opposite direction. In the late 1990s Lloyds Bank found itself in a strategic cul-de-sac after Brian Pitman focused too much on ‘shareholder value’, Lloyds reported 40% RoE, but such a high hurdle rate meant it had few strategic options. Lloyds had underinvested in core systems and faced competitive pressure from HBOS and Northern Rock, and never recovered its level of profitability even after the financial crisis. Drawdowns of high RoCE company imply that once things start going wrong, profitability will never recover. In the case of Apple this was false, but for Lloyds it was true.
Argentex trading update FY Dec
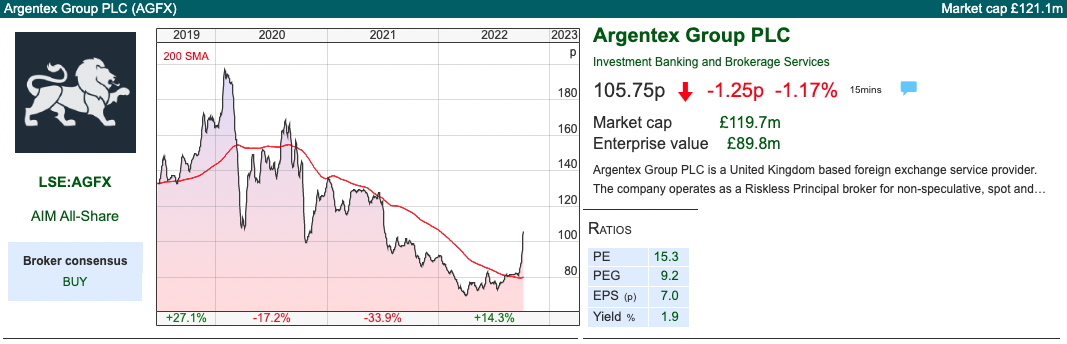
This currency trading company that is in the middle of changing year end from March to December, put out an update for 6 months to September. Revenues for the old half-year split (Apr-Sept) were up +75% to £27.4m, and were up +58% 9M Sept v 9M Sept last year to £36.9m. The year-end change means that Sharepad’s “Forecast” tab may contain estimates based on a combination of the old and new year-end, so may not be reliable. Singers, their new broker, were forecasting FY Dec 2022F revenues of £39m, simply doubling of H1 (Apr-Sept) of £27.4m would imply £55m FY revenue, so management are confident that they will exceed those old forecasts.
Oddly, the number of actively trading clients actually fell to 1,393 versus 1,624 at the FY to March. That figure was up +12% on H1 last year. Given the FY clients numbers is consistently larger than the H1 figure, I think that means that they have ‘active’ clients who trade just once a year? AGFX do say in the FY statement that their top 20 clients constitute 36% of revenue, implying that the other 1000+ clients don’t generate much revenue at all. I’ve gone back and graphed revenue per client by half year, and we can see that this half (Apr-Sept this year, I’ve called H1 2023) revenue/client £39K, is up +55% versus H1 last year. That does seem to have been particularly busy compared to recent history.
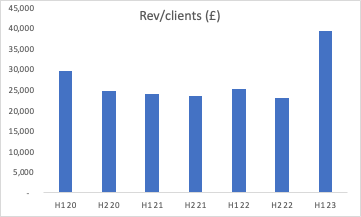
For context Alpha FX, with forecast FY Dec 2022F revenues of c. £100m reports £66K revenues per client in their Risk Management division. It could be that AGFX has signed up lots of low value clients, but I prefer the company’s explanation that it takes time for their customers to give them more business.
Forecasts: It’s important to remember though that the former broker’s (Numis) original forecast was for 12p of EPS in Mar 2022. Management then changed their financial year end, they claimed to help with H1 v H2 seasonality. The changed year end has also muddied the waters in terms of the size of the downward EPS revision: presumably not an unintended consequence.
Readers will know that I’m sceptical of broker forecasts, because they tend to come from discussions with management, and reflect an extrapolation of current conditions which can change quickly. This is particularly true in financial markets businesses, where short-term volatility is not something management can control. Last week’s RNS does say that sterling weakness created “exceptional short-term trading conditions”. Thus, it’s worth asking to what extent September’s volatility drew forward revenue into the present? Could we see a lull in activity in H1 next year?
Valuation: I haven’t seen Singers new forecasts, but I’m going to conservatively use their old forecasts even if there’s likely to be upward revisions. Before last week the broker was expecting EPS of 6.4p FY Dec 2023F, then rising +58% to 10.1p the following year. That would imply a PER of 16x next year, dropping to 10.4x 2024F. In my view 10x PER seems good value versus the high historic RoCE achieved (32.7% 3 year average).
Opinion: This seems to me an example of a company with high profitability, suffering a >50% drawdown peak to trough, as investors worried that returns weren’t sustainable. I bought earlier this year and increased my position in July as I thought most of the bad news was already priced in and rivals AFX and EQLS were benefiting from favourable conditions. The chart looks like a nice bowl so I’m a happy holder.
Greggs Q3 trading update
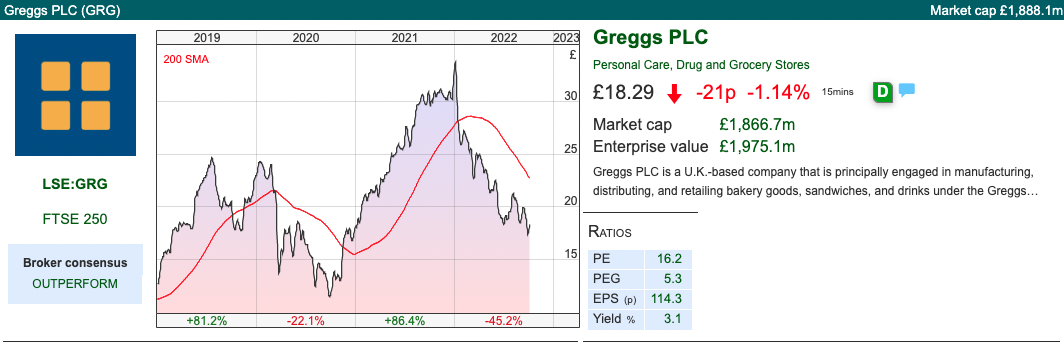
This food retailer with 2,200 outlets across the UK said total sales were up +14.6% Q3 (July-Sept) v Q3 last year. Results would have been even better if they hadn’t closed for 19th September, the Queen’s funeral.
This is an example of a company that ought to have been defensive, the balance sheet is mainly tangible assets (£355m of property and of fixed assets, plus £271m of leased properties). No debt, shareholders equity was £392m versus net cash of £146m at H1. That’s after paying a 40p (£41m) special dividend in April. There’s a small IFRS pension deficit (£2.4m as of FY Dec 2021) and the company is making £2.5m (c. 1% of PBT) of contributions each year from 2022 to 2026.
Outlook: They’ve opened 90 new shops net YTD (106 opened, 16 closed). The outlook statement is encouraging saying that they continue to trade well, and cost inflation of +9% on a like-for-like basis is inline with previous guidance.
Yet the shares are down -45% YTD. I’m wondering if the concern is that Work From Home is bad news for high street food retailers? The +9% like-for-like sales growth just reported suggests that’s WFH isn’t having much impact though. A different bear case is that as people struggle with the cost of living, they will cut back on small discretionary items like a Greggs sausage roll.
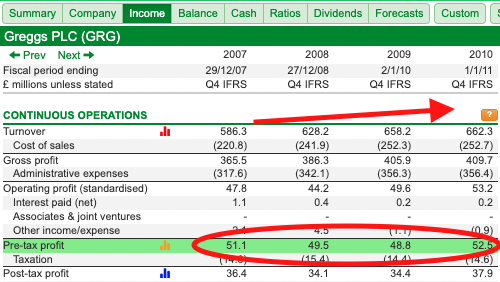
The pandemic did cause a -31% decline in revenue and a £13m loss, but that seems genuinely exceptional. The ability to use Sharepad to quickly go back and check what happened to revenue and profits in a ‘normal’ recession 2007-2010 is invaluable. As the table below shows, profits were flat but revenues kept rising. That suggests to me that the shares are reasonably recession proof and the sell-off is probably overdone.
In fact, management see an opportunity to expand its UK estate to at least 3,000 shops, presumably helped by attractive property lease deals as landlords struggle for tenants. Greggs have increased the rate at which they are opening in new locations given the increased availability of good sites. For instance, they now have stores on the Strand and Leicester Square.
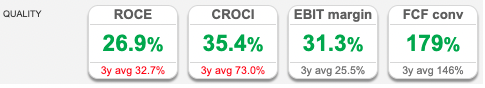
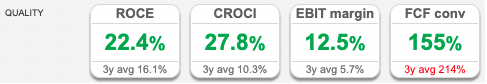
Valuation: Sharepad’s quality tab tells a reassuring story on profitability (RoCE of 22%) and EBIT margin 12.5%. The shares are trading on 15x Dec 2023F, dropping to 13x Dec 2024F.
Opinion: This has been an excellent long term performer, rising by almost 5x versus 10 years ago. I always thought that this business was low growth and a bit dull – but now Greggs strikes me as a company I should have looked at a decade ago. I can imagine there will be plenty of more exciting stocks that do worse over the next few years.
Bruce Packard
Got some thoughts on this week’s commentary from Bruce? Share these in the SharePad “Weekly Market Commentary” chat. Login to SharePad – click on the chat icon in the top right – select or search for “Weekly Market Commentary” chat.
Notes
The author owns shares in Argentex
* The most recent Tesco Annual Report says that lease liabilities have ‘escalation clauses’ which: “are in line with market practices and include inflation-linked, fixed rates, resets to market rents and hybrids of these. In prior years, the Group entered into several joint ventures, and sold and leased back properties to and from these joint ventures over 20 to 30 year terms. On certain transactions, the Group has an option to buy back either the leased asset or the equity of the other party, at market value and at a specified date, typically at year 10.”
At the moment Tesco lease payments are falling, but that text suggests that there could be upwards adjustments in future. Banks have also done ‘sale and leaseback’ deals with their branches and head offices. I’m cautious that this type of financial engineering creates value for shareholders, it seems to be done by management who are under pressure.
This article is for educational purposes only. It is not a recommendation to buy or sell shares or other investments. Do your own research before buying or selling any investment or seek professional financial advice.


Weekly Market Commentary 10/10/22 |IPX, SDRY, TSCO, AGFX, GRG| Coping with drawdowns
Bruce updates a chart Terry Smith first published in the FT in 2014, looking at Tesco EPS progress versus declining Return on Capital. Other companies featured IPX, SDRY, GRG and AGFX.
The FTSE 100 recovered to just above 7000 last week and the pound recovered to 1.12 to the dollar. The Nasdaq100 and S&P500 rallied c. +4.5% while the US 10Y Govt bond yield was 3.85% and the UK 10y gilt was 4.22% versus 3.0% a month ago. Brent crude rose +12% during the week to $93 per barrel as OPEC plus members said they would cut production by 2m barrels a day, roughly 2% of global oil consumption.
Portfolio review
I am down -30% YTD (ex-cash balance), versus AIM -33%. I didn’t sell anything in H1, though I did take some profit in Impax AM last year, as the shares had increased by 30x. Unless I believe a share is significantly overvalued, I won’t sell and just suffer the paper loss in drawdowns. That approach means the damage has been done by my long term “buy and hold” positions, which had grown by the start of the year to be significantly concentrated in my top 5 largest holdings.
Impax AM, a top 5 holding and my worst performer is down -63% YTD to 540p. That seems harsh given that Impax AM said last week they’re still seeing inflows of £606m in the quarter to September. Assets under Management (AuM) fell by -4.1% over the last 12 months. The share price reaction -45% in the last 12M and -63% YTD disagrees, so in retrospect, I should have sold the entire position and paid the CGT.
Similarly, Games Workshop another top 5 position is down -40% YTD to £60. Both companies report high profitability (Impax 26% RoCE, Games Workshop 59% RoCE, each 3 year average) but do not always generate smooth revenue progression. Whenever investors believe growth will slow, the high valuation tends to be punished with a steep sell off.
If you’re going to do low-frequency, buy-and-hold investing then i) concentrating on companies with sustainably high RoCE makes sense ii) you’ll see large paper losses when investors fret that growth and/or profitability could disappoint. Only in Excel spreadsheets is growth a constant, so it follows that over a long enough time horizon ii) is inevitable.
Those observations are backed up by the data. Christopher Meyer has analysed Hundred baggers and points out that most quality ‘multi-bagger’ stocks suffer 50% or greater drawdowns. Amazon, -28% YTD, is the most famous example, falling 95% following the internet bubble bursting. Looking at the Amazon share price chart in log scale shows it has had a >20% drawdown in 19 of 25 years that it’s been listed. Apple since it listed in 1980 has seen an 80% decline peak to trough, twice! Meta is down -59% YTD, so “poor” Mark Zuckerberg has lost around $70bn – though he’s still one of the top 500 richest people in the world.
I mentioned Superdry -58% YTD last week had fallen from a peak above £20 at the beginning of 2018 to £1, and to keep an eye out for retailers who are starting to see a top-line recovery. SDRY reported on Friday, revenue growing at +9.6% and they expect the recovery to continue FY 2023. The shares are trading on below 5x PER Apr 2023F. A way to play the potential recovery, in my view.
I can understand if investors can’t stomach paper losses from large drawdowns, so an alternative is to use Sharepad’s “Alarms” tab to tell you when a stock has fallen by X amount. You can apply the same alarm to a single share or list of shares (ie your portfolio). The default is a 5% fall as a stop loss, but it’s easy to customise it to a decline that suits your trading style. There’s a whole suite of other alarms that you can set, although I tend to keep things simple.
This week I look at currency trader Argentex, which is raising guidance helped by volatility in markets and Greggs, famous for its sausage rolls. But I start with Tesco because it fits into my theme of why buy-and-hold investors ought to look for companies with sustainably high profitability.
Tesco H1 results to end August
I noted last week in my sector review how badly FTSE 100 supermarkets had done, so I was curious to see what has gone wrong. Households are still buying food, if anything the rising cost of living might encourage shoppers to switch to supermarkets’ own labels, away from Heinz Baked Beans or Unilever brands like Hellmann’s mayonnaise. Yet Unilever share price is flat YTD, while Tesco is down -31%. I’ve used Sharepad’s multigraph feature to show over the last decade, the divergence in performance is much larger, with supermarkets (Tesco in red, Sainsbury in black) down c. -50% versus Unilever (blue) +70%.
Tesco reports sales excluding the fuel that it sells through its petrol stations. Rising petrol prices meant those sales rose +39% in their H1, but rising energy prices is not something that management control so it is adjusted out by the company. Group sales on the company-reported basis were up +3.1% to £28.2bn for the H1 to the end of August. Like-for-like retail sales were up less than +1% in the UK, +10% in Europe and +14% at Booker. Tesco bought Booker, which owns Budgens and Londis and was a wholesale supplier to other convenience stores in 2017 for £3.7bn. Interestingly they say that online like-for-like sales declined by -11%, as customers returned to shopping in their stores. Online sales participation was 13%, which is still +3.6% higher than before the pandemic.
The supermarket’s adjusted operating profit was down -10% to £1.3bn in their H1, and there was a £626m non-cash charge for impairment of assets. The operating margin, after adjusting for fuel sales and the impairment charge, was just 4.0%. Below the line in ‘other comprehensive income’ there was a further £2bn charge for the remeasurement of the pension deficit. Most of Tesco’s pension obligations are now in surplus on an IAS19 basis (£1bn surplus recorded on the asset side of the balance sheet, £242m deficit on the liability side) but values still swing around based on assumptions and performance of pension plan assets.
The £626m impairment is because Tesco has sold-and-leaseback some of its stores, and now that discount rates are rising, the reduces the value of those assets and corresponding liabilities. This article from 2015 suggests that the sale and leaseback contracts with British Land were linked to inflation. That makes me cautious of the idea that supermarkets are now beneficiaries of rising inflation. Net debt including £8bn of lease liabilities was £10bn, or 2.5x EBITDA. If Tesco had kept the freehold on their properties, then I think they’d be better positioned, or at least the movements in the balance sheet and charges through the p&l would be easier for investors to understand.*
Net finance costs were a further £325m, around half of which was paying lease liabilities and a third of which was debt service cost. The debt service cost was flat, but the cost of lease liabilities fell -9% to £189m. I couldn’t find any explanation of the sensitivities. Staff costs are obviously rising, particularly lorry drivers. Statutory PBT, which includes the £626m non-cash lease impairment, was down -64% to £413m.
There’s also Tesco Bank, which was set up in the 1990s, from memory it was a JV with the Bank of Scotland. There was much excitement at the time that new entrant supermarkets would take market share from banks, and their superior data analytic skills (Tesco owns DunnHumby, the data science business started in a kitchen at Chiswick) would generate better deals for customers and higher profits for shareholders. 25 years later Tesco Bank reported revenue of £540m in H1, and PBT of £60m. The bank has £6.8bn of loans, and £5.5bn of deposits – for context it’s about 70x smaller than Lloyds Bank’s loan book.
Tesco has been and still is, under pressure from the rise of the German no-frills supermarkets, Aldi and Lidl, in an escalating price war. This price war has lasted a decade, and last week’s results show no signs that a cease-fire will be declared. Even before that though, there were reasons to be cautious on Tesco, as outlined by a certain Terry Smith in this 2014 letter to the FT. The former banks’ analyst pointed out that though valuation is superficially attractive, EPS growth had been achieved with rising net debt and accounting gimmickry. Notwithstanding the aggressive accounting which Tesco was later forced to re-state, RoCE had fallen from almost 20% in the late 90’s to 12% 15 years later. I’ve used Sharepad to recreate Terry’s original 2014 chart showing EPS (black line) rising but RoCE (green bars) falling.
Below is the same chart, but updated for the most recent decade. I’ve used adjusted EPS, because Tesco’s reported EPS in 2015 was -80p, when they reported a £5.7bn loss and restatement prior years, which throws the scale off.
The chart shows that despite the ‘kitchen sink’, which included accounting restatements in 2015, RoCE has not risen above 10% since 2012, hence although EPS has now recovered to 20p FY Feb 2022, this has not created value for shareholders. More capital is being employed to generate lower returns. The low RoCE figure explains the decades-long divergence of the share price with Unilever: 3-year average RoCE of 21.4% according to Sharepad.
Data analytics: Tesco owns Dunnhumby, which analyses Loyalty Clubcard data. The insights generated have failed to help Tesco achieve any competitive advantage though. The subsidiary was put up for sale in 2015 with Goldmans, Tesco’s adviser, optimistic £2bn valuation. The sale was scrapped when WPP was the only bidder left, willing to pay c. £600m. The sale process revealed that rather than helping Tesco achieve higher profits, Dunnhumby was instead generating profits by re-selling insights gleaned from Tesco customers’ data to consumer brands like Coca-Cola and Diageo.
Valuation: Tesco is trading on 9x Feb 2024F and Feb 2025F PER, suggesting the company is low growth. However, the 3 year average RoCE is 6.1%, implying that unless RoCE improves, increases in EPS would not drive a re-rating higher. We can also see that in the de-rating of Price/NAV and Price/Turnover, in the chart below.
Opinion: The shares are not expensive on a PER, but I think the company is a cautionary lesson. Low RoCE companies can stay low returning for decades, despite the best efforts of management to improve returns. A company that can maintain RoCE at 20% and grow at +6% per year is worth a much higher PER multiple than a company with 6% RoCE growing at +20% a year. Buffett has summarised this as ‘a good company at a fair price, rather than a fair company at a good price’.
None of this is an exact science though, there are trade-offs and it is possible to drive too hard in the opposite direction. In the late 1990s Lloyds Bank found itself in a strategic cul-de-sac after Brian Pitman focused too much on ‘shareholder value’, Lloyds reported 40% RoE, but such a high hurdle rate meant it had few strategic options. Lloyds had underinvested in core systems and faced competitive pressure from HBOS and Northern Rock, and never recovered its level of profitability even after the financial crisis. Drawdowns of high RoCE company imply that once things start going wrong, profitability will never recover. In the case of Apple this was false, but for Lloyds it was true.
Argentex trading update FY Dec
This currency trading company that is in the middle of changing year end from March to December, put out an update for 6 months to September. Revenues for the old half-year split (Apr-Sept) were up +75% to £27.4m, and were up +58% 9M Sept v 9M Sept last year to £36.9m. The year-end change means that Sharepad’s “Forecast” tab may contain estimates based on a combination of the old and new year-end, so may not be reliable. Singers, their new broker, were forecasting FY Dec 2022F revenues of £39m, simply doubling of H1 (Apr-Sept) of £27.4m would imply £55m FY revenue, so management are confident that they will exceed those old forecasts.
Oddly, the number of actively trading clients actually fell to 1,393 versus 1,624 at the FY to March. That figure was up +12% on H1 last year. Given the FY clients numbers is consistently larger than the H1 figure, I think that means that they have ‘active’ clients who trade just once a year? AGFX do say in the FY statement that their top 20 clients constitute 36% of revenue, implying that the other 1000+ clients don’t generate much revenue at all. I’ve gone back and graphed revenue per client by half year, and we can see that this half (Apr-Sept this year, I’ve called H1 2023) revenue/client £39K, is up +55% versus H1 last year. That does seem to have been particularly busy compared to recent history.
For context Alpha FX, with forecast FY Dec 2022F revenues of c. £100m reports £66K revenues per client in their Risk Management division. It could be that AGFX has signed up lots of low value clients, but I prefer the company’s explanation that it takes time for their customers to give them more business.
Forecasts: It’s important to remember though that the former broker’s (Numis) original forecast was for 12p of EPS in Mar 2022. Management then changed their financial year end, they claimed to help with H1 v H2 seasonality. The changed year end has also muddied the waters in terms of the size of the downward EPS revision: presumably not an unintended consequence.
Readers will know that I’m sceptical of broker forecasts, because they tend to come from discussions with management, and reflect an extrapolation of current conditions which can change quickly. This is particularly true in financial markets businesses, where short-term volatility is not something management can control. Last week’s RNS does say that sterling weakness created “exceptional short-term trading conditions”. Thus, it’s worth asking to what extent September’s volatility drew forward revenue into the present? Could we see a lull in activity in H1 next year?
Valuation: I haven’t seen Singers new forecasts, but I’m going to conservatively use their old forecasts even if there’s likely to be upward revisions. Before last week the broker was expecting EPS of 6.4p FY Dec 2023F, then rising +58% to 10.1p the following year. That would imply a PER of 16x next year, dropping to 10.4x 2024F. In my view 10x PER seems good value versus the high historic RoCE achieved (32.7% 3 year average).
Opinion: This seems to me an example of a company with high profitability, suffering a >50% drawdown peak to trough, as investors worried that returns weren’t sustainable. I bought earlier this year and increased my position in July as I thought most of the bad news was already priced in and rivals AFX and EQLS were benefiting from favourable conditions. The chart looks like a nice bowl so I’m a happy holder.
Greggs Q3 trading update
This food retailer with 2,200 outlets across the UK said total sales were up +14.6% Q3 (July-Sept) v Q3 last year. Results would have been even better if they hadn’t closed for 19th September, the Queen’s funeral.
This is an example of a company that ought to have been defensive, the balance sheet is mainly tangible assets (£355m of property and of fixed assets, plus £271m of leased properties). No debt, shareholders equity was £392m versus net cash of £146m at H1. That’s after paying a 40p (£41m) special dividend in April. There’s a small IFRS pension deficit (£2.4m as of FY Dec 2021) and the company is making £2.5m (c. 1% of PBT) of contributions each year from 2022 to 2026.
Outlook: They’ve opened 90 new shops net YTD (106 opened, 16 closed). The outlook statement is encouraging saying that they continue to trade well, and cost inflation of +9% on a like-for-like basis is inline with previous guidance.
Yet the shares are down -45% YTD. I’m wondering if the concern is that Work From Home is bad news for high street food retailers? The +9% like-for-like sales growth just reported suggests that’s WFH isn’t having much impact though. A different bear case is that as people struggle with the cost of living, they will cut back on small discretionary items like a Greggs sausage roll.
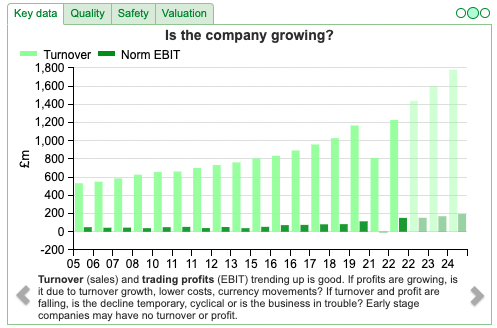
The pandemic did cause a -31% decline in revenue and a £13m loss, but that seems genuinely exceptional. The ability to use Sharepad to quickly go back and check what happened to revenue and profits in a ‘normal’ recession 2007-2010 is invaluable. As the table below shows, profits were flat but revenues kept rising. That suggests to me that the shares are reasonably recession proof and the sell-off is probably overdone.
In fact, management see an opportunity to expand its UK estate to at least 3,000 shops, presumably helped by attractive property lease deals as landlords struggle for tenants. Greggs have increased the rate at which they are opening in new locations given the increased availability of good sites. For instance, they now have stores on the Strand and Leicester Square.
Valuation: Sharepad’s quality tab tells a reassuring story on profitability (RoCE of 22%) and EBIT margin 12.5%. The shares are trading on 15x Dec 2023F, dropping to 13x Dec 2024F.
Opinion: This has been an excellent long term performer, rising by almost 5x versus 10 years ago. I always thought that this business was low growth and a bit dull – but now Greggs strikes me as a company I should have looked at a decade ago. I can imagine there will be plenty of more exciting stocks that do worse over the next few years.
Bruce Packard
Got some thoughts on this week’s commentary from Bruce? Share these in the SharePad “Weekly Market Commentary” chat. Login to SharePad – click on the chat icon in the top right – select or search for “Weekly Market Commentary” chat.
Notes
The author owns shares in Argentex
* The most recent Tesco Annual Report says that lease liabilities have ‘escalation clauses’ which: “are in line with market practices and include inflation-linked, fixed rates, resets to market rents and hybrids of these. In prior years, the Group entered into several joint ventures, and sold and leased back properties to and from these joint ventures over 20 to 30 year terms. On certain transactions, the Group has an option to buy back either the leased asset or the equity of the other party, at market value and at a specified date, typically at year 10.”
At the moment Tesco lease payments are falling, but that text suggests that there could be upwards adjustments in future. Banks have also done ‘sale and leaseback’ deals with their branches and head offices. I’m cautious that this type of financial engineering creates value for shareholders, it seems to be done by management who are under pressure.
This article is for educational purposes only. It is not a recommendation to buy or sell shares or other investments. Do your own research before buying or selling any investment or seek professional financial advice.