
Lets face it we all want to ride a big trend. We’d be crazy not to. In this article Jason Needham looks at the trailing stop to see how much trend we can capture by comparing a few methods.
If you plan to ride a trend then you’re going to need a trailing exit to close the position when the trend ends to lock in the returns.
Before we jump headfirst into the trailing stop I’ll just cover a few of the moving parts that make up the method we call trend following.
Trend Following
Trend following can mean different things to different people. For me personally I aim to capture a trend from an early breakout signal so I’m going to enter where a trend starts for my style and I’ve covered this previously in the article How to identify breakout stocks. I like to buy breakouts. I like to study charts and trade the price action. Other methods like time series or cross sectional momentum are very common and I do use them in my stock filtering process but at the right hand edge where the rubber meets the road my primary method to get onboard a potential new trend is to buy breakouts. Its clean and simple.
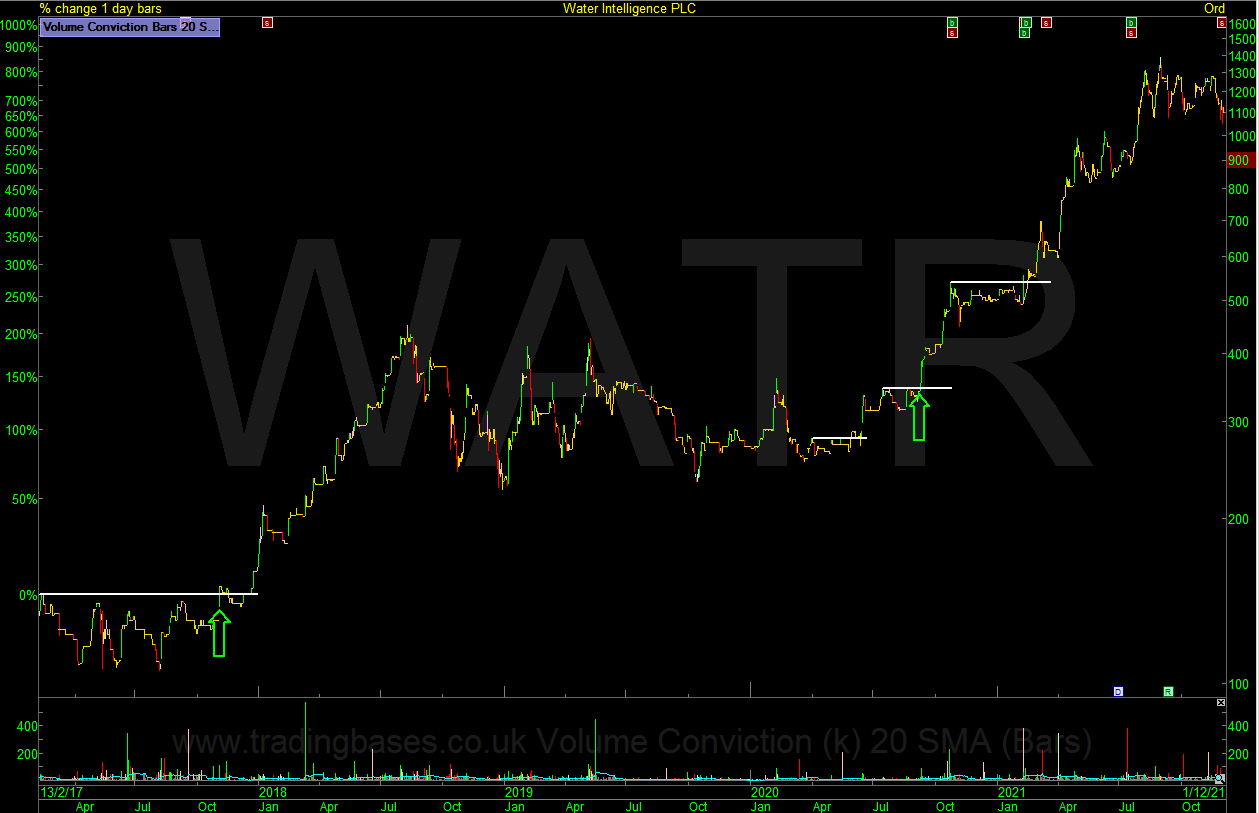
Water Intelligence PLC – Clean entries where I got onboard the trend. (Log Scale)
Why Trend Following?
The simple answer is before trend following my trades didn’t have a robust exit strategy. It was a short period where my OCD really struggled with the randomness of exiting a good trend on a whim caused by some noise in the markets or opinions in the press. The solution was to study the good trends from past with the view to catching a respectable percentage of the move in the outliers. Job number 1 of trend following is to capture the outliers.
What Defines an Outlier Trend?
An outlier is a large value in the data set so when it comes to investing it’s going to be a winner that is many times bigger than the average winner. As an example using “R” multiples your risk is 1R and an outlier will be maybe 8R or more. 8 times your initial risk. This will be personal to your own results.
The Affects of Noise
Before we move into the technicals of trailing I want to cover the psychological problems that can lead to random exits. Most stock coverage is just chatter. It might be meaningful for one person’s timeframe or methodology but it’s not going to be much help to my own. We all move in different lanes. If a downgrade or director sell puts pressure on the stock or a newspaper says take profit for whatever reason the trailing stop will let me know if it’s just noise or something more meaningful for my timeframe. There are three possible outcomes to this scenario. Short term noise and the stock keeps trending, meaningful noise and the trailing stop is executed and lastly the third outcome which is the most destructive of all but for a very different reason, the whipsaw where the short term volatility signals your exit and the stock shakes it off and continues on its trend. We will cover whipsaws later in the article.
The price action in the chart incorporates all news so can we turn off the news and capture a piece of the trend regardless using a robust exit strategy? Yes we can. It’s actually easier to trade my plan since I turned off all stock related media and commentating over a decade ago. If the news moves the stock enough to hit my exit price I close the position as the trend is over for my timeframe. Does guessing the effect of news and front running the stop help? It might save me a little if I guess right but cost me a huge amount if I exit and the stock trends into the distance without me. It would add a degree of randomness to what is essentially a very simple process. The point of the trailing stop loss is to capture a piece of the move. It’s not about being right or wrong on the individual position. The results are found in repeating the process over and over to execute my edge.
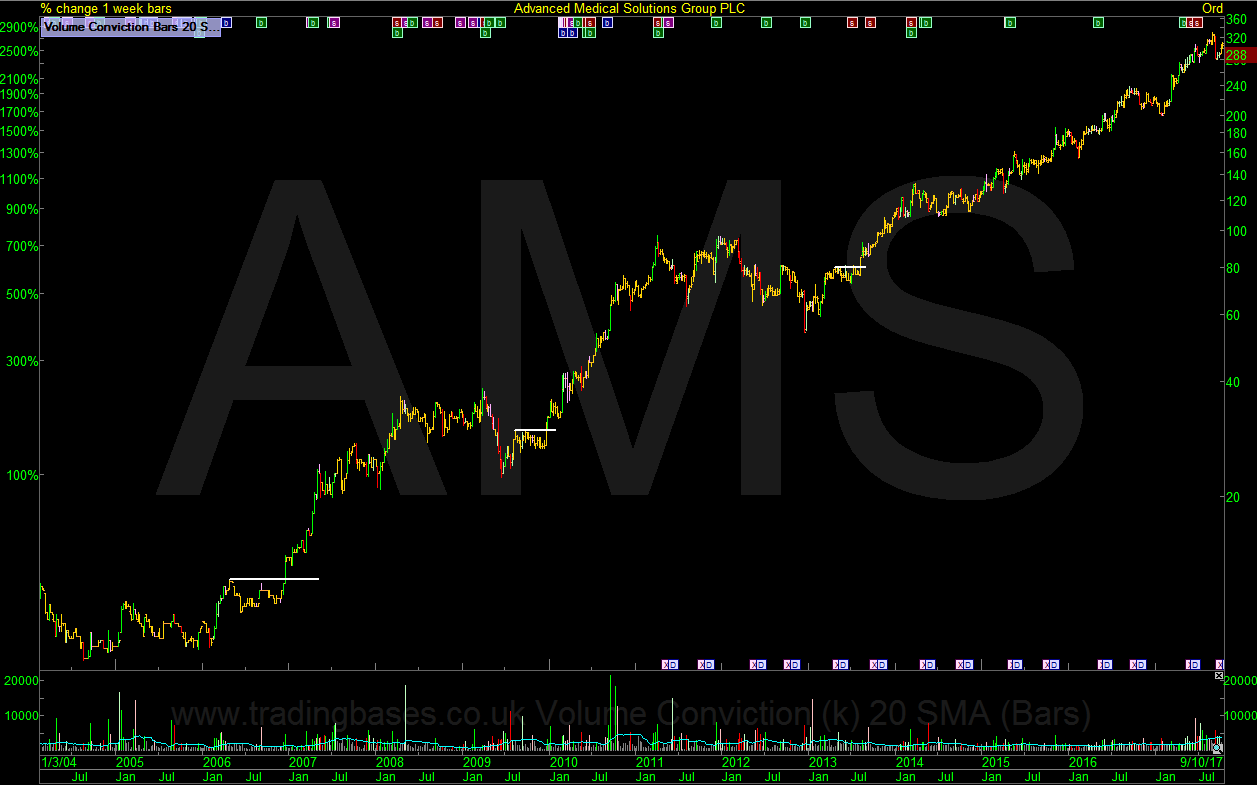
I’ll use AMS as an example as this is a stock that I managed really well considering the negative noise it generated from the media. It made three strong trending runs on my time frame. It was overvalued from the initial breakout according to the commentators and the reasons to sell got louder and louder the higher it went. The trend was literally peppered with negative news flow but regardless of the chatter a simple but robust trailing method managed to exit the stock flawlessly capturing a respectable piece of the trend when the time came. This is how it should be. Clean and simple. I’m not going to say it’s easy as we have something between our ears that likes to watch the market far too closely and overthink the stocks every move. For a stock to trend from 100 to 300 it has to trade through 200 on the journey. You will never capture an outlier if you cannot leave the stock alone as in your head you will want it to travel in a perfect diagonal accent but in the real world it’s going to the scenic route.
Advanced Med Solutions Group – The price action incorporates all news. (Log Scale)
Big Outlier Trends Take Time
To capture an outlier you need to block out all distractions. Being more bullish won’t speed up the process. Study historic charts and see how long they take to play out. Once you have a journal of past trades you will have the data needed and this in turn will help with the psychology of letting your winners run. The more you study past winners the easier holding your winners will become. For new investors boredom is the biggest barrier to winning.
Trailing Stop Methods to Consider
I’m going to run through a few methods using Donchian channels available in ShareScope / SharePad in this article. Donchian channels are widely used as trailing stops and I’ll give a few opinions of my own that might help you in your research.
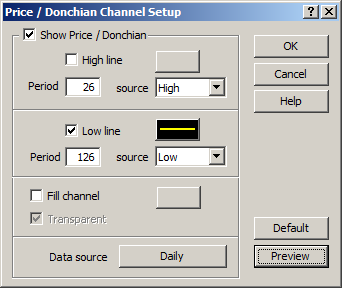
Method 1, Donchian channels – 6 Month Low Trail
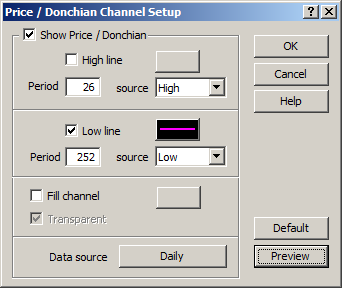
Settings for ShareScope (I’ve used 126 trading days so the channel updates daily)
Water Intelligence PLC – 6 Month Donchian Channel Low Trailing Method. (Log Scale)
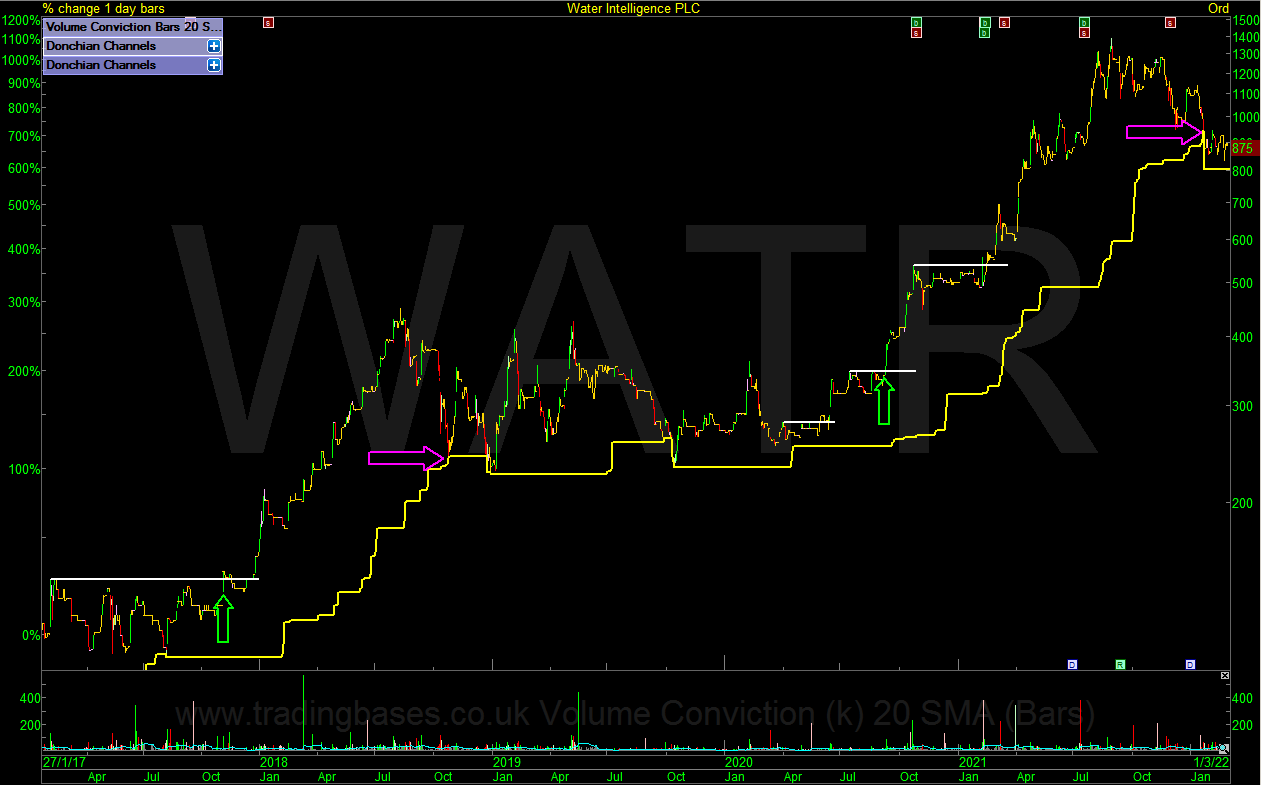
The 6 Month Low Donchian channel is fairly loose and gives the position lots of room to breathe. I like the term coined by Jerry Parker “loose pants” as it perfectly describes the looser settings used for capturing primary trend moves so give it a try on different markets and stocks to get a visual of it in action. Volatile markets or stocks can be hard to capture so loose pants settings can help ride out the volatility.
Method 2, Donchian channels – 52W Low Trail
Settings for ShareScope (I’ve used 252 days so the channel updates daily)
Water Intelligence PLC – 52W Donchian Channel Low Trailing Method. (Log Scale)
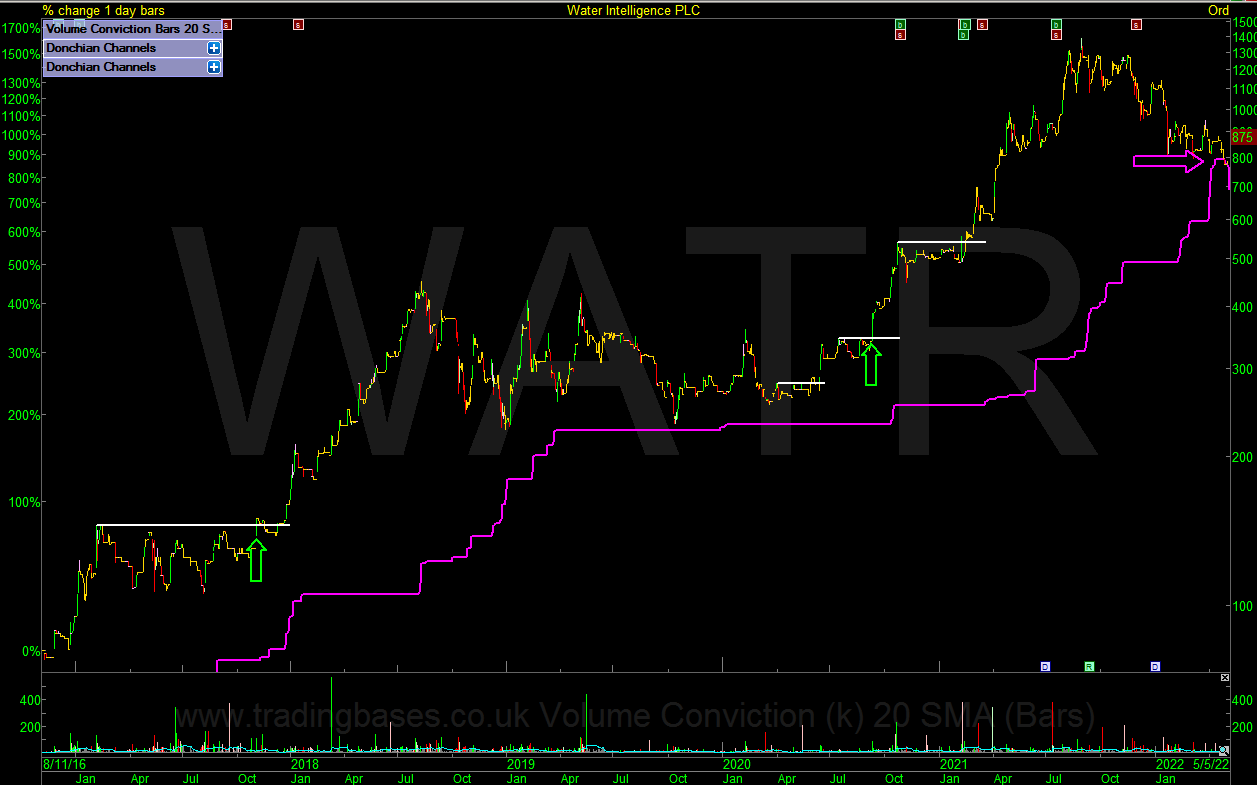
The 52 Week Low Donchian channel is very loose. For my own style the volatility across the whole portfolio gets a little high with the extra risk to stop distances and being mainly a long holder of stock’s I don’t have the short positions to offset the volatility. For the investors out there its worth studying to see if it helps plug some leaks in the portfolio. Plotted on the WATR chart you will see the position survives the 2 Year consolidation phase. I call 52 Week lows the last chance saloon as all those ugly stocks that were once favourites before taking the elevator back down had a short stay at the last chance saloon where the exit door could have been taken.
Method 1&2, Plotted on Adavanced Medical Solutions (Log Scale)
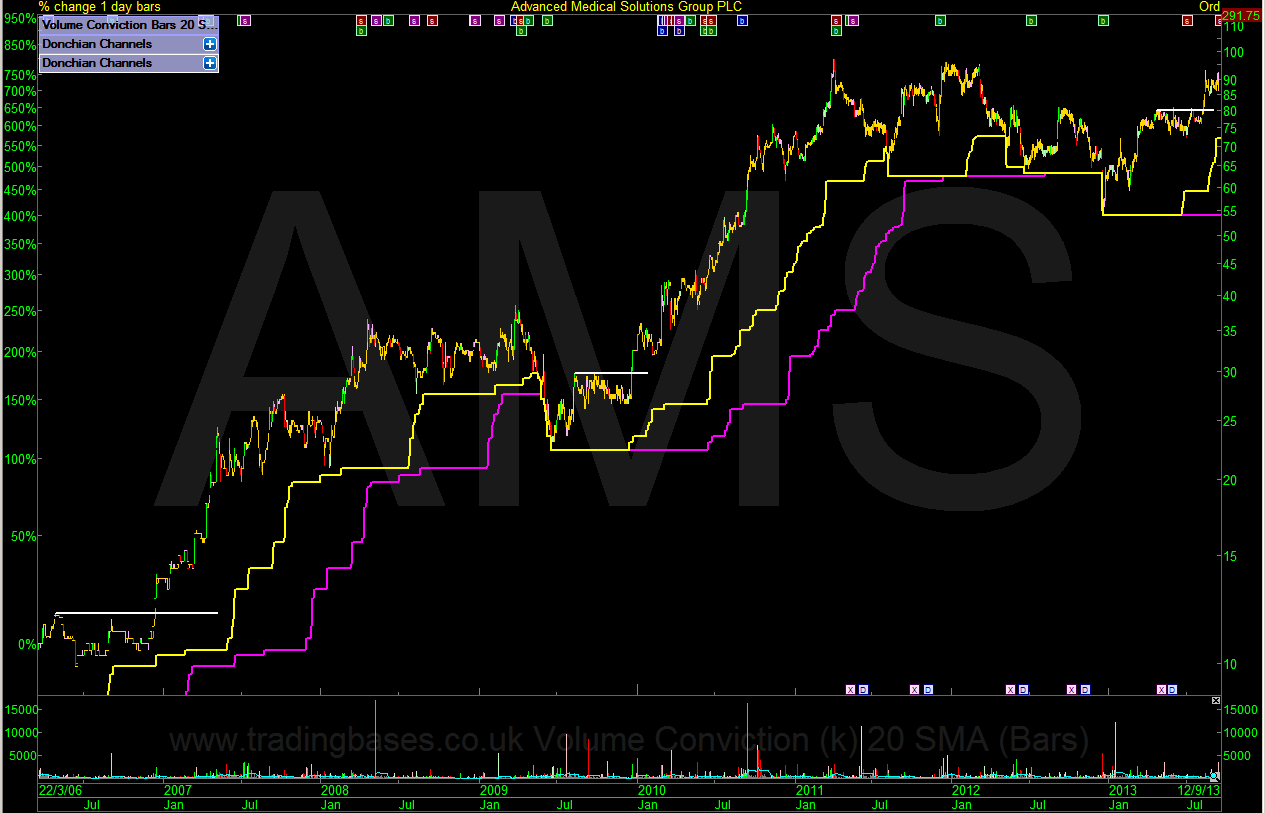
Using the same two methods on AMS you can see that the risk to stop of the purple 52 week low channel is more than double that of the 6 month low channel in parts of the trend and when you add together the risk to stop of all positions in the portfolio you will notice a huge difference in the risk to stop volatility of the whole portfolio. The exits capture a similar amount of the trend but the faster period frees up money quicker and that can be put back to work in new trends.
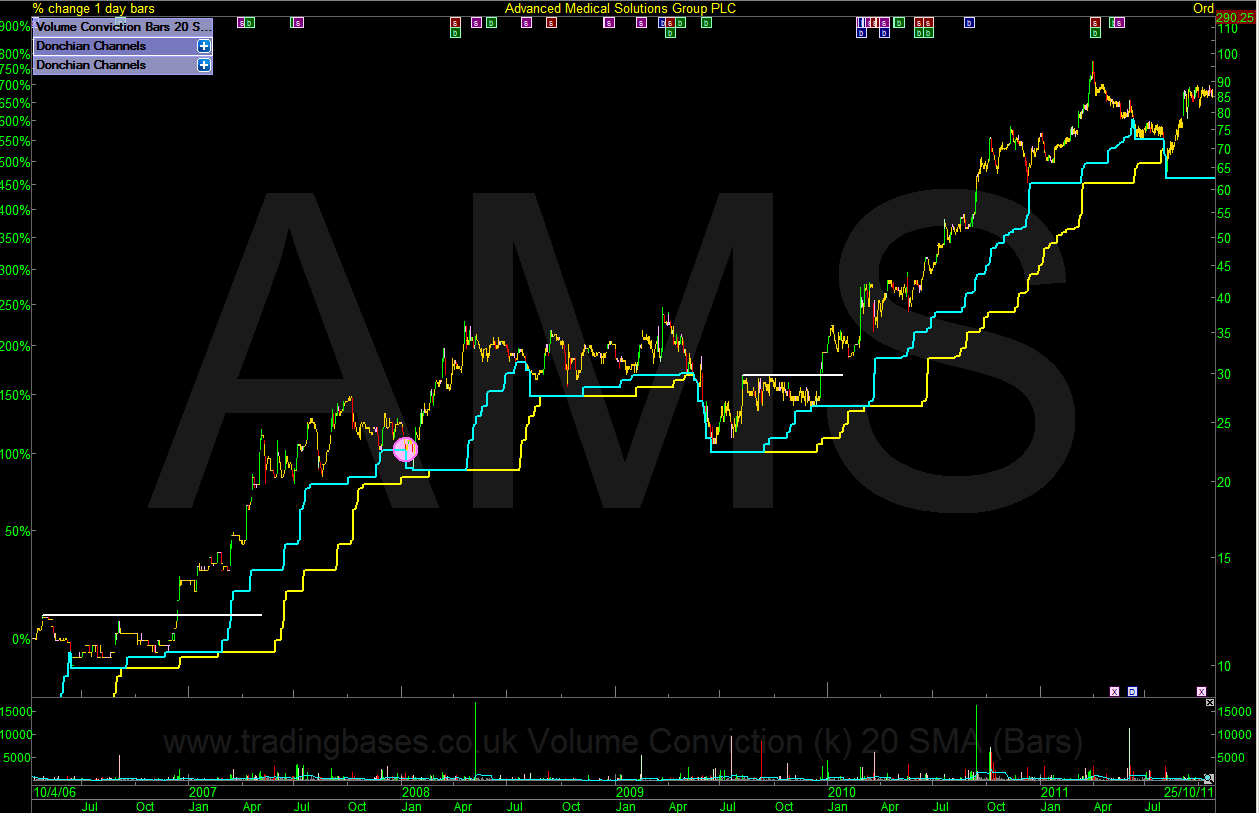
Method 3, Donchian channels – 3 Month Low Trail (63 trading days)
AMS with 3 Month lows in blue and 6 Month lows in yellow. (Log Scale)
Loose or tight?
Adding a tighter method using 3 Month lows starts to chop us out of trends sooner and this will start to change the time period of the whole system. What at first caught the big primary trends is now locking profits quicker and moving over to a secondary trend timeframe. It’s a sliding scale where whipsaws will become more prevalent.
Loose = less whipsaws and bigger outliers but on a slower timeframe with higher risk to stop volatility.
Tight = more whipsaws and smaller trends but on a faster timeframe with lower risk to stop volatility.
Both have their advantages and disadvantages. This is where your own trading psychology will start to develop as you find your lane of doing business. Understanding the game is key to trading the game plan.
The Destructive Affects of the Whipsaw
The whipsaw is so destructive as it has the ability to send you on a never ending curve fitting journey. You might start to fight with your exit signal in a battle between being right or wrong or you might start changing the stop loss settings which is like moving the goal posts so the ball doesn’t go in the net, obviously we want to limit how many whipsaws we get but we cannot eliminate them altogether. Methods that trade close to the noise like swing trading will have a lot of whipsaws and methods that trade outside the noise will have less but we will always have the whipsaw. If you have got this far into the article and you’re wondering what are the best settings then you need to go back and think again about the whole concept of what we are trying to do here. Perfection doesn’t exist. The key is to find a trailing method that captures a respectable amount of outliers for your preferred time frame and accept occasional whipsaws as part of the process.
Final Note
To end this article I thought I should mention a couple of strategies that are popular to capture a trend in price but have a different approach to entries and exits. We hear the term momentum used all the time but I wouldn’t class my own trend following style as momentum. With that in mind it’s definitely worth learning about momentum strategies as it can be useful in screening for technically strong stocks so I’ve added a couple of methods worth investigating below.
For Further Reading Regarding Momentum Strategies.
Time Series Momentum – Measures momentum by scoring the trend using multiple lookback periods for an individual product.
Cross sectional Momentum – Measures momentum on a basket of stocks over the same time scale with the view to being long the strongest and short the weakest.
Jason Needham
@stealthsurf
Got some thoughts on this latest article from Jason? Share these in the SharePad “Traders’ chat”. Login to SharePad – click on the chat icon in the top right – select or search for “Traders’ chat” chat.
This article is for educational purposes only. It is not a recommendation to buy or sell shares or other investments. Do your own research before buying or selling any investment or seek professional financial advice.


