
In this article I will dig a little deeper into buying breakout stocks and identifying stock breakout signals. I will share with you what I look for in a breakout from a technical, fundamental, risk-to-reward and time-to-reward viewpoint.
This article will include elements from all my previous ShareScope articles (which you can read here), which have formed something of a course on how I approach stock trading in a low risk/high reward way while avoiding the day-to-day noise.
Time to Reward ratio
When looking at a breakout the first filter I put the stock through is covered in detail in my article Stock selection and staying in lane. When buying breakouts I’m looking for price appreciation by riding a primary trend so I’m going to focus on small to midcap stocks. I can quickly scroll past any blue chips and most of the 350.
I can also weed out 95% of stocks from low-beta sectors (click here for an explanation on beta). I want the stock to have the ability to trend a long way to the beat of its own drum. In a perfect world my shopping list would be low to mid cap, low to medium float, orderly but inefficient price action and medium to high beta. When the stock breaks out I don’t want to be riding a snail.
Risk to Reward ratio
When viewing a candidate for the portfolio I need to run it through a risk assessment. The bracket I plan to position for needs to be looked at first from a reward viewpoint and second from a risk viewpoint.
Reward I use fixed fractional position sizing which lets me size for the normal volatility of the stock’s price action thus letting me trade high and low volatility stocks of any price without the problem of volatile stocks controlling the portfolio. When taking into account the correct bracket for the stock in question I need to ask if the reward is worth it. I want to be able to return multiples of my initial risk for the idea to be worth taking further.
Risk The downside of fixed fractional is high-priced lower-beta stocks will have tighter brackets and this will give heavier weightings which can lead to gap risk. Luckily these stocks are not where a growth investor like myself looks to ride trends but some smaller cap stocks might occasionally offer a very tight bracket that could result in a weighting that is unusually heavy. The reward will look fantastic but I need to keep the risk in check at the other end of the equation.
The Bracket – The bracket is my entry to exit distance. Where I am long – Where I am wrong.
Volatile high-beta small caps will naturally have wider brackets than low-beta large caps. The stock’s current bracket could be so loose due to recent volatility that it doesn’t offer reward so it fails the first check instantly. High-beta stocks usually have wider brackets due to their volatile nature and wider brackets means smaller weightings and this deals with a problem higher priced stocks have:, gap risk.
Questions about risk when position sizing breakout stocks
1. If the stock goes bankrupt tomorrow can I take that hit?
2. If the stock has a profit warning tomorrow and opens -50% lower can I take that hit?
If the answer to either of these questions is no I have two options. I can scale back the position size to take care of the gap risk so long as the reward still makes sense or I can dismiss the idea and move on.
Growth. Gas in the tank
When looking at fundamentals I’m looking for the best growth stocks that are emerging from early stage breakouts. I’m not interested in the story or the valuation. I’m not trading for a reversion to mean value. I want to ride a growth trend that has the potential to trend for months to years and this is found in the raw numbers. I’m going to be looking for earnings acceleration and earnings breakouts. The most aggressive I can find. I’m screening the whole market using ShareScope Pro datamining every evening and looking at every closing high on my time frame to find stocks that meet my criteria. A place where fundamentals and technicals will meet.
This daily routine is key to being in the right place at the right time. There is no luck involved. I’m not dwelling on big movers in the rear-view mirror hoping for a pullback and I’m not watching a stock on the back of a potential story, theme or opinion playing out. I’m turning up every day and existing where fundamentals and technicals will meet. Fundamentals give price a reason to trend and every trend will start with a breakout. This is where I need to exist.
Why use fundamentals?
The pure technical process of a breakout will happen in all stocks. All the best movers of the future will trade a breakout so many trend-following purists will question why I would use fundamentals.
The simple answer is there are thousands of stocks to trade so I need to filter that pool of opportunities down to a manageable size and I do that by filtering down for growth trends. Growth trends and price trends move hand in hand so it makes sense to me to trend follow both. This brings the pool of stocks down to a manageable amount. It’s not an exact science and it doesn’t need to be. I’m just looking for the best I can find at this point in time on a daily basis.
Not all breakout stocks are the same
Next I will highlight a few charting scenarios that could help or hinder the breakout process. There is no holy grail technical screen for breakouts that will filter out the best movers, avoiding the ones that are successful but taking some time to leave the breakout area, but there are a few scenarios that once we’re aware of we will know what to expect from the normal price action of a breakout so can allow for them upfront.
The Reverse Volatility Base & the Tightening Base
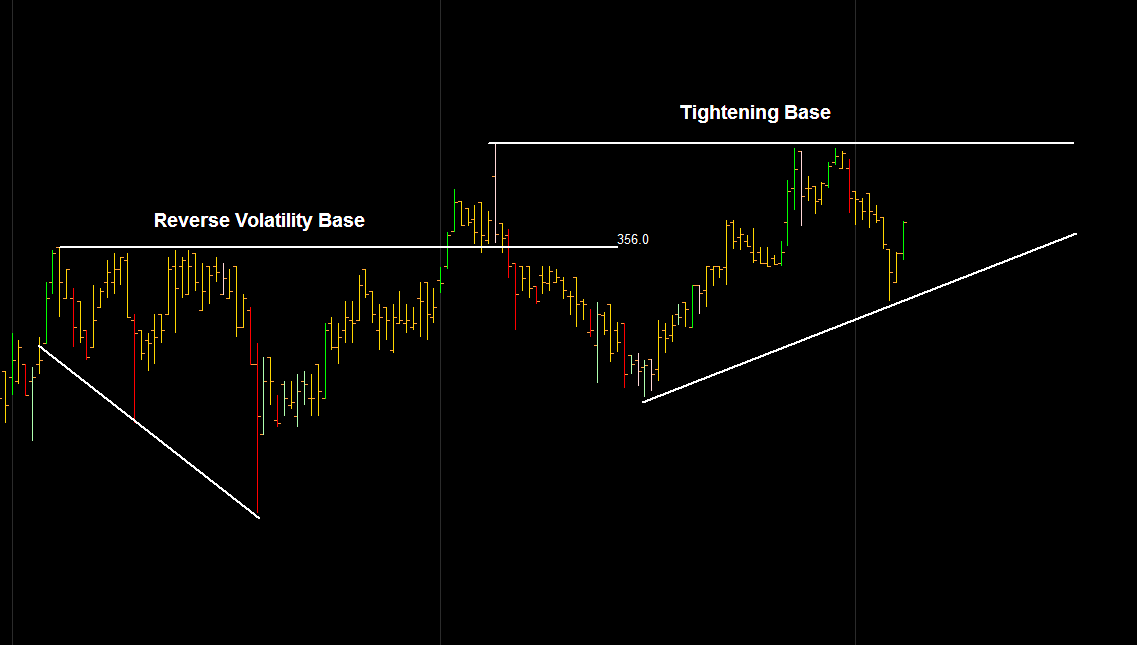
The Tightening Base
This is always going to be the preferred price action for me. As the buy and sell pressure starts to equalize and the swings get smaller it can act like a coiling spring. Tight ranges can only expand and when they finally do breakout they can trend very smoothly. Tightening and orderly price action is good action and will always be the number 1 go to pattern for me as a breakout buyer of bases.
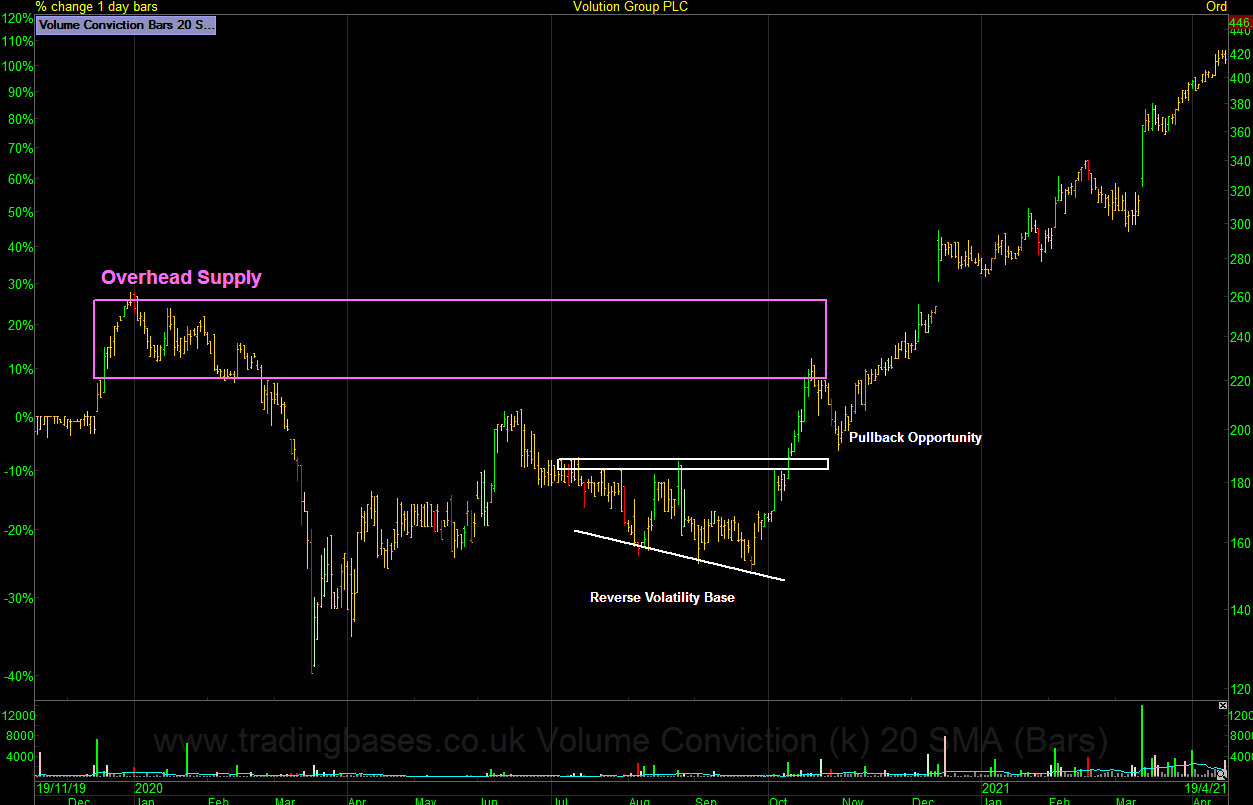
The Reverse Volatility Base
The opposite of the tightening base is what I call the reverse volatility base. Price is bumping against a breakout level but the swings are getting more volatile over time. This is actually quite common but extremely tough on the psychology if holding a position.
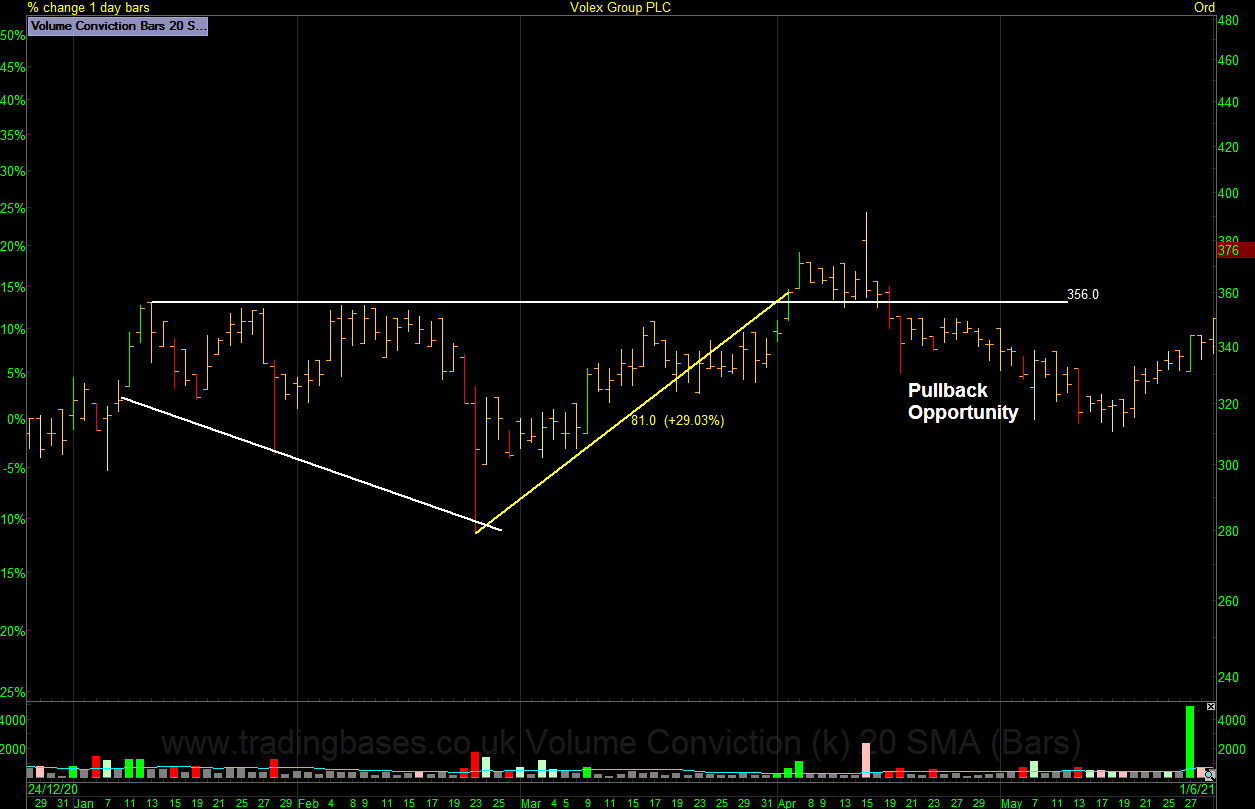
When a reverse volatility base breaks out it usually involves a big percent move from the prior low just to reach the breakout level and this can limit the power of the breakout move. A lot of these will pull back in early and offer a pullback opportunity. The pullback could be a hard retest deep into the base before moving back out. As with any entry method there is no holy grail high success method. My aim is to know what to expect and size for it win lose or draw.
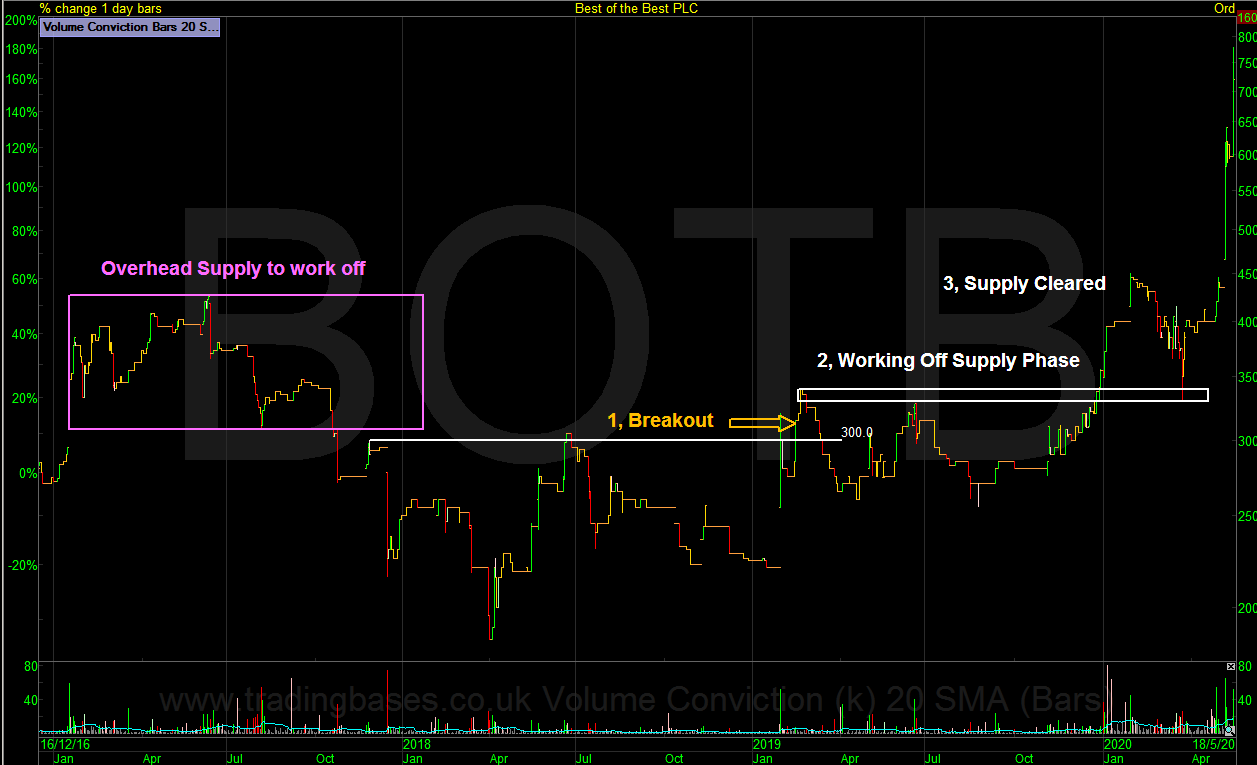
Overhead Supply
The best way to understand the resistance properties of overhead supply is to look back on a large losing position you once held that moved back up to a level where it was a small losing position before drifting back down again. If it moves back up to the small loss area again it’s probably going to be very difficult to hold that position much longer.
Everyone who bought BOTB in the purple box on the chart below and held through the down move went on that psychologic rollercoaster where a small loss or scratch trade feels like a winner. The supply this group of investors flood the market with takes time to work off. Supply has memory. Recent supply has more effect than historic supply in stocks. BOTB had multiple visits into the overhead supply band before finally leaving the area.
This is very normal price action no matter what the story is. If you’re aware of this before you get onboard a trend you can plan for the extra volatility or at least expect it so a breakout candidate with fantastic fundamentals might still make the portfolio rather than get dismissed altogether.
Breakout stocks are sometimes an event but usually a process
This is the most important concept to understand when using a breakout signal to get onboard a trend. There is commitment needed when executing a buy signal that few humans possess. Building a case using technicals and fundamentals for me is key to having the psychology to leave that thing alone without strangling the life out of it with creative stop loss techniques or overriding the position on a retest by pinning a new fundamental opinion on it.
Building a case is done when the market is closed and more importantly before I execute a trade. Once executed it’s in the hands of the risk management. The risk management knows that there is no such thing as the holy grail breakout filter that finds the best breakouts that trend strongly from day one. The risk management knows that many breakouts will dip back into the base and chop around sometimes for days to weeks before slowly melting higher. The risk management accounts for the volatility upfront by giving the breakout enough room to work over time as breakouts are sometimes an event but usually a process.
Final Note
Its about building a case. If you know what to expect from the opportunity in front of you and how the price action could unwind you can manage a position with ease. A stock with overhead supply is going to be a recovery candidate. This is potentially going to be a volatile area with wide loose swings in price action. Being early usually means dealing with a lot more volatility which doesn’t mean you make more money after position sizing to deal with the extra volatility.
There’s thousands of stocks to choose from and my job is to turn up every day and find the best that are leaving the station today.
Are you more into fundamentals or technical analysis, or a combination of the two? Leave your thoughts in the comments section below.
This article is for educational purposes only. It is not a recommendation to buy or sell shares or other investments. Do your own research before buying or selling any investment or seek professional financial advice.


Can we not use the tools in SharePad to identify these breakout types? Few probably have the time to examine chart after chart, looking for patterns.
Hi David. I use moving averages to filter for rising trends on the timeframes I’m interested in and also by looking through the closing high’s every evening. This brings the stocks of interest down to a managable amount. Doing this every evening means you get to know what stocks are consolidating and you can move them to a watch list from there.
Great article Jason. Tightening base breakout in the the form of Minnervini VCP is my go to pattern. There is no Holy Grail breakout screener like you say, simply a case of turning up every day and putting the work in. Thanks for sharing!
Great read.
Too true.
‘There is commitment needed when executing a buy signal that few humans possess.’