
Bruce digs out an obscure 1957 paper on growth investing, that Warren Buffett refers to when answering a shareholder question at his AGM and applies the thinking to the ARKK Innovation ETF. Plus PZC, MRK and AGFX trading updates last week.
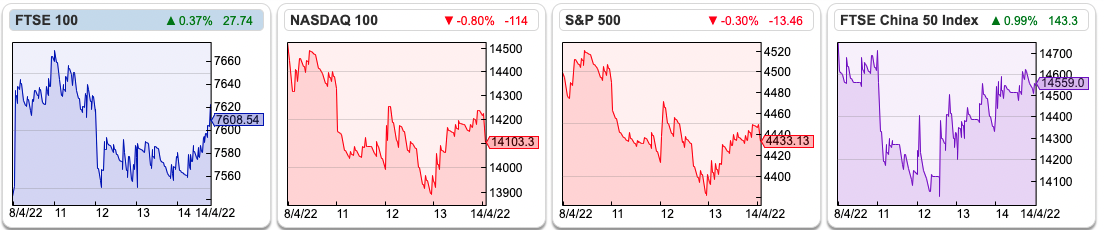
The FTSE 100 closed ahead of the Easter weekend at just above 7,600, that’s up less than 0.5% in the 4 day week. The Nasdaq100 was down -2% and and S&P500 -0.8%. The US 10y bond yield continued to rise to 2.70% versus 1.5% 3 months ago. The price of oil was up +8% to $109 per barrel (Brent Crude, most traded contract). Elon Musk made an offer to buy Twitter for $43bn (or $54 per share). Of course, he announced this on… Twitter.
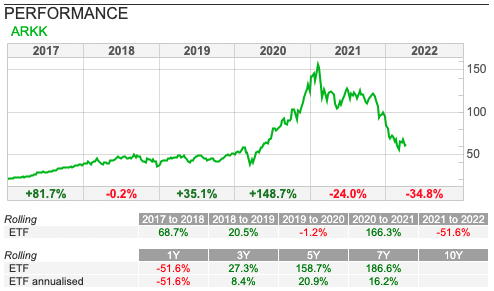
Cathy Wood’s ARKK ETF is now down -35% YTD. I couldn’t find anything she’d written on her blog more recent than this entertaining read from mid December last year: Innovation Stocks Are Not in A Bubble: We Believe They Are in Deep Value Territory. It’s easy to be critical, but I think the innovation wrapper for her ARKK ETF was really astute piece of financial marketing that worked well at attracting capital. Where I have doubts is around her valuation and risk management process.
Last week I came across a question on YouTube that a bright spark asked Buffett and Munger at a Berkshire Hathaway AGM. Annoyingly I can’t find it now. But the question was “how do you value stocks where the growth rate is above the cost of equity?”
Some explanation is required to understand what the question is really about. Normally when fund managers use dividend discount models to value companies they plug in a cost of equity (roughly 9%) as the discount rate into Excel. For pension liabilities, actuaries use a lower discount rate, the yield on AA rated corporate bonds (roughly 3% but rising at the moment). The lower the discount rate, the higher the future value of the cashflows – and higher the share price!
So a lower discount rate should be good for equity investors, though it has caused problems for companies with large pension obligations (De La Rue!). Cashflows from bonds and equities are not quite the same though, because bonds pay out their contractual coupon whereas with equities some (or all) of the cash is reinvested to grow the business. So the discount rates are different: bonds the discount rate is simply cost of debt. The discount rate for equities though is the cost of equity (circa 9%) less the reinvestment at the assumed future growth rate (CoE – G). The denominator in valuation equations from which broker target prices are derived. Mathematically the smaller the denominator is in a fraction, the higher the value, so higher growth increases the target price valuation. That agrees with common sense.
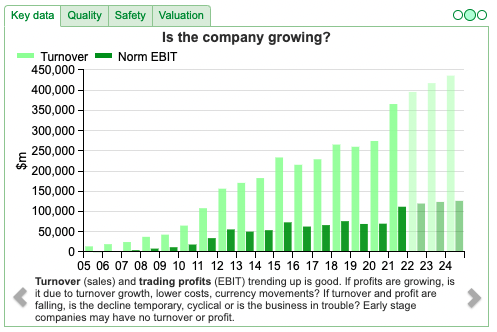
The question put to Buffett at the AGM, is what happens when Growth (G) is greater than the CoE, because your discount rate would be negative. Profits can frequently grow above the 9% CoE, Apple’s PBT compounded at an astonishing +91% CAGR between 2002 and 2012, helped by sales of the iPod, then iPhone then iPad, as the chart below shows. Assuming that high growth is sustainable in perpetuity (for an infinite amount of time) means that your valuation model gives you a headache.
Buffett’s answer was to refer to a paper by David Durand in 1957, on Growth Stocks and the St Petersburg Paradox. Given that this short paper had stuck in Buffett’s mind for 5 decades, I thought that it was worth digging out and I’d encourage you to read the whole thing, it’s only 6 pages.
If you haven’t heard of it before, the “St Petersburg Paradox” is a mathematical conundrum first put forward by Nicolaus Bernoulli in 1713 and presented to the Imperial Academy of Sciences in St Petersburg by Daniel Bernoulli. The Bernoullis considered a coin tossing game where there is a small chance that a player wins an infinite amount, and because even a very small chance multiplied by infinity is infinity: his future pay-off is infinitely valuable. But this offends common sense. People would (correctly) focus on the small chance of winning anything, rather than the small chance of winning an infinite amount.
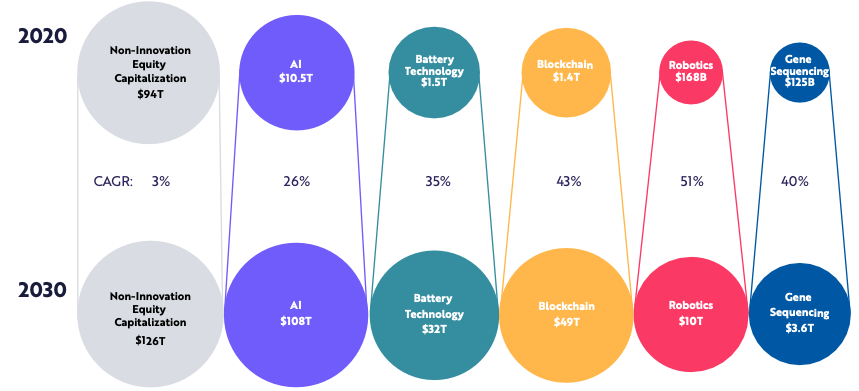
I think it’s also how Cathie Wood can justify holding on to highly rated companies in her ARKK ETF, because the upside is so large she thinks she doesn’t have to worry about alternative scenarios. Below is a slide from the 132 page ARK “Big Ideas” presentation, which is also used to justify her optimism on future growth (for instance “blockchain” growing at +43% CAGR to reach $49Trillion in 2030).
In the 1957 piece which Buffett refers to, Durrand applies this mathematical paradox to investing in growth stocks. Apple shows that a company that can be consistently innovative can maintain high rates of growth above its cost of equity for decades. If extrapolated this forever we should pay an infinite price for the shares! Mathematically rigorous but silly. You can see how that conclusion would appeal to The Sage.
This week I look at PZ Cussons and Marks Electrical trading updates, plus Argentex the currency trader’s profit warning. Following the recent sell off in the more frothy areas, valuations seem OK to me. Hence I’ve been putting some of my cash to work – but cautiously. I’ve been buying Nick Train’s Finsbury Growth & Income Trust and the most recent company I bought was Capital (CAPD) the mining services contractor.
Marks Electrical Trading Update
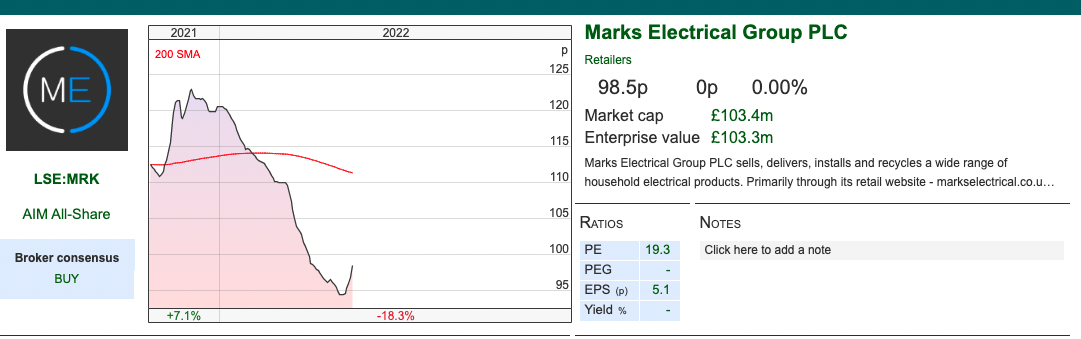
This electrical goods retailer put out a trading update for FY March 2022. Revenues were up +44% to £80.5m. They don’t give a PBT figure, but Adjusted EBITDA margin is 9%. Given that figure was 8.1% in H1, that implies H2 figure of 9.9%. Possibly that’s due to seasonality, the company IPO’ed in November last year, so we don’t have a dataset of H1 v H2. The trading update says that the margin improvement is driven by operational gearing, which could well be the case given the strong revenue growth.
History: Founded in Leicester in 1987 by Mark Smithson, the current Chief Exec. MRK offers 3,000 products from 50 brands of ovens, microwaves, fridges, washing machines, dryers, dishwasher and other electical items. All of the revenue is UK, they haven’t tried to expand overseas like AO world. They offer free next day delivery to more than 80% of the UK population for in-stock items, which is a unique selling point versus the competition. They do that through one distribution centre close to the M1. They have a small share of the total addressable market, which they put at £5.3bn of annual sales.
The company IPO’ed at 110p, raising £2.6m of new money, with selling shareholders receiving £25m. That placing price valued the company at £115m market cap on admission. There are no physical stores, 63% of sales were online last year, with the other 37% coming from telesales.
Outlook: Revenue growth was +19% Q4 v Q4 last year – which itself was a particularly strong period. Forecast growth +20% revenue next year and the year after which is much better than AO World.
Valuation: The shares are trading on 18x Mar 2023F, falling to 15x Mar 2024F P/E multiples. That compares to 18x Mar 2021 for AO World, which is then forecast to slip back into losses 2023F.
Opinion: This looks a good business that is doing the simple things well. Naturally there’s a threat from Amazon, but at the moment MRK seem to be taking share at the expense of physical retailers. We’ve seen that for fashion retailers like ASOS and BOO it is possible to benefit from buying behaviour moving online for a while, but as the market shifts they run out of competitors whose lunch they are eating. A less obvious threat is reliance on google not to change the algorithm, and also they rely on Trustpilot reviews: rated 4.8 for customer service, which is a market leading score.
Argentex Profit Warning FY Mar 2022
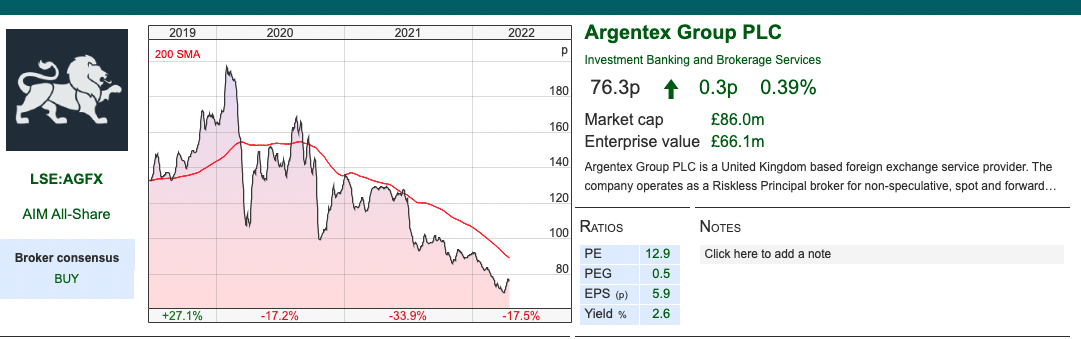
This foreign exchange company reported a trading update for FY March 2022 with revenues +23% to £34.5m (a 5% miss on the top line versus forecasts). That revenue growth, though still impressive, does also represent a slowdown from the +33% H1 v H1 reported in November. There is some seasonality as H1 contains Easter and August, whereas H2 contains December and March year ends, which tend to see increased corporate forex trading activity. Six months ago management were claiming a 40/60 H1/H2 revenue split which I cross checked using Sharepad’s “Quarterly” tab to discover prior to the pandemic the split was more like 48/52, which implied FY March 2022 revenue of £33m. Who needs broker forecasts or management commentary, when you can just figure things out for yourself with Sharepad?
The RNS says that underlying profit margins were “broadly in line” with 30.9% achieved last year. “Broadly in line” means “slightly below” in the peculiar language of trading updates. They don’t give a cash figure for the year end.
The statement talks of strong client demand, revenues growing in the Netherlands office and the Australian operation expected to launch in the current financial year. They also talk about a new interface / platform that they have trialled with a subset of customers, with positive feedback. The number of corporate customers rose +17% to 1,624. They’ve also made a couple of senior hires, and switched NOMAD from Numis to Singer Capital Markets.
The shares were off -6% to 74p on the morning of the results, which is just above the average price I bought at a couple of weeks ago. It’s worth bearing in mind that although the shares have reacted to reduced expectations, they had already fallen -25% since the start of this year. That is, it’s one thing for share prices to move downwards in anticipation of disappointment, but to sell off further when a “broadly inline” RNS is released suggests that “Mr Market” has double counted the reduced expectations.
History: AGFX IPO’ed in June 2019, raising £12m for the company and £32m for selling shareholders. The issue price was 106p, which valued the company at £120m market cap. Before that, the business was operating as a Limited Liability Partnership between the Beckwiths (property developers who made a fortune from the 1970s onwards), Harry Adams, Andrew Egan and Carl Jani – the latter was co-CEO but departed last year selling his c. 10% stake which has depressed the share price. Both revenue and profit doubled in the 2 years prior to the IPO, to £21m and £9.4m respectively FY March 2019. Almost all of the cash generated from operating activities (£17m) for the 3 years prior to the IPO was taken out by the partners and co founders. So, in effect existing shareholders could have financed the continued growth, but instead chose to come to the stockmarket for £12m of external funding and also cash out their holdings. That might sounds like an implied criticism, but having put their own capital at risk and spent several years growing a business I think that’s fair enough for entrepreneurs to IPO the company.
Instead, where I might quibble is that the rate of growth pre-IPO implies management were pushing very hard to get the best possible selling price. That in turn set expectations too high which means the share price performance since the IPO has been disappointing for a high RoCE business that’s growing revenue +23% a year.
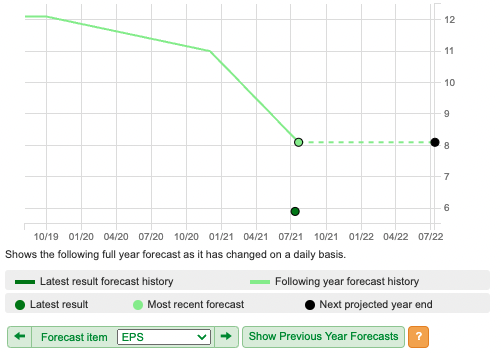
Sharepad allows us to track how expectations change through time (see chart to the left). The light green line below is the history of the EPS forecast. i.e. for Argentex the FY March 2022F EPS forecast has fallen from 12p to 8p (a -33% decline since the start of 2020 when, not coincidentally, the share price also began its decline). It makes sense that the share price would fall in line with the reduced expectations.
No forecasts available: I contacted the new broker, Singer and asked them to send me through what they’d written on AGFX. They sent me a regurgitation of the RNS, with no forecasts. It could be that they have not initiated on the company, or they have made forecasts but think Mifid II regulation means they can’t send me research with forecasts in. Given that previous broker forecasts haven’t been a good guide, I decided that we would do better without them.
Valuation: Previous forecasts were for +29% growth this year and +28% the following year, but I’m fairly confident those forecasts will be reduced following last week’s RNS. Even if that rate of growth is attainable, this year’s result is a 5% miss, which will make it harder to catch up for lost ground. Let’s assume +20% revenue growth, to £41m which would imply a price to sales ratio of 2.1x. The PER ratio is more difficult to forecast without talking to management, but assuming 9p of earnings March 2023F would suggest 8.5x Mar 2023F P/E ratio. That is less than half the forecast P/E for Equals and Alfa Financial Software.
Shareholders: Directors still own 19.6% of the company, of which 12.3% is the Chief Exec Harry Adams and Henry Beckwith 6.8%. Pacific Investors (the Beckwith’s Family office) 13.6% and Andrew Egan one of the co-founders but who isn’t a director 5.7%. Institutions Gresham House 7.3%, Amati Global 5% and Axa Framlington 3.8%
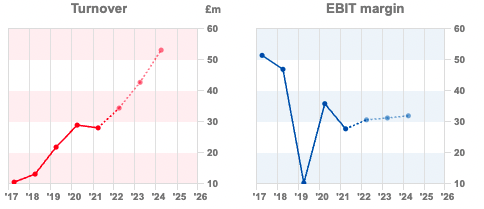
Opinion: We saw a couple of weeks ago that Equals has been reporting strong growth +52%. But the chart to the side, where I compare revenue growth of AGFX with Equals and Alfa, shows that it is not uncommon for these businesses to stumble but then recover.
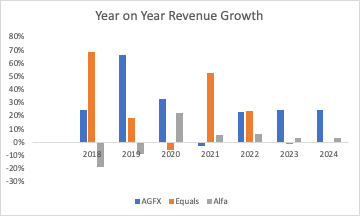
Having covered Northern Rock for many years, I’m rather suspicious of businesses that show a constant growth trend – they tend to be more risky than the smooth chart progression suggests. The risk for all of these FX companies is that we’re currently seeing favourable conditions in currency markets, which may not continue. But I prefer AGFX to Equals because of the higher Returns on Capital.
PZ Cussons Q3 Trading Update
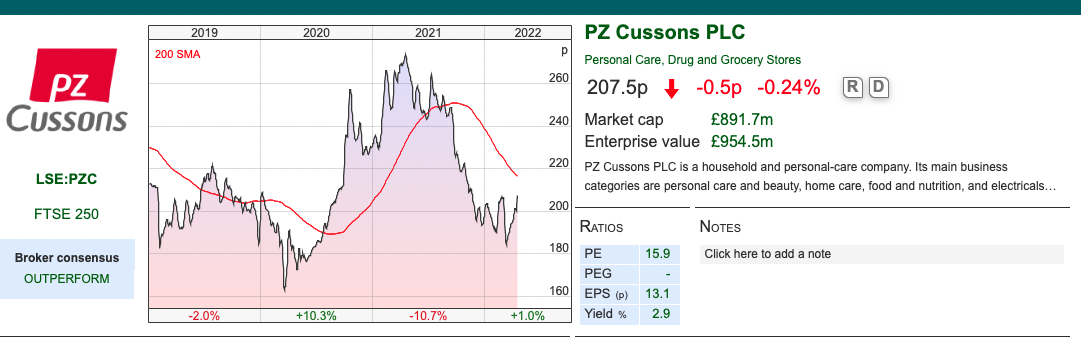
This consumer brands company that operates in West Africa and Indonesia announced a Q3 update for Dec-Feb. I pitched the shares at Mello last week, suggesting that the problematic Nigerian business ought to begin benefiting from higher oil prices (driving rising disposable income in the country). Given that 2/3 of operations are outside the UK, the statutory revenue growth of less than 1% has been affected by GBP strength. Adjusting for the currency effect, and also prior year disposals reveals group like-for-like revenue growth +8.5%. Year on year comparison have also been held back by exceptionally high sales of hand sanitiser (PZ Cussons own Carex, the market leader in the UK) at the start of the pandemic.
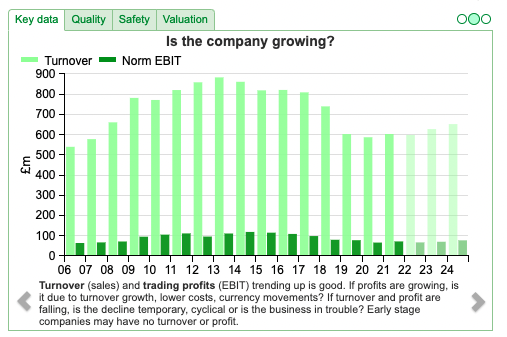
Longer term we can see that revenue has shrunk by roughly a third over the last 10 years, as management sold off non core businesses and struggled to grow the brands that they do have. That is now forecast to recover.
On a geographic split it does look like my investment thesis has some support, African revenue (41% of group revenue) saw +26% like for like sales growth. They also own a white goods electrical business in Africa (40% of African revenue) which grew at double digits. They went to the trouble of setting that business up because they realised that to drive sales of household brands they needed a population that had access to white goods (freezers, generators, washing machines and fridges).
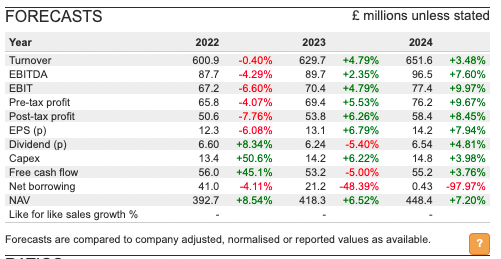
Outlook: Management say that FY May 2022F numbers are likely to come within the range of current expectations. They do warn that we might see higher input cost inflation – so it’s possible we see higher revenue but also higher costs.
SharePad doesn’t have a range – but forecasts are for revenue growth below the current rate of inflation. I think that could turn out to be too cautious.
Valuation: The shares are on 16x May 2023F. The price to sales ratio is 1.4x that year versus 1.9x for Unilever, or 5x for Procter and Gamble and L’Oreal.
Opinion: I own the shares and think there’s potential for the new(ish) Chief Exec to increase margins, focus on the basics and also a positive tailwind from rising oil prices which ought to benefit the Nigerian consumer. I bought the shares in 2016 which was far too early. So I have had to be patient, but I am hoping we now see a change in fortunes from the previous decade of disappointment.
Bruce Packard
Notes
The author owns shares in Argentex and PZ Cussons.
This article is for educational purposes only. It is not a recommendation to buy or sell shares or other investments. Do your own research before buying or selling any investment or seek professional financial advice.


Thanks for sharing with us this important Content. I feel strongly about it and really enjoyed learning more about this topic.
okbet casino login philippines