
A few months ago, SharePad released a new feature. It’s called the Single Page.
The Single Page feature can be found by clicking this icon in the middle of your SharePad here:
![]()
An easier way to access this is by clicking the Enter key on your keyboard. This will bring up the Single Page instantly on your screen.
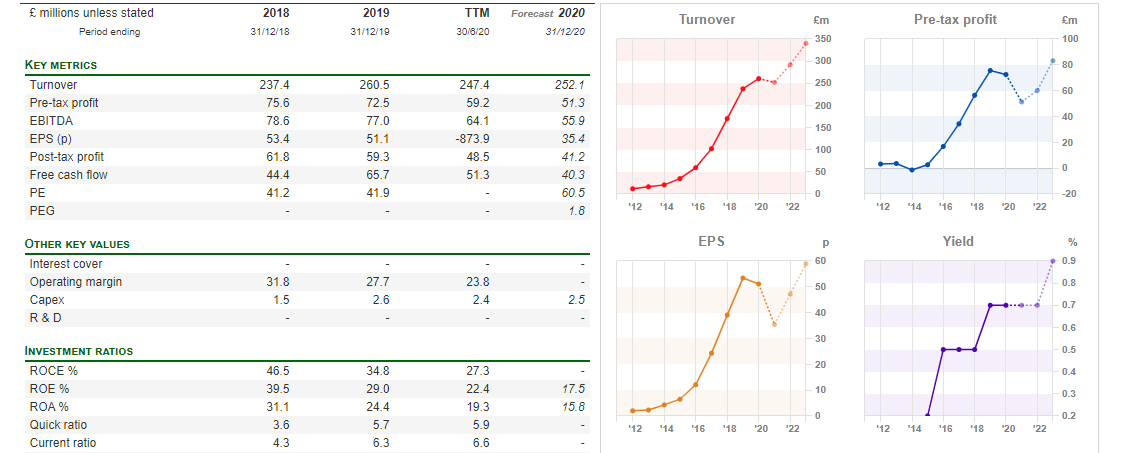
Here’s how it looks:

The Single Page feature covers a lot of data.
It is designed to offer a quick summary of a stock before using SharePad’s tools to dig deeper.
The Single Page gives various pieces of information instantly such as:
- The market cap and enterprise value (so you can quickly see a measure of the net cash/debt level)
- A brief bio of the company so you can see what it does and in what sector
- The current share price and index
- PE and PEG so you can quickly get a feel for market sentiment and whether it is justified
- Key financial metrics visualised in graphs
There is further information below as you scroll down.

Once you’ve finished with the Single Page you can hit Enter again and return to where you were.
If you found the financial metrics interesting you can now dig deeper using the Financials tab on SharePad.
The aim of the Single Page is to provide a useful summary and save you time. It shows information in one useful space.
Customisation
You might want to see different metrics than the standard layout offers.
If so, you can click the Custom tab at the top of the screen, as seen here:
![]()
Once you click the Custom tab, you’ll be shown this pop-up message.
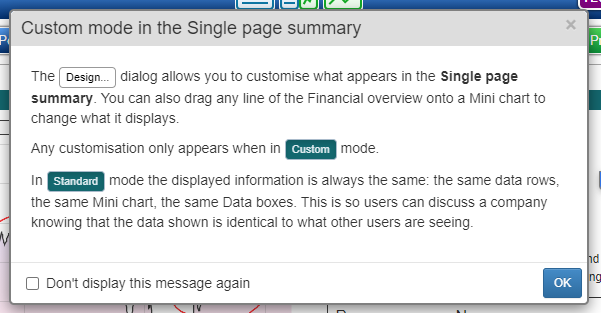
You can opt to not see this message again once you’ve read and understood it.
We now need to click on the Design button in the bottom left of SharePad.
This brings up the Single Page design window.
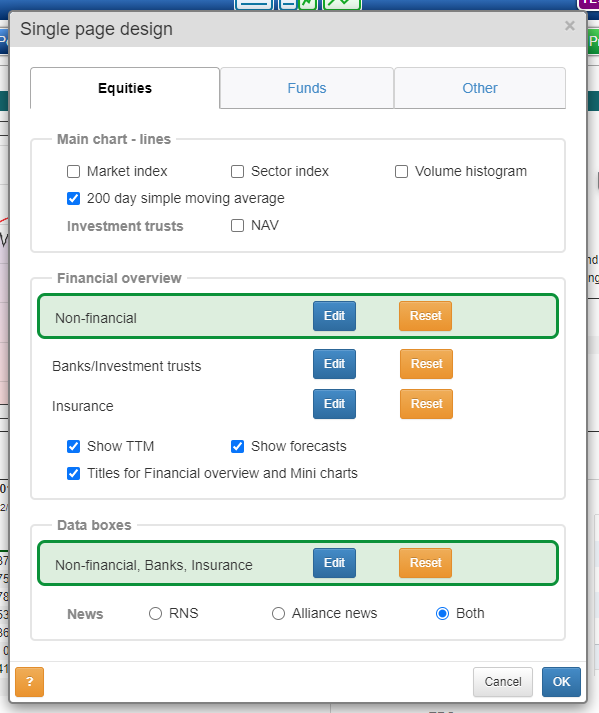
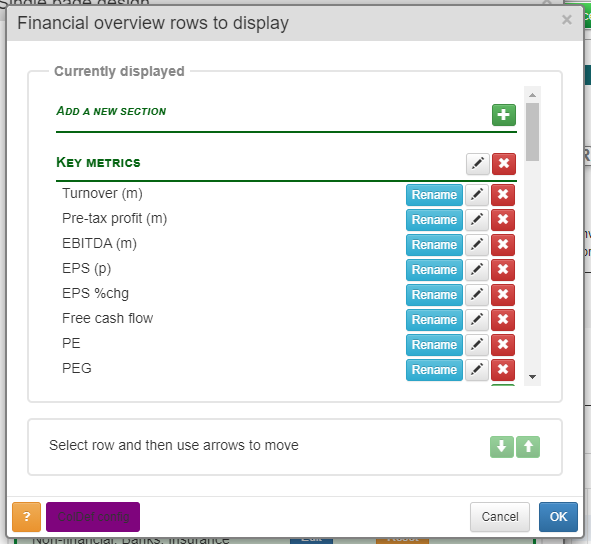
I want to edit the Non-financial stocks metrics. To do this, we need to click Edit. This brings up the below window.
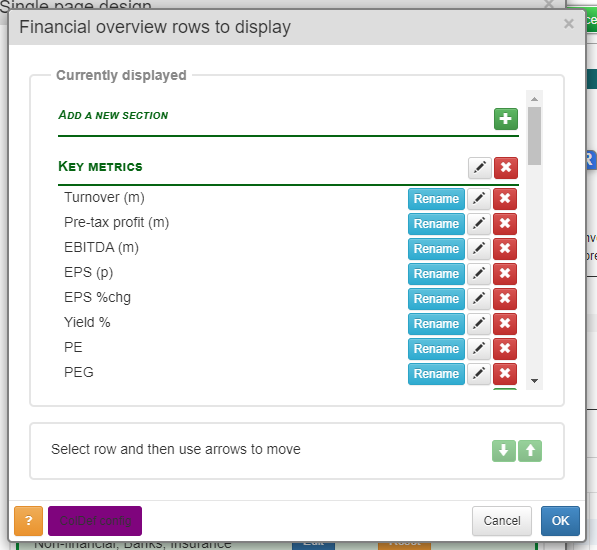
We can both rename metrics and change them. I don’t like the word Turnover because I read about Revenue in RNSs.
Therefore, I can click the Rename button and change this to Revenue.
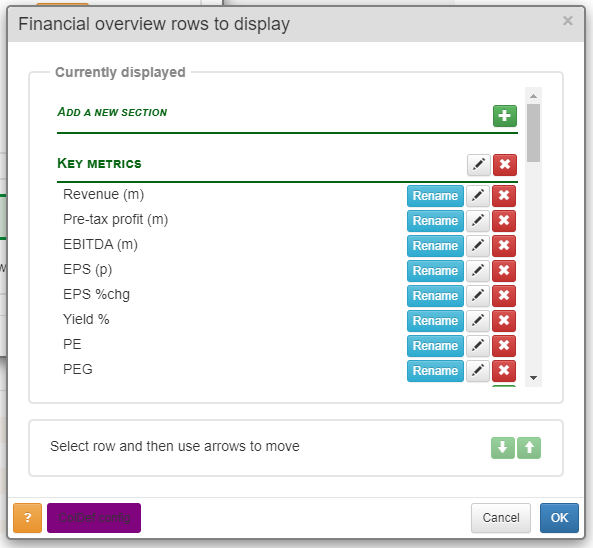
Fixed!
But what if you don’t like any of these metrics? You can change them.
Single Page was designed with both Standard and Custom modes.
The Standard mode ensures that when discussing with friends and other SharePad users you can both see the same window.
The Custom mode allows you to strip out the metrics that you don’t like or aren’t important and replace them with the metrics you do like and that are important.
For example, I’m not interested in the dividend yield.
Therefore, we click the pencil in order to edit this.
![]()
Once you click this you will now have the option to input your own metrics.
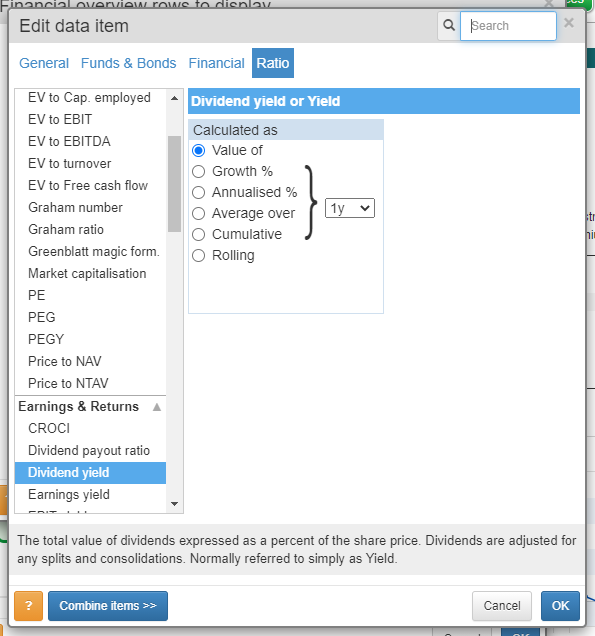
We can see that we have four tabs: General, Funds & Bonds, Financial, and Ratio.
In the General tab you’ll find various analysis ratios such as Sharpe and Sortino, and in Funds & Bonds you will find the Z-statistic.
The Financial ratio covers various forms of financial performance from both the income statement and balance sheet, and Ratios covers other valuation metric ratios as well as balance sheet ratios.
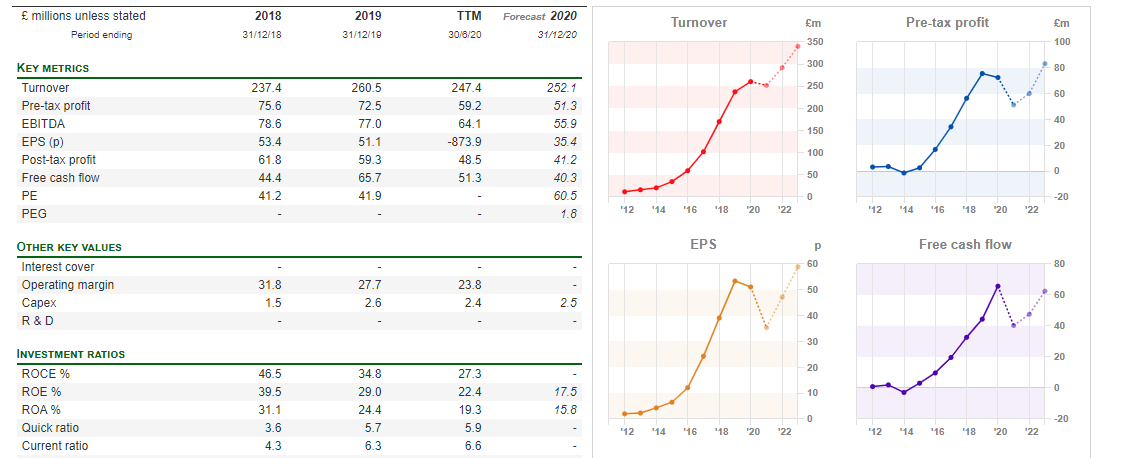
I’ve decided I want Free Cash Flow, so I head to the Financials tab and click it.
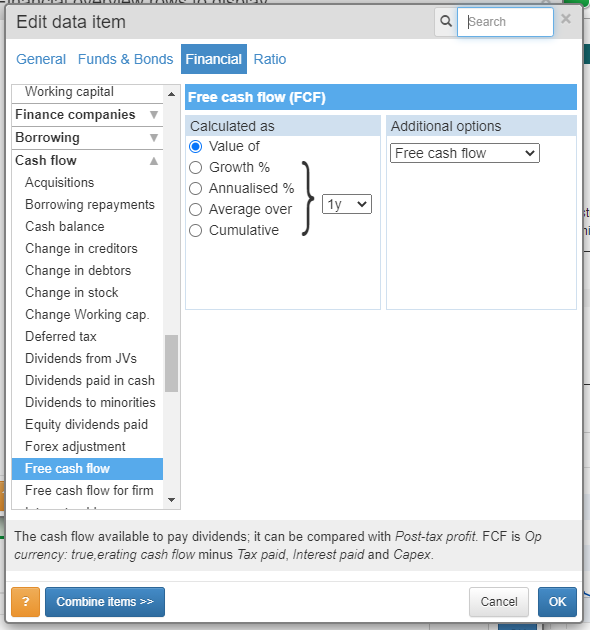
This now means that I’ve swapped Yield % for Free cash flow.
However, I want to be able to see how much of a company’s after-tax profit is converted into cash by the company.
To do this, I’ll need to make a quitch switch on another metric. I’ll change EPS %chg, as then after-tax profit will be directly above Free cash flow, allowing for an easy check.
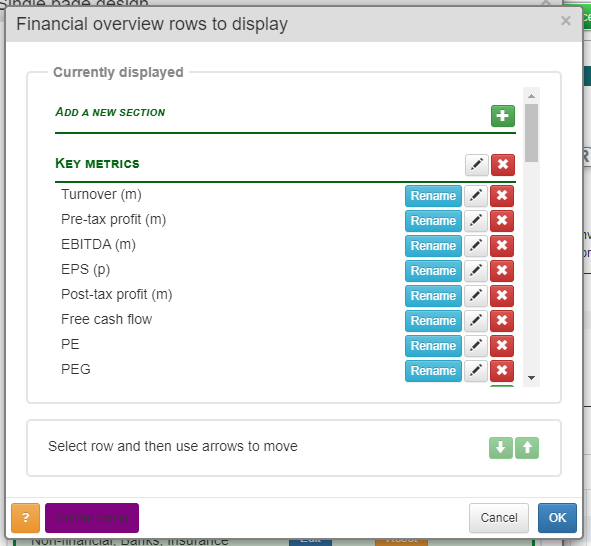
Having now sorted my list, I click OK and then all changes on my Custom mode are saved.
Tidying up your Custom page
We can also clean up the Custom page a little.
We can get rid of the titles such as “Financial overview” and “Mini charts” if you want less clutter.
Clicking this button below will remove these.
![]()
And if you only read RNS like me, you can select for the Single Page to show recent RNS announcements only by clicking RNS in the above picture instead of both.
Here’s the Latest news section for “Both”.

That’s a lot of news that I’m not going to read. However, if you like Alliance News then keep it on. It’s your Custom page.
More customisation on Single Page
Another feature available on both the Standard and Custom Single Pages is the ability to jot down notes that will be saved on that stock.

There are ten Notes boxes for you to include personal thoughts on the stock, key things to remember, summaries from results RNSs.
This functionality means that you don’t need to keep paper notes in files on stocks as you can type your notes directly here. Or you can do both (although you can of course keep paper notes filed away if you’d rather).
The goal of Single Page is to build an immersive and personalised databank of knowledge and notes to help you achieve outperformance in the markets.
Changing the metrics
Don’t forget that once you’ve updated your list of Key metrics, you can switch the graphs too.
Here is an example.
We can see that currently Yield % is still on my mini graphs.
Drag the metric across to your desired graph and this will then change (as below).
Single Page is a great new addition to SharePad. Hitting Enter for a few seconds is enough to get the information I need before clicking off again.
If you found this article useful – my monthly newsletter covers more trading ideas and market knowledge.
You can sign up at my website below.
Michael Taylor
Buy the Breakout trading newsletter available at: www.shiftingshares.com/newsletter
Twitter: @shiftingshares
This article is for educational purposes only. It is not a recommendation to buy or sell shares or other investments. Do your own research before buying or selling any investment or seek professional financial advice.


