
Alpesh Patel OBE uses a multi-factor screen across 5,539 US shares to uncover stocks showing strength across valuation, quality, momentum and financial resilience. He explains how the APSE process highlights ten US names where academic factor evidence and current market trends point in the same direction.

WHY I DO THIS EVERY YEAR
Fund managers have underperformed the index for decades. The data on this is not ambiguous – it is embarrassing. The average actively managed fund charges you 1-2% a year and delivers less than a tracker fund after fees. I know this because I spent years on Bloomberg and the Financial Times watching it happen, and I have spent the years since teaching investors to do better.
The question is: if you are going to pick individual stocks rather than just buy an S&P 500 ETF, what framework should you use? Not tips. Not hot takes. Not whatever the bank sent you in their quarterly note. The answer is: the academic factor literature, fifty years of peer-reviewed evidence on what actually moves stock prices.
Each quarter I run my APSE filter across the US shares list in ShareScope – currently 5,539 names. I cross-reference the output against six academically-evidenced factors. The stocks that appear in multiple factor screens simultaneously are the ones worth looking at. This is not a tips column. It is a methodology for your consideration. The difference matters.
THE SIX FACTORS — WHAT THE LITERATURE SAYS
These are not my opinions. They are the findings of some of the most cited papers in financial economics. Here is what each factor measures and why it predicts returns:
|
Value (Fama & French, 1992) |
Low P/E, low EV/EBITDA, low Price/Sales. The market systematically overpays for glamour stocks and underpays for boring ones. This premium has persisted for over 50 years. |
|
Momentum (Jegadeesh & Titman, 1993) |
Stocks up strongly over 3–12 months tend to keep rising. The market is slow to fully price in improving fundamentals. The 6-month momentum signal is the most robust version of this effect. |
|
Quality / Profitability (Novy-Marx, 2013) |
High ROCE, high gross profitability, high ROE predict outperformance. Profitable businesses compounding capital at high rates are worth owning – and the market consistently underestimates how long the compounding lasts. |
|
Financial Strength (Modigliani-Miller) |
Low net debt/EBITDA, high interest cover. Leveraged companies blow up in downturns. Net cash companies compound through them. Simple but chronically underweighted by retail investors. |
|
Earnings Quality (Sloan, 1996) |
High operating cash conversion relative to reported earnings. Companies with inflated accruals underperform. Real cash is what matters – everything else is accounting. |
|
GARP — Growth at a Reasonable Price |
Low forward PEG ratio (price/earnings divided by earnings growth rate). Peter Lynch’s original signal: a PEG below 1.0 means you are not paying for growth you are not getting. Still one of the cleanest single-number screens available. |
|
A stock that scores highly on Value, Quality, Momentum and Financial Strength simultaneously is not common. When you find one, that is the intersection the academic literature consistently identifies as the most predictive combination. |
THE TEN STOCKS: APRIL 2026
These names emerged from sorting 5,539 US shares in ShareScope across fc PEG, 6-month momentum, ROCE, net debt/EBITDA, and operating cash conversion. The ones below appeared in two or more factor sorts simultaneously. All data is as at 11 April 2026.
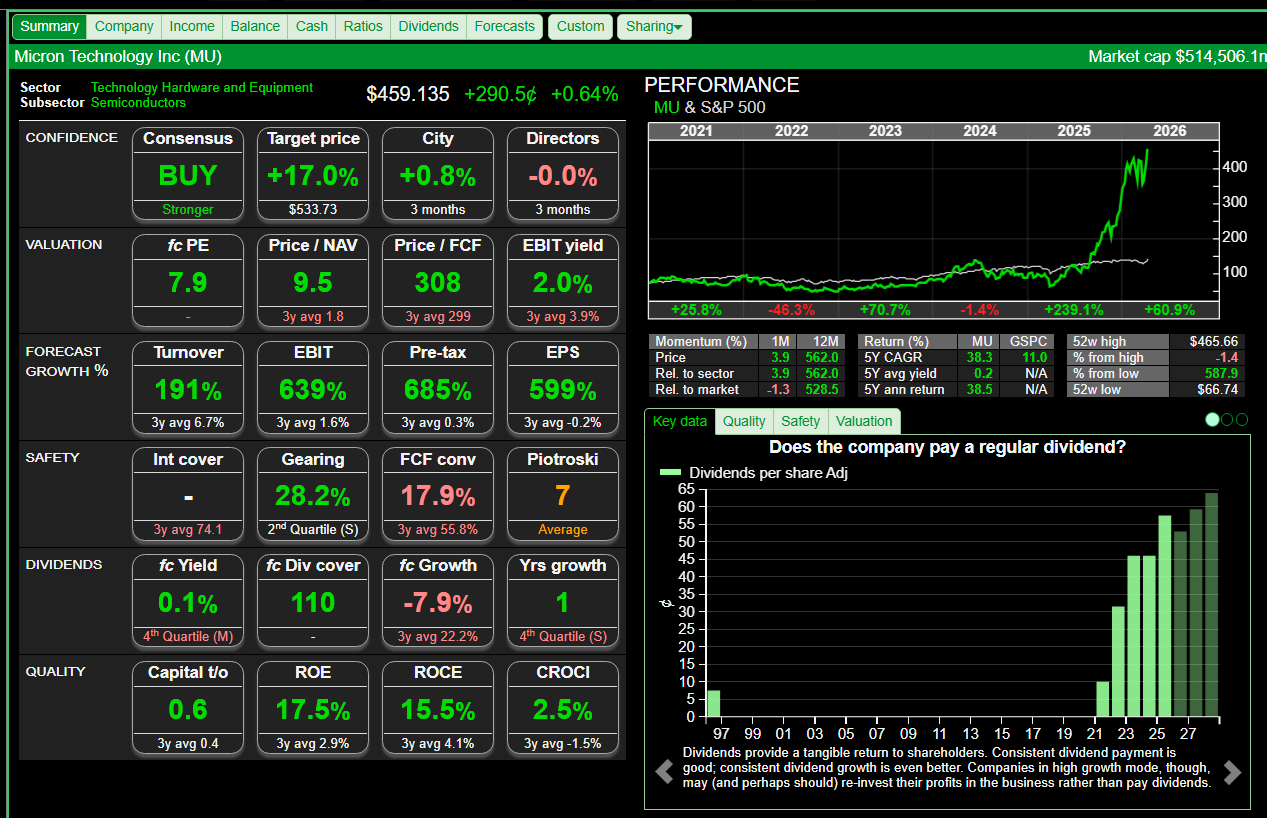
1. Micron Technology (MU) ⭐⭐⭐⭐⭐
Price: ~$421
fc PE / fc PEG: 7.3x / 0.1
Net debt/EBITDA: 0.3x
Interest cover: 178.7x
Operating cash conversion: 15.5%
ROCE: 15.5%
6-month momentum: +132%
A fc PEG of 0.1 is not a typo. It means the market is pricing in almost none of the forecast earnings growth from the AI and data centre memory boom. The business makes DRAM and NAND – the memory that sits inside every AI server, every data centre, every inference chip. Demand is surging. Prices are recovering sharply after the 2022–23 downcycle. Earnings are inflecting.
The 178x interest cover means the balance sheet is about as clean as a listed manufacturer can be. The +132% six-month momentum confirms that institutional money is starting to arrive — but consensus earnings estimates still lag the actual earnings trajectory. This is arguably the most compelling multi-factor stock in the entire screen.
Factors: Value ✓ | GARP ✓ | Momentum ✓ | Financial Strength ✓ — 4/4
2. AppLovin Corp (APP) ⭐⭐⭐⭐⭐
Price: ~$391
fc PE / fc PEG: 25.6x / 0.8
Net debt/EBITDA: 0.2x
Interest cover: 20.1x
Operating cash conversion: 95.6%
ROCE: 77.3%
ROE: 212.9%
A ROCE of 77% with 95.6% cash conversion is elite-level capital efficiency. AppLovin is an AI-powered mobile advertising platform. It uses machine learning to match ads to users with extraordinary precision. The business is growing explosively and generates almost everything it earns in real cash.
The Sloan earnings quality criterion (Sloan, 1996) is about whether reported profits are backed by cash. At 95.6% conversion, they are. The fc PEG of 0.8 means you are not yet paying for the full growth that consensus analysts are forecasting. The balance sheet has almost no leverage. By academic criteria, this is one of the highest-quality businesses trading in the US market.
Factors: Quality ✓ | Earnings Quality ✓ | GARP ✓ | Financial Strength ✓ — 4/4
3. Argan Inc (AGX) ⭐⭐⭐⭐⭐
Price: ~$604
fc PE / fc PEG: 53.7x / 1.6
Net debt/EBITDA: -2.4x (net cash exceeding EBITDA)
Operating cash conversion: 307.9%
ROCE: 32.2%
6-month momentum: +136%
When net debt/EBITDA is -2.4, the company holds more cash than its annual earnings before interest, tax, depreciation and amortisation. That is not a strong balance sheet, its more like a fortress. Argan builds power plants. In 2026, that means it is building the infrastructure that runs AI data centres.
The 307.9% operating cash conversion looks alarming until you understand it: the number reflects large customer prepayments on long-term construction contracts. The cash is real and already received. The ROCE of 32.2% and +136% momentum confirm this is a business the market is beginning to correctly price as a core beneficiary of the AI power buildout – not a peripheral one.
Factors: Quality ✓ | Financial Strength ✓ | Earnings Quality ✓ | Momentum ✓ — 4/4
4. Powell Industries (POWL) ⭐⭐⭐⭐⭐
Price: ~$231
fc PE / fc PEG: 41.6x / 3.4
Net debt/EBITDA: -2.0x (net cash)
Operating cash conversion: 77.1%
ROCE: 37.4%
ROE: 32.2%
6-month momentum: +130%
Powell Industries makes electrical switchgear – the equipment that controls and distributes electrical power in industrial facilities. That sounds unglamorous. It is not. Every AI data centre needs it. Every grid electrification project needs it. Every offshore platform, semiconductor fab, and petrochemical plant needs it. The company just reported two consecutive quarters of record revenues.
A ROCE of 37% is exceptional for an industrials company – most industrials struggle to get above 15%. Net cash on the balance sheet. The +130% six-month momentum is institutional money recognising a secular demand story that has years to run. The fc PEG of 3.4 is the only number that gives pause, but for a business with this ROCE and this backlog, the growth deserves a premium.
Factors: Quality ✓ | Financial Strength ✓ | Earnings Quality ✓ | Momentum ✓ — 4/4
5. Comfort Systems USA (FIX) ⭐⭐⭐⭐
Price: ~$1,594
fc PE / fc PEG: 43.5x / 2.2
Net debt/EBITDA: -0.3x (net cash)
Operating cash conversion: 90.4%
ROCE: 50.7%
ROE: 50.4%
A ROCE of 50.7% in a mechanical services contractor is the kind of number that should stop you mid-sentence. These are not technology multiples, this is a company that installs HVAC, plumbing and mechanical systems. Except it dominates the installation of those systems inside AI data centres, which require extraordinary cooling infrastructure to function.
Net cash balance sheet. 90% cash conversion. The compounding power here, over a decade, is extraordinary by any academic quality metric. Novy-Marx (2013) shows that high gross profitability companies systematically outperform, Comfort Systems is the rare industrial business that qualifies by technology-company standards.
Factors: Quality ✓ | Financial Strength ✓ | Earnings Quality ✓ — 3/4
6. Booking Holdings (BKNG) ⭐⭐⭐⭐⭐
Price: ~$173
fc PE / EV/EBITDA / fc PEG: 16.2x / 14.2x / 1.0
Net debt/EBITDA: 0.2x
Interest cover: 14.9x
Operating cash conversion: 101.4%
ROCE: 73.3%
ROE: 319.7%
A fc PEG of exactly 1.0 is the classic Peter Lynch signal. The stock is priced precisely in line with its expected earnings growth rate. For a business of this quality, that looks cheap. Booking Holdings is the dominant global online travel platform. It has oligopoly characteristics: two players control most of the market, the switching costs are enormous, and the network effects compound with every booking.
Cash conversion over 100% means reported earnings are, if anything, understating the actual cash generation. A ROCE of 73% and ROE of 320% reflect the extraordinary capital-light economics of a platform business. When you find a business of this quality at a fc PEG of 1.0, the academic literature – every factor from value to quality to earnings quality – suggests the same thing.
Factors: Value ✓ | Quality ✓ | Earnings Quality ✓ | GARP ✓ — 4/4
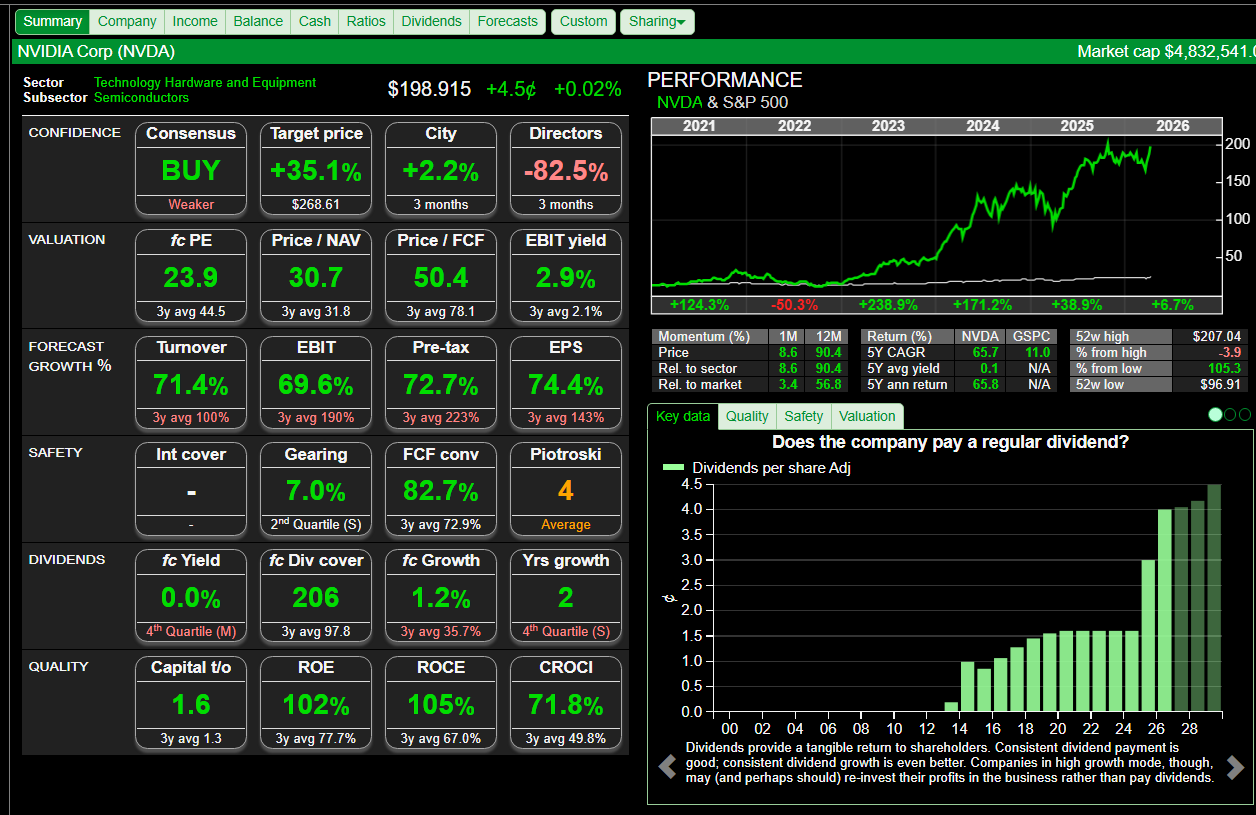
7. NVIDIA Corp (NVDA) ⭐⭐⭐⭐⭐
Price: ~$189
fc PE / EV/EBITDA / fc PEG: 22.7x / 31.7x / 0.7
Net debt/EBITDA: ~0x (net cash)
Interest cover: 378.8x
Operating cash conversion: 105.3%
ROCE: 105.3%
ROE: 101.5%
A ROCE of 105% is not a figure you see often. It means Nvidia generates more in annual returns than the total capital employed in the business, an extraordinary reflection of the pricing power it holds in the GPU market. The 378x interest cover means debt is essentially irrelevant to this company. Cash conversion over 100% again.
The fc PEG of 0.7 is the number that most surprises people. At the prices printed above, the market is not yet fully pricing in the consensus earnings growth forecasts for Nvidia – which themselves may be conservative given the acceleration in AI inference demand. This looks like a genuine value signal on a quality-growth basis. Not a cheap stock by traditional metrics. A potentially cheap stock relative to its earnings trajectory.
Factors: Quality ✓ | Earnings Quality ✓ | GARP ✓ | Financial Strength ✓ — 4/4
8. Mastercard (MA) ⭐⭐⭐⭐
Price: ~$499
fc PE / EV/EBITDA / fc PEG: 25.5x / 21.8x / 1.6
Net debt/EBITDA: 0.4x
Interest cover: 27.3x
Operating cash conversion: 90.4%
ROCE: 63.7%
ROE: 214.8%
I have owned Mastercard at various points over the years and the thesis has never really changed. It is a toll road on global commerce. Every time anyone anywhere uses a card, Mastercard earns a fraction of a percent on the transaction volume. The marginal cost of one additional transaction is essentially zero. That is why the ROE is 215%.
The ROCE of 63.7% puts it firmly in the Novy-Marx quality premium tier. A fc PEG of 1.6 for a business with this moat is very reasonable — you are paying a modest premium over growth for a franchise that is genuinely difficult to displace. The 90% cash conversion confirms the earnings are real. This is the kind of compounder you buy and do not have to think about for years.
Factors: Quality ✓ | Earnings Quality ✓ | Financial Strength ✓ — 3/4
9. Seagate Technology (STX) ⭐⭐⭐⭐⭐
Price: ~$503
fc PE / EV/EBITDA / fc PEG: 38.6x / 55.6x / 0.7
Net debt/EBITDA: 1.9x
Interest cover: 6.3x
Operating cash conversion: 56.6%
ROCE: 35.4%
6-month momentum: +135%
Seagate makes hard drives. That sentence was considered a death sentence for a stock five years ago. It is now the opposite. AI model training requires storing vast quantities of data – training datasets, model weights, inference logs. Mass storage demand is in a structural growth phase that the market is only beginning to price. The fc PEG of 0.7 says consensus earnings estimates have not caught up.
The 1.9x net debt/EBITDA is the only modest concern – higher leverage than others on this list, though declining rapidly as earnings recover. The +135% momentum and 35.4% ROCE suggest both institutional recognition and genuine business quality. This appeared in both the fc PEG sort and the momentum sort simultaneously, exactly the cross-factor signal the screen is designed to find.
Factors: Value ✓ | Quality ✓ | GARP ✓ | Momentum ✓ — 4/4
10. Viavi Solutions (VIAV) ⭐⭐⭐
Price: ~$41.8
fc PE / EV/EBITDA / fc PEG: 50.0x / 76.1x / 2.4
Net debt/EBITDA: 2.0x
Interest cover: 4.1x
Operating cash conversion: 58.3%
ROCE: 4.3%
6-month momentum: +241%
This is not a quality pick. I want to be clear about that. The ROCE of 4.3% is low. The leverage is higher than I normally want. The fc PEG of 2.4 means you are paying a growth premium. This is a momentum and turnaround pick, and it comes with a higher risk profile than every other name on this list.
What Viavi does is make fibre optic network testing equipment. The instruments used to install and verify the fibre infrastructure that AI networking requires. The +241% six-month momentum is the fifth-strongest in the entire 5,539-stock US universe. That is not noise. That is institutions arriving at an earnings inflection story. I include it with explicit caution: this is the speculative position in the basket, not an anchor.
Factors: Momentum ✓ | GARP ✓ — 2/4 ⚠️ Higher Risk / Turnaround
SUMMARY — ALL TEN PICKS
|
# |
Company |
Ticker |
Price |
ROCE |
fc PEG |
6m % |
Net Debt/EBITDA |
|
1 |
Micron Technology |
MU |
~$421 |
15.5% |
0.1 |
+132% |
0.3x |
|
2 |
AppLovin Corp |
APP |
~$391 |
77.3% |
0.8 |
— |
0.2x |
|
3 |
Argan Inc |
AGX |
~$604 |
32.2% |
1.6 |
+136% |
-2.4x |
|
4 |
Powell Industries |
POWL |
~$231 |
37.4% |
3.4 |
+130% |
-2.0x |
|
5 |
Comfort Systems |
FIX |
~$1,594 |
50.7% |
2.2 |
— |
-0.3x |
|
6 |
Booking Holdings |
BKNG |
~$173 |
73.3% |
1.0 |
— |
0.2x |
|
7 |
NVIDIA Corp |
NVDA |
~$189 |
105.3% |
0.7 |
— |
~0x |
|
8 |
Mastercard |
MA |
~$499 |
63.7% |
1.6 |
— |
0.4x |
|
9 |
Seagate Technology |
STX |
~$503 |
35.4% |
0.7 |
+135% |
1.9x |
|
10 |
Viavi Solutions |
VIAV |
~$41.8 |
4.3% |
2.4 |
+241% |
2.0x |
THE DOMINANT THEME: AI INFRASTRUCTURE
Six of the ten picks – Micron, Argan, Powell Industries, Comfort Systems, Viavi, and Seagate – are direct beneficiaries of the insatiable demand for compute, power, storage, and networking that AI has created. This is not a narrative. It is confirmed empirically: these companies simultaneously show exceptional ROCE, strong cash conversion, and powerful six-month momentum.
That combination – quality fundamentals confirmed by price momentum – is exactly what the academic multi-factor literature identifies as a predictive cross-factor signal. The four platform businesses (AppLovin, Booking Holdings, Nvidia, Mastercard) are dominant moat businesses with extraordinary capital returns and fc PEGs that do not yet necessarily reflect their full earnings power.
|
The lesson from the academic literature is not ‘buy AI stocks’. It is: find companies where the fundamental quality metrics and the momentum signal are pointing in the same direction simultaneously. When they do, the evidence says that combination outperforms. |
HOW TO USE THIS IN SHARESCOPE
Every metric in this article is available in your ShareScope and the filter / columns are pre-set for existing Alpesh Special Edition subscribers. Here is how to replicate the screen:
- Create (or open for existing ASPE subscribers) your Value/Growth filter — this pre-screens for fundamental quality criteria including ROCE, earnings growth, and valuation
- Sort the results by fc PEG (ascending) — stocks below 1.0 are your GARP candidates
- Cross-reference with the 6-month % change column — look for names appearing in both the top PEG sort and the top momentum sort
- Check net debt/EBITDA — eliminate any name above 3x unless the interest cover is very high
- Finally check operating cash conversion — anything below 50% deserves scrutiny
- Run the resulting shortlist through your APSE chart settings — check the monthly MACD. Rising from oversold confirms the momentum signal has legs
The stocks in this article cleared all of those tests. That does not make them certainties — nothing in markets is. But it does mean they are not guesses. They are the output of a systematic, academically-grounded process applied consistently across the full US market. That, in my opinion, is the difference between investing and speculating.
Alpesh Patel OBE
If your interested in subscribing to APSE for your ShareScope please email support@sharescope.co.uk for more information.
This article is for educational purposes only. It is not a recommendation to buy or sell shares or other investments. Do your own research before buying or selling any investment or seek professional financial advice.


Very instructive and enlightening post. Thanks Alpesh