
David Stevenson reviews an exceptional year in which most asset classes delivered strong returns, challenging assumptions about US market dominance. He also highlights a UK income trust, a Vietnam-focused opportunity, and the striking rise in precious metals, particularly silver.

2025 was a fairly extraordinary year in which nearly all risky assets and markets, including gold, equities and bonds, delivered strong returns. And despite what we’re told, US equities weren’t that exceptional in terms of returns, as we discuss in this month’s funds analysis. We also dig into two UK-listed investment trusts that might appeal: one focused on income, the other on Vietnamese equities. And we finish by looking at the remarkable rise in precious metal prices, especially silver.
2025 was a year of gains across the board
For this observer, the big story of 2025 was that nearly all major, liquid asset classes, including most equities and many bonds, produced strong returns. One driver of that was declining volatility, not just in equity markets but also in bonds.
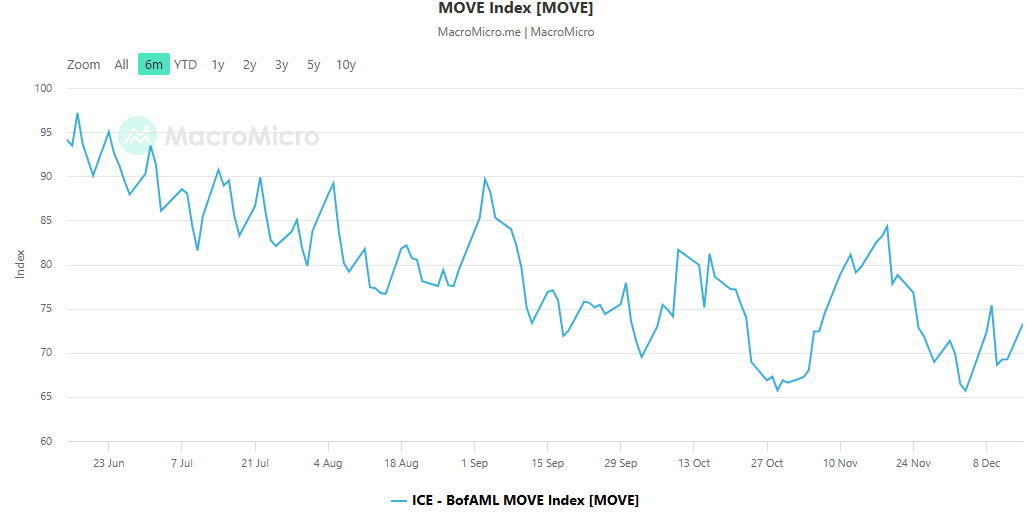
To understand this, especially in the context of bonds, check out the chart below from the Macro Micro data website. This shows the MOVE index, which reflects volatility in U.S. Treasury futures. The index is considered a proxy for term premiums of U.S. Treasury bonds (i.e., the yield spread between long-term and short-term bonds). It’s been trending much lower in the last few months and is now down at levels last seen in 2021.
Beyond bonds, equities prospered by and large in 2026, even UK ones!
The table below shows returns for a wide range of markets and asset classes for 2025 through to December 29th. I have also included total returns for the last 5 to 10 years, and in each vertical column, I have mapped returns using a heatmap to emphasise outperformers (in blue).
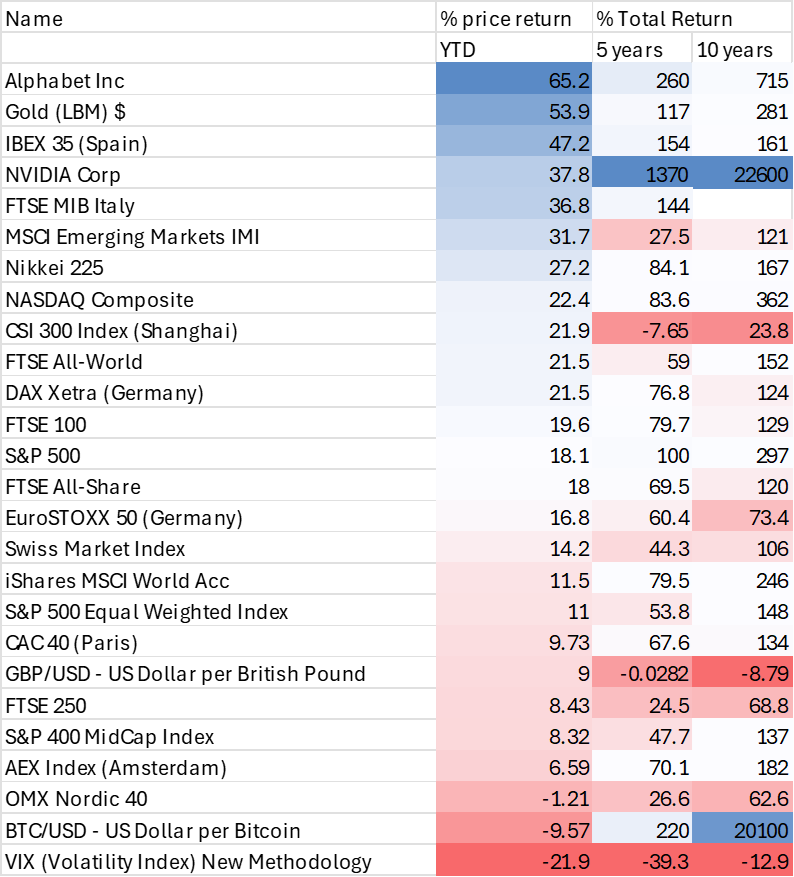
Source: ShareScope To Monday December 29th
What’s immediately striking is that, although individual US tech stocks have performed brilliantly, especially Alphabet and to a lesser degree Nvidia, European markets such as Spain and Italy have massively outperformed the US (especially the S&P 500). The UK has produced middling, ‘meh’, results.
Another interesting aspect is that the equal-weight version of the S&P 500 has significantly underperformed the ‘mainstream’ version of the index, suggesting that the US valuation upturn has been more concentrated, which confirms concerns about a mega-large-cap tech bias in the index. But that concentration in returns is, in fact, a relatively narrow one, as evidenced in the following chart below. It shows that only 2 of the Magnificent 7 stocks are beating the S&P 500 this year.

I’ll finish this opening yearly review with one last chart, which I think tells the big story of 2025: AI capex and the boom that pushed Alphabet and Nvidia’s shares higher. According to AI commentator Paul Kedrosky, Microsoft’s capex-to-sales ratio has surged to 25% by 2025, dramatically outpacing ExxonMobil’s 10%, highlighting a significant shift in which a tech giant now invests a much larger share of sales in capital expenditures than an energy giant. 2025 really was a story about AI capex spending in the US.

SEQI – an income fund with a strong track record
If you’re focused on income from alternative assets, I’d suggest you wouldn’t go too far wrong with a fund with the ticker SEQI. This investment trust is the UK’s largest listed debt investor, investing in economic infrastructure, private loans, and bonds across a range of industries in jurisdictions, creating equity-like returns with the protections of debt. Since its launch in 2015, SEQI has provided investors with ten years of quarterly income, consistently meeting its annual dividend per share target, which has grown from 5 pence in 2015 to 6.875 pence per share. The fund currently has a net yield of 8.8% per annum. It also recently released its November 2025 NAV and portfolio update, which is worth dwelling on, if only because it plays into its boring, income focus.
In these results NAV per share increased to 94.04 pence per share from the prior month’s NAV per share of 93.18 pence, representing an increase of 0.86 pence per share. During the month, SEQI invested in the following:
- A senior loan into Euroports, a leading international ports operator, for €35.0 million to participate in the refinancing of the previous loan
- An additional senior loan into Project Hero, for a Spanish market leader in land-based healthcare transport services, for €6.7 million
- An additional senior loan into Sunrun Radcliffe HoldCo, for a leader in the US residential solar market, for $6.35 million
SEQI also completed the following:
- Full repayment of £24.1 million from Bulb Energy, a former UK energy supplier, following its insolvency
- Full sale of SEQI’s remaining Brightline East LLC bonds for $5.0 million. The borrower is a privately-owned passenger rail project entity in Florida
The shares are up 8.4% year to date and trades at an 18% discount.
Here’s the view of fund analysts at Deutsche Numis:
“The manager has built a strong track record over more than 10 years of management, demonstrated by an annual loss rate of c.0.54% (at 30 September 2025). Infrastructure debt has historically had very low loss rates, although the yield target of SEQI means it will necessarily take on more risk than vanilla infrastructure debt. The manager has worked through several non-performing loans, and these now represent a very small percentage of NAV (0.6%), whilst there is enhanced monitoring on 15.4% of the portfolio (15.5% Sep-24). We believe the c.14% discount does not reflect the company’s active approach to valuation, with monthly third-party valuations, and we believe there is limited downside to this given an active buyback programme, the pace of which has picked up in the last couple of weeks”.
I agree with this view. For income investors looking for a portfolio of well-run, high-yielding funds, SEQI fits the bill as long as it’s part of a diversified portfolio. Its track record of dealing with lending losses is impressive, and the asset base looks pretty solid, with quality counter parties.
Vietnam VEIL
Sticking with investment trusts, Vietnam Enterprise Investments (VEIL) has proposed to hold three 10% tender offers over the next 12 months to allow investors to realise their shares close to NAV, with the first to be held in January, if shareholders approve the plans at a General Meeting on 08/01/2026. Three smaller tenders are proposed rather than one 30% tender in order to account for the illiquidity of Vietnamese stocks, allowing the manager to spread sales over time and get a better result for shareholders.
The tender price is to be 3% below NAV on the calculation date, to account for the cost of the transactions and the tender. It therefore represents a better price than could be achieved in the market, with the shares trading on a c. 13% discount prior to the publication of the proposals. The background is a vote by 20% of shareholders against continuation over the summer, following which the board has been consulting shareholders on the future direction for the company.
The board has reiterated its commitment to the 100% conditional five-year performance-related tender offer, which will be triggered if the NAV total return underperforms the index over the five years to 31/03/2025.
I think a note from fund researchers at Kepler nicely sums up my very positive reaction to this :
“The board of VEIL have devoted considerable capital to buybacks over recent years, repurchasing over 12% of the shares in issue in 2025 alone. These new proposals are a further demonstration of a commitment to shareholder value. We note that the discount has narrowed considerably over 2025, but the board has continued to buy back at size, the average purchase price being at a c. 14% discount to NAV this year compared to c. 19% in 2024, and now they have introduced further proposals.
Investors will now able to realise at least some of their investment close to NAV, assuming the proposals are voted through in January. With the discount at c. 13% on the day of the announcement, we calculate this implies a c. 11% gain to shareholders (depending on what happens to the NAV in the interim). This is essentially equivalent to one year of VEIL’s annualized five year NAV returns, and well behind the 16% annualized delivered over ten years. “
I’d echo Kepler’s point that Vietnam is one of the best geographies in the developing world, with a fast-expanding industrial and technological export base and a vibrant domestic economy. It also played the US tariff game expertly and technical support should come from a reclassification to emerging markets status by FTSE next year. So, if you buy into the Vietnam story, which I do, you have a potential double whammy here : better valuations as Vietnam grows, plus a tightening of the discount.
What’s a safe haven
You may remember, in the dim and distant past of this spring and summer, some investors were talking about bitcoin as a digital safe-haven asset. The chart below, from macro economist Robin Brooks at the Brookings Institution, I think, safely dispels that idea. Since Chair Powell’s Jackson Hole speech in August, bitcoin has proved to be anything but a safe haven.

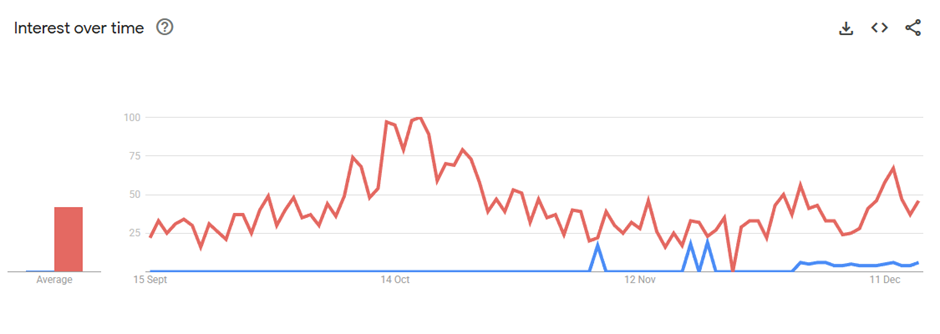
By contrast, silver prices are up an astonishing 117% – over the past 10 years, silver prices have increased by 350%. We’ve seen a mountain of news and commentary about AI, but barely any on what’s happened to the silver price – the chart below shows Google Trends for the last three months, focusing on two terms: AI bubble and silver prices. Notice the vast discrepancy!
AI is constantly talked about, while silver is rarely mentioned, though gold is slightly more popular. Yet as precious metals fund manager Ian Williams of Charteris observes, the precious mining industry is now the most profitable in the world now: “Nvidia has a gross profit margin of 70% – compared that to an average Silver mine whose costs are 20usd an ounce and Silver has just gone to a new all time high of 60usd.Some big Gold miners have costs of under $1500/oz with Gold trading at $4200/oz.”
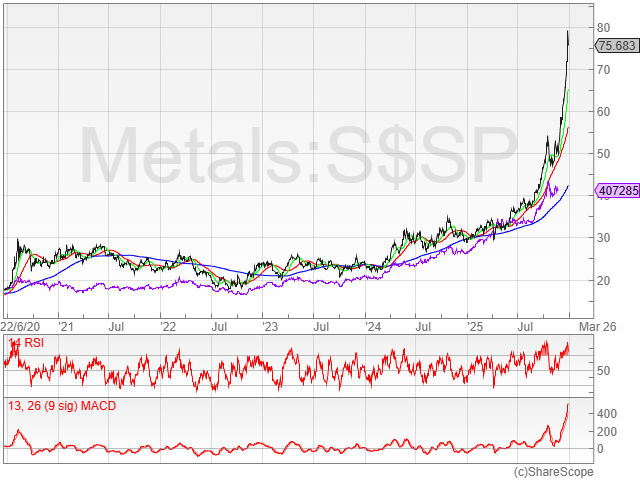
The next chart from ShareScope expands on that silver surge/bubble. The black line is the silver spot price, the purple line the gold price. There are also three moving average lines: green for the 20-day simple MA, red for the 50-day SMA and blue for the 200-day SMA. What’s extraordinary is the massive outperformance by silver in the last six to 12 months.
The big story here is the so-called ‘debasement’ or ‘safe haven’ trade. Investors worldwide are worried that ever-expanding government budget deficits can only be cured by central banks bending to keep inflation above its recent average and restarting QE. That’s helped push investors to look for safe havens beyond the dollar. In the past, the yen and the euro would have served that purpose, but not anymore. The Swedish kroner and Swiss Franc have some value but are of limited use because of their size. That leaves gold.
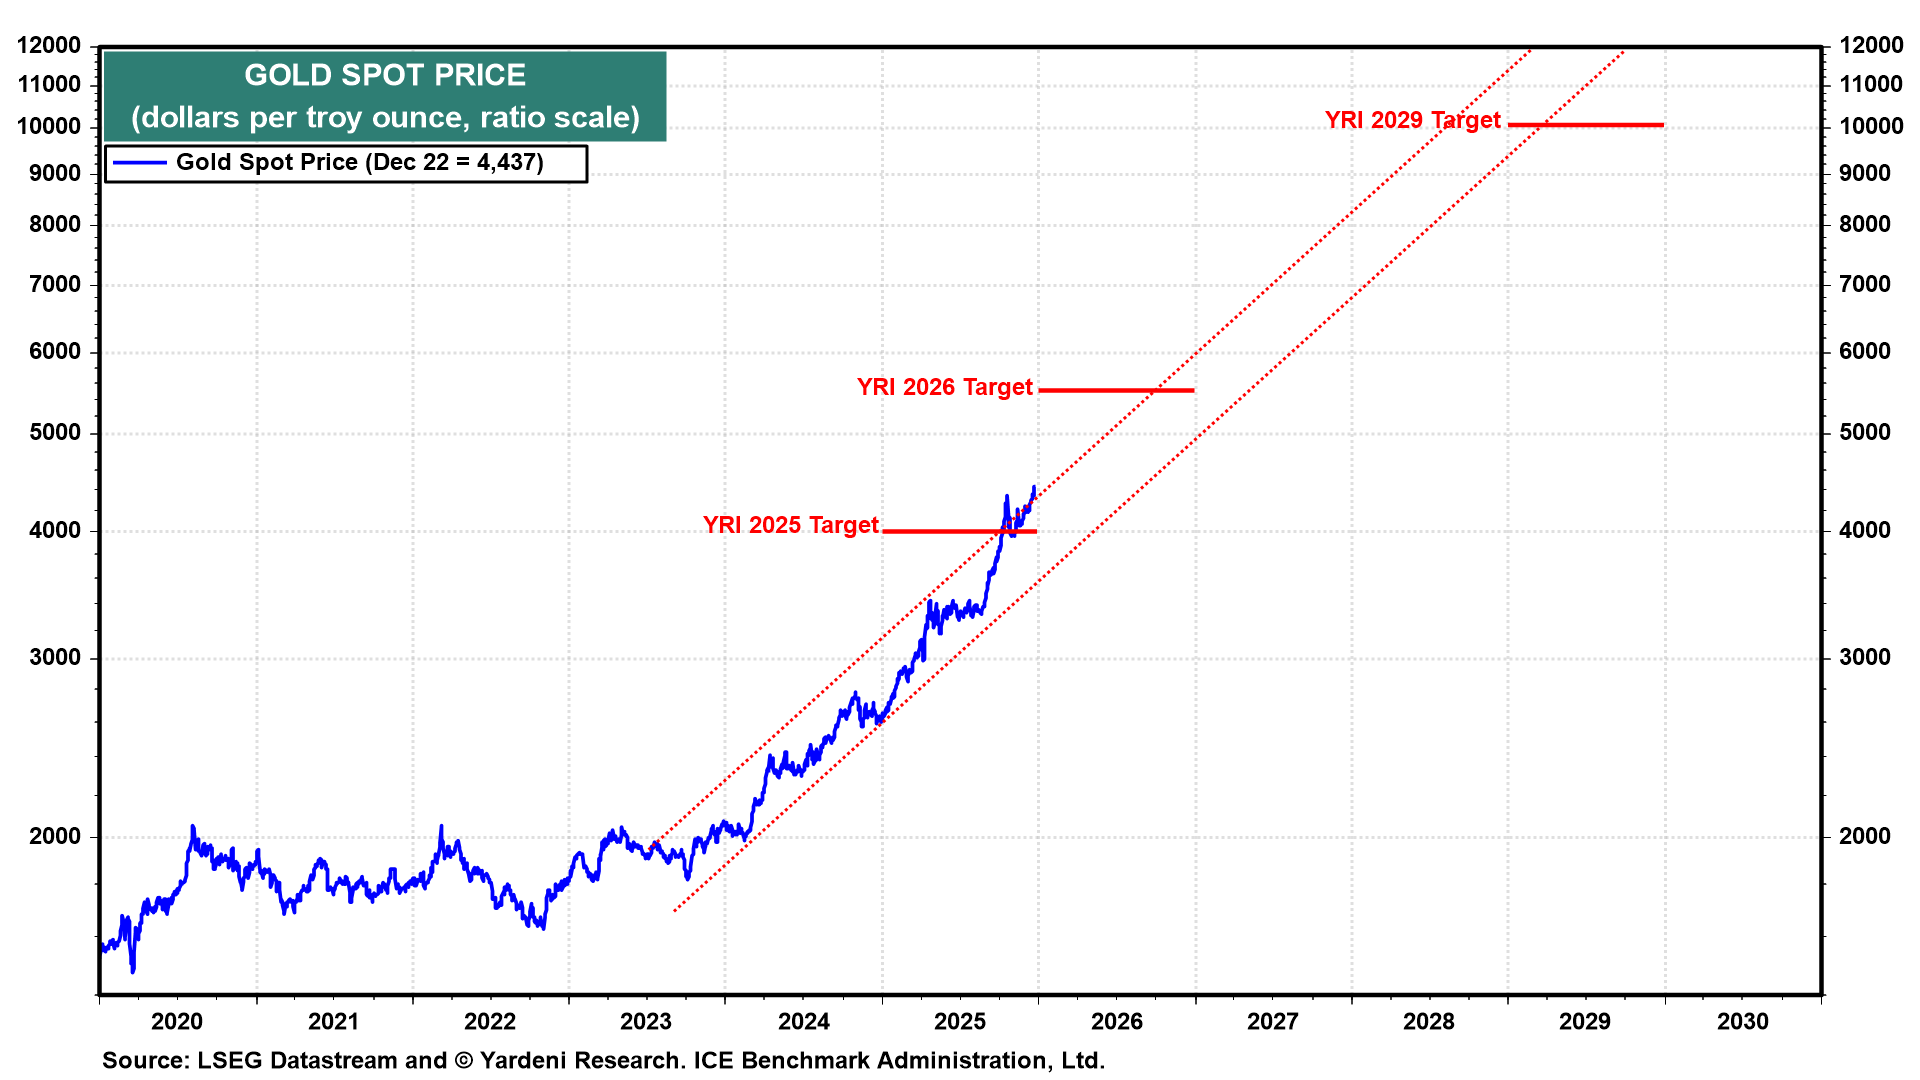
And many astute market observers think that gold could be much, much higher. Of particular note is Ed Yardeni of Yardeni Research, who has excellent form on predicting both the price of gold and the upward trajectory of US tech stocks. In his end-of-year update, Yardeni upgraded his forecasts for gold (and silver).
“We turned bullish on gold at the time, believing that central banks were increasing their purchases of gold in response to the freezing of Russia’s international reserves by the US and EU after Russia invaded Ukraine in early 2022. …When the price of an ounce of gold rose above $3,000 at the start of this year, we projected it would reach $4,000 by the end of this year and $5,000 by the end of next year. … We are raising our year-end 2026 target to $6,000 (chart). We still expect to see $10,000 hit by the end of the decade…..As we have previously observed, the S&P 500 and the price of gold are inversely correlated in the short term but appear to follow the same upward trend over the long term (chart). The price of gold is rapidly approaching the S&P 500 stock price index. If the S&P 500 reaches 10,000 by the end of 2029, as we expect, gold should trade at $10,000 if our trend analysis is correct.”
I’m increasingly inclined to agree with Yardeni’s analysis: it strikes me that gold is really the only reliable, liquid safe-haven asset left globally in a world of above-average inflation, ageing demographics and enormous government deficits.
If you agree with this analysis – and many won’t – then the final table below might be helpful. It shows the returns for the top unit trusts (in bold) and exchange-traded funds that invest in gold, silver, and other precious metals. I’ve also attempted to include, where available, data on these funds’ holdings, particularly the gold-to-silver split. I would point to the Charteris fund’s significant silver exposure, although in terms of performance, the top fund has consistently proved to be the SVS Baker Steel Gold and Precious Metals fund.
|
Fund Name |
YTD |
2024 (%) |
2023 (%) |
2022 (%) |
2021 (%) |
2020 (%) |
Gold |
Silver |
Notes |
|
SVS Baker Steel Gold & Precious Metals B Acc |
193.1 |
15.7 |
2.1 |
-2.3 |
-16.9 |
42.2 |
69% |
19% |
|
|
Ninety One Global Gold I Acc GBP |
173 |
10 |
3.8 |
1 |
-11.7 |
24.2 |
87% |
7% |
|
|
Jupiter Gold And Silver I Acc GBP |
172.9 |
22.1 |
-6.8 |
-2.3 |
-15 |
37 |
NA |
NA |
|
|
WS Amati Strategic Metals B Acc |
165.4 |
-7.1 |
-19.7 |
-5.1 |
– |
– |
38.60% |
15.20% |
Industrials 21% |
|
SVS Sanlam Global Gold & Resources B Inc |
166.3 |
9.8 |
-3 |
-3.3 |
-14.3 |
24.3 |
Managed now by NinetyOne |
||
|
YFS Charteris Gold and Precious Metals I Acc |
167.1 |
7.5 |
-16.7 |
-13.9 |
-22 |
35.3 |
28% |
67% |
|
|
UBS Solactive Global Pure Gold Miners UCITS ETF Dis USD |
162.5 |
29 |
3.9 |
2.8 |
-12.1 |
20.4 |
100% |
||
|
WS Ruffer Gold C Acc |
170.7 |
21.4 |
12.7 |
-11.3 |
-13.7 |
54.1 |
NA |
NA |
|
|
BlackRock Gold & General D Acc |
154.7 |
17.2 |
1.9 |
-6.5 |
-9.7 |
27.2 |
91% |
7.70% |
|
David Stevenson
Twitter: @advinvestor
This article is for educational purposes only. It is not a recommendation to buy or sell shares or other investments. Do your own research before buying or selling any investment or seek professional financial advice.


