
Bruce looks at what divergent performance between energy commodities and precious metals signal about industrial demand and Central Bank liquidity. Companies covered CAPD, CLBS and BVXP.
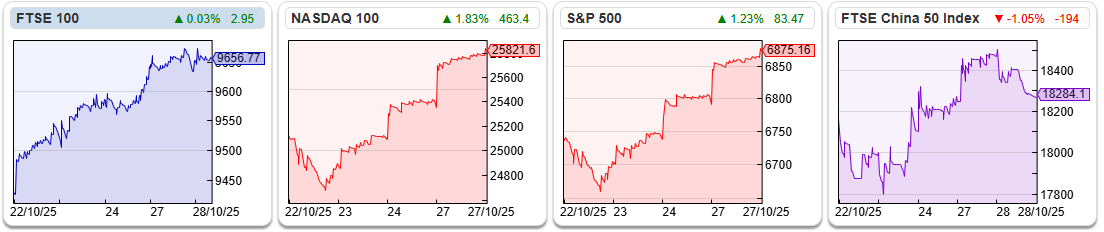
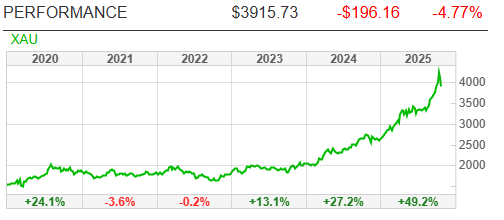
The FTSE 100 was rose +2.4% over the last trading days to 9,656. The Nasdaq100 and S&P500 were up +2.7% and +2.1% respectively. The CSI 300 Index (Shanghai) was up even more strongly +3.9% as Donald Trump seems to be walking back his previous tariff threats. Gold had a wobble, with XAU (the spot price) down -10% over the last 5 trading days to $3,916. Sharescope also has G$, which is the London Bullion Market (LBM) fix, which remains above $4,100 an ounce at the time of writing. G$ sees lower volume than the spot price and is likely to lag XAU.
I continue to keep an eye on longer term trends in commodities, as it seems odd to me that precious metals have done so well when energy and food prices have remained subdued. The chart below using Sharescope data shows the best and worst performers since Putin’s invasion of Ukraine. I suppose gold was obvious in retrospect, but it’s fascinating that energy prices: Natural Gas -25%, Oil (both Brent Crude and WTI) -35% and food (wheat and soybeans) are down around -40%.
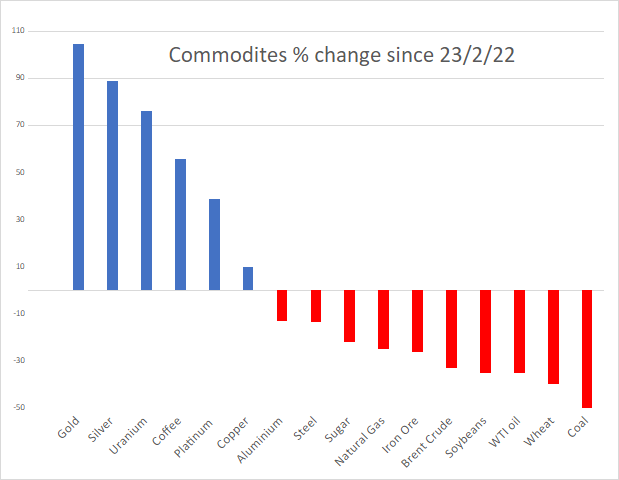
So far, this suggests we are not repeating the policy mistakes of the 1970’s, when energy costs led to second-round inflation spirals. Even Ukraine’s destruction of Russia’s refining capacity doesn’t seem to have had much impact on international oil markets. In fact, there have been various stories on Bloomberg, suggesting that there’s excess supply of oil, which China has been storing in strategic reserve tanks. The oil market is in contango (futures price higher than spot price) which is also seen as a signal of current oversupply.
I believe that the contradictions can be summarised as i) precious metals have been signalling abundant liquidity; while ii) falling energy costs imply weak industrial demand. As Central Banks, particularly the FED, are expected to cut interest rates, it’s not clear what has caused last week’s profit taking in gold. Up until last week the abundant liquidity/weak demand environment has been good for equities so I remain invested.
A reminder that Moneyweek Wealth Summit is on Friday 7th Nov and Mello London is Tuesday 18th & Wednesday 19th Nov. I’ll be at the former, but had already booked a flight out of London and will miss Mello this time.
This week I look at Capital Drilling which I’ve owned for a couple of years and turnaround situations Celebrus and Bioventix. I think it’s too early for those two, but worth following progress.
Capital Drilling Q3 Sept Trading Update
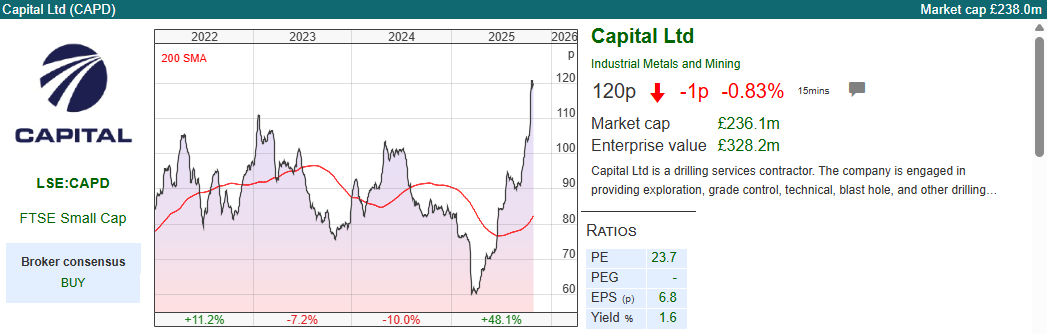 This gold mining services company strikes me as an interesting way to benefit from the rising gold price. Naturally there are companies like Empire Metals (up almost 30x) and Serabi Gold (up 14x) that have performed astonishingly well over the last few years. However, these are really hard to identify ahead of time. The only person I know who claimed to be able to pick small cap gold miners is the former fund manager Richard Lockwood, whose performance was so bad he had to close down his Praetorian Resources vehicle after only a couple of years.
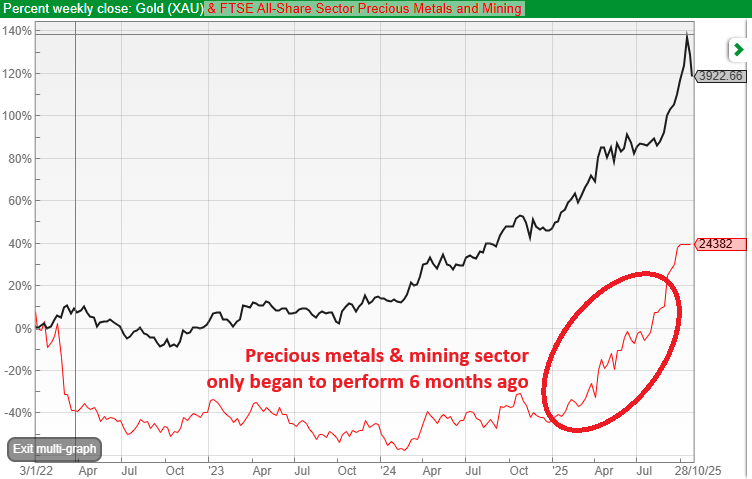
Below ShareScope’s “multi-graph” feature shows that the FTSE Precious Metals sector has lagged the rising price of gold for a couple of years, and mining shares only really began to start performing six months ago, when the gold price had already risen by +70% from the beginning of 2023.
Instead, Capital is more of a “picks and shovels” business, providing drilling rigs but also Photon Assay (checking the gold content of gold mine samples) via their MSALABS subsidiary. In theory, that means
CAPD share price should behave less like a “lottery ticket” and instead should benefit from the helpful conditions with less stock specific risk.
The company reported flat Q3 Jun-Sept revenue at $94m, but within that Drilling (2/3 of group) was up +2%, whiling Mining (1/10 of group) was down -60% and MSALABS doubled to $21m. Management increased FY revenue guidance to $320-$340m at Q2, and they’ve now increased that range to $335-350m. Tamesis their broker are forecasting flat FY Dec revenue at $348m, but then growing +17% FY Dec 2026F, with PBT forecast up +42% to $49m Dec 2026F.
 Fleet Utilisation stood at 76% (versus 75% long term target). I think given the geographic spread of the business that it’s not possible to achieve close to a 100% utilisation rate, as it takes time to move the equipment from site to site.
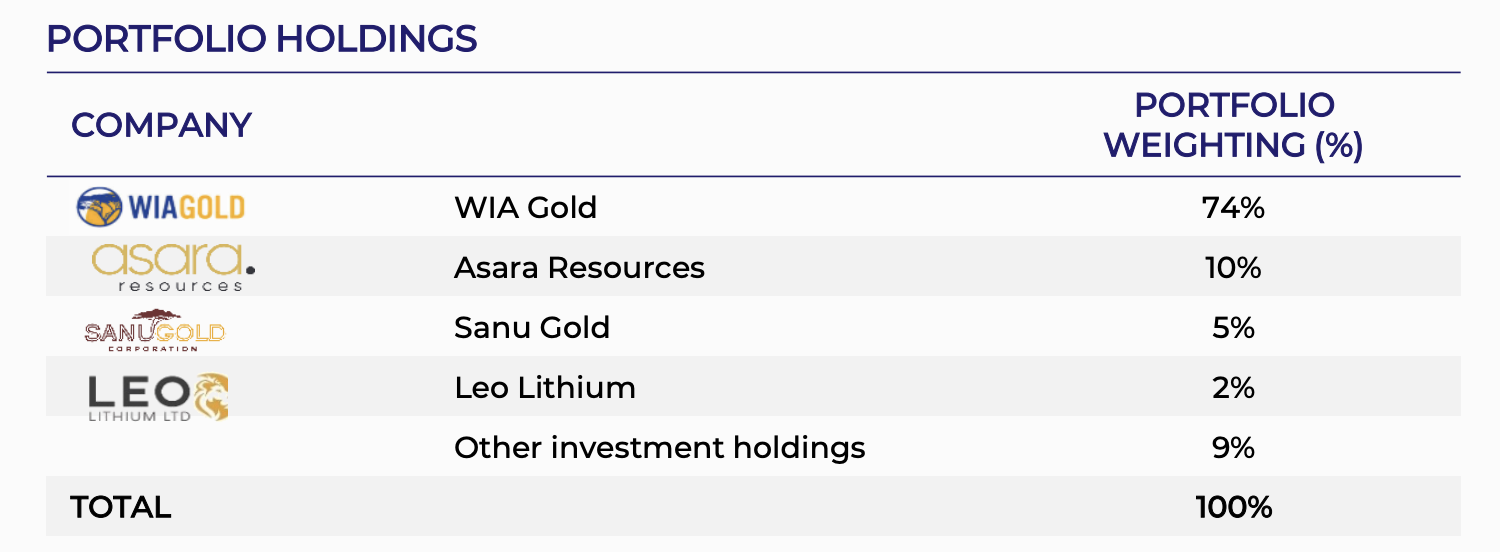
Investments: CAPD will accept equity in gold miners as well as cash for their services. Hence, they have an investment portfolio of $74m of both listed and unlisted gold mining shares end Sept, up +49% in Q3. Having sold shares in Predictive Discovery for $31m in August last year, their largest holding is WIA Gold, which was ¾ of the total portfolio at H1. Below is a table they put up in their H1 analyst presentation.
 The RNS doesn’t contain a net debt figure, but at H1 this stood at $55m, and excludes the portfolio of investments, which can be sold to realise value at a favourable time.
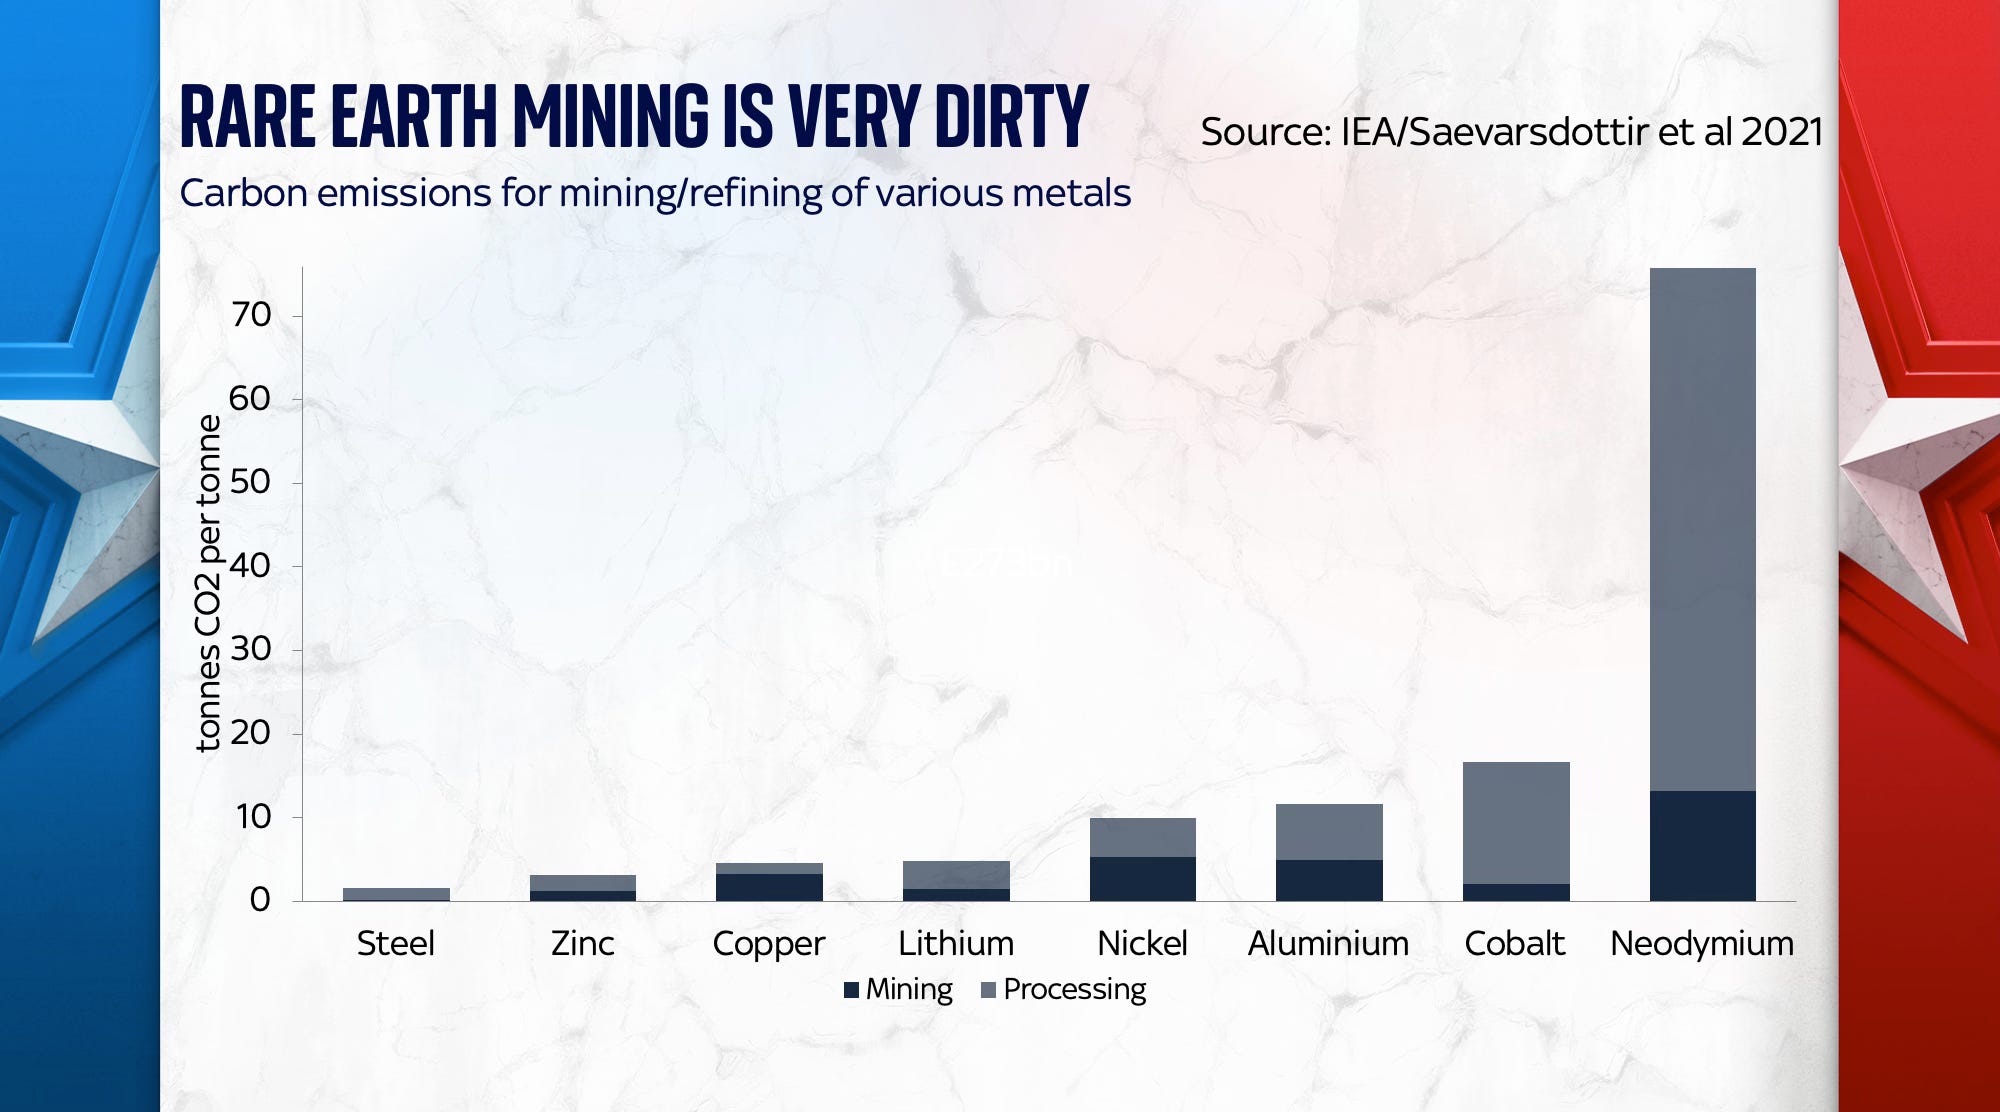
Longer term: I also wonder if longer term CAPD might benefit from Western democracies realising that we have become too reliant on rare earth’s sourced from China. Ed Conway, who wrote the book Material World, points out that rare earths are not rare, but they are difficult to refine, with very nasty waste products. That’s why G7 nations have, until now, been happy to let China do our dirty work. So, even if you disagree with CAPD management that we are seeing a multi-year gold mining cycle, there’s potential upside for CAPD to benefit from this type of mining.
Valuation: The shares are trading on 10x PER Dec 2026F, dropping to 8.4x the following year. They look even better value on an EV/EBITDA of below 4x Dec 2026F, which excludes gold mining investments. At $74m (£55m) that investment portfolio is worth 28p per share or just under a quarter of the market cap.
Opinion: This has doubled since April, but worth noting that for the preceding 3 years the share price was dull even as gold glistered. I think CAPD have significant potential, and ought to be less risky than buying shares in gold miners directly. Annoyingly, this is another one I bought too early but I will continue to hold.
Celebrus H1 Sept Trading Update
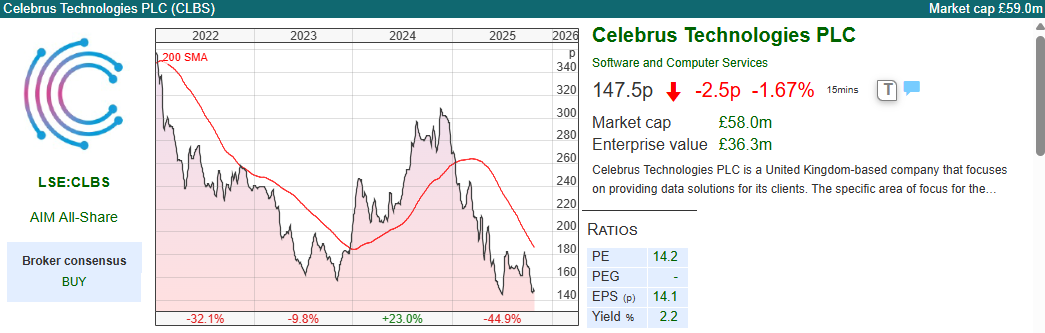 This fraud prevention and digital identity group that used to be called D4T4, announced an “in line” trading update. We need to be careful though: the group has a history of announcing “in line” current year results, but asking their broker, Cavendish, to slash the next year’s earnings forecasts by -30%, which I wrote about back in 2021.
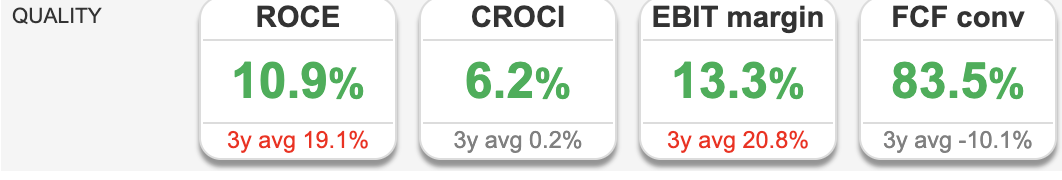
Checking Cavendish’s broker note following last week’s RNS, they have left their FY Mar 2027F forecast of $27m unchanged, which implies +15% revenue growth, and statutory loss to narrow to $200K in FY Mar 2027F. The group can easily fund those losses, as cash stood at $27m (around a third of the current market cap). Cavendish also forecast a strong rebound for FY Mar 2028F for $4.1m of PBT, with the broker forecasting an EBIT margin of 14%.
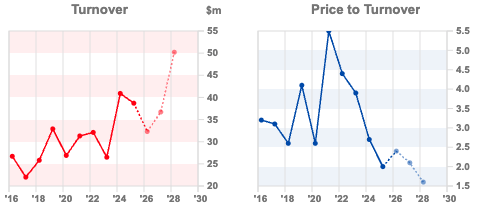
Looking at ShareScope’s revenue chart, we can see that, despite the emphasis on ‘recurring revenue’, this business suffers from lumpy year-on-year demand. The turnover chart on the left is so jagged, it reminds me of the skyline of the mountains in Svaneti, Georgia. Unsurprisingly, investors have de-rated the shares.
At the H1 Sept 2024 results, released in December last year, management said that they were in line with FY Mar 2025 consensus of $44m revenue and $8m adj PBT. By April, they were warning that FY Mar 2025 revenue would miss by 12%, which is an alarming miss given that the first 9 month of the financial year had already been achieved by the December “in line” outlook.
The April revenue warning RNS also contained an “accounting policy review” looking at how multi-year contracts were recognised, specifically the definition of Annual Recurring Revenue (“ARR”) and the profile of its software license revenue recognition. In addition, management have decided to resell less third-party, non-Celebrus software. Management said that they would give more detail later in the year, but investors correctly interpreted that guidance to mean lower revenue and lower profits, so the shares sold off. Management also changed their reported currency from pounds to US dollars.
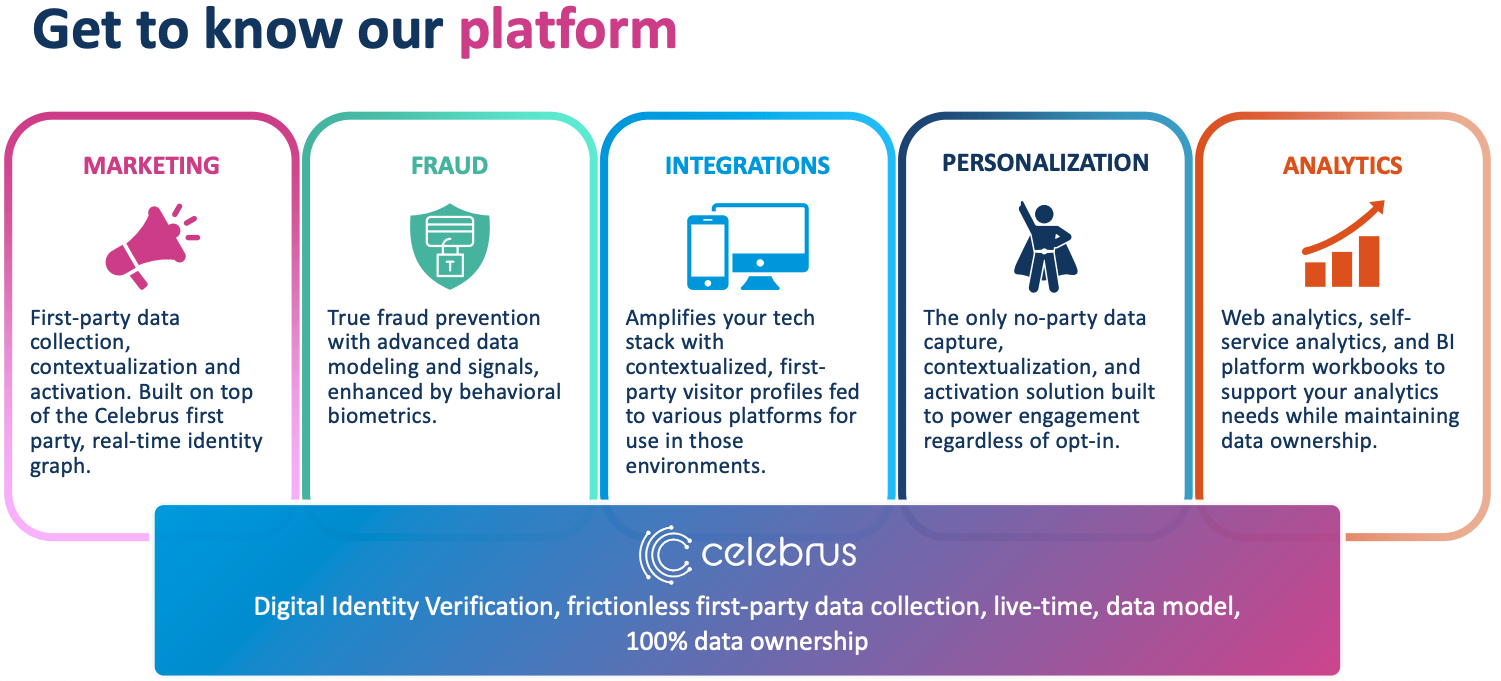
Inevitably, given the statutory losses, but high gross margin and forecast rebound in profit FY Mar 2028F, management believe that the group is a “platform”.
Valuation: The shares look very expensive on FY Mar 2027F forecasts, so we need to wait until Mar 2028F for the PER ratio to drop below 20x and EV/EBITDA below 7x. So even with the share price falling -45% YTD, much of the recovery seems to be priced in.
Opinion: Readers who don’t own the shares may enjoy the irony of revenue recognition accounting policies causing problems for this type of business. Both the high valuation and the uncertain timing makes me cautious, it feels too early to flag this as a turnaround. CLBS will take time to rebuild trust with investors, I think. Similar to GB Group, this ought to be a business with attractive growth and returns, yet management have failed to execute, for reasons that are not clearly laid out in the voluntary disclosure. I wouldn’t dismiss the investment case, the cash is real and the gross margin is attractive. So I think that it could be worth revisiting in 6-12 months to see if the group can start to deliver.
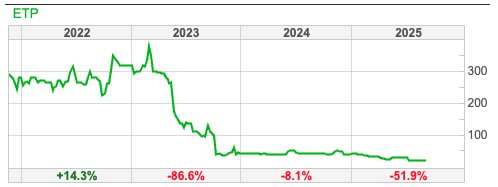
More generally, the 2021 experience suggests that it is worth tracking which management teams announce inline results, but ask brokers to cut numbers. Another example from 2023 springs to mind: Eneraqua announced a “significantly ahead” outlook statement, while the share price crashed -50% as PBT margin guidance was reduced. Fast-forward two years ETP shares have de-listed, as the chart shows below. At the very least, management who play this game of “upbeat RNS, broker downgrades” feel uncomfortable communicating directly with shareholders about deteriorating future expectations. That, in turn, can be a revealing “red flag” as the later share price performance of D4T4/Celebrus and ETP shows.
Bioventix FY June Results
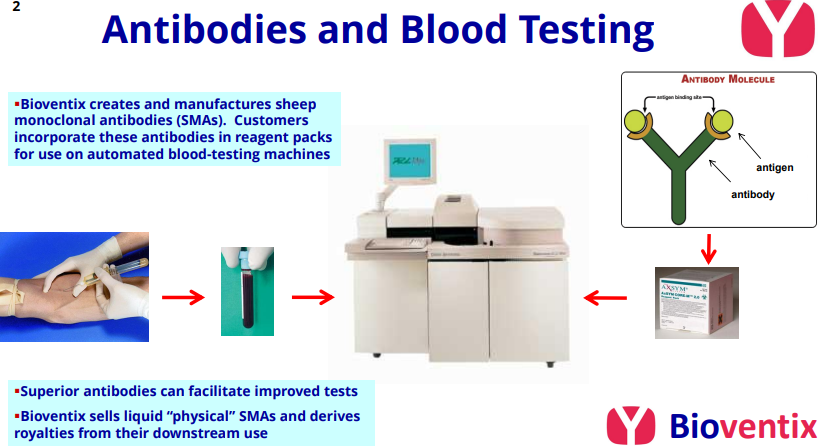
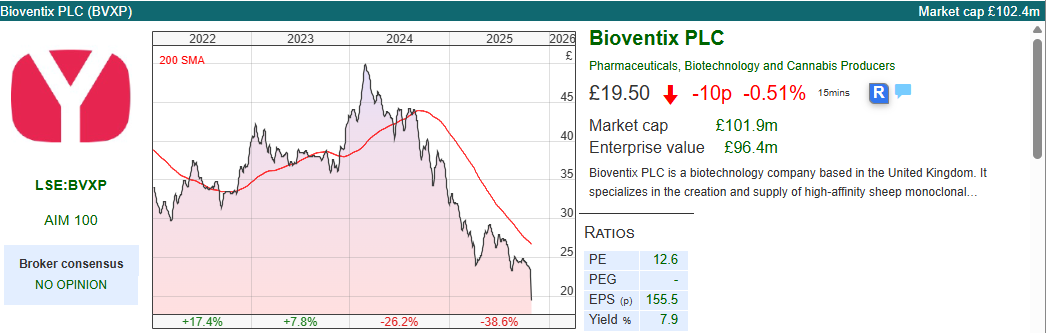 This medical diagnostics group which specialises in sheep monoclonal antibody which are used in blood tests (In Vitro Diagnostics or IVD), was a former multi-bagger. The shares rose from below £2 a share 15 years ago, to peak at over £50 per share in early 2024, but have now come off -60%. Worth noting that Peter Harrison, Chief Executive sold £2.6m worth of shares in January 2024 “to enable a new institutional investor to join the share register.” There’s nothing wrong with this, Sharescope shows he still owns 5.79%. Just a “note to self” to keep track of director selling, particularly when shares have been strong performers and there are no obvious signs of deterioration.
BVXP reported H1 June revenue down -4% to £13m and PBT down -5% to £10m. So, despite the difficult revenue environment, the group has an eye catching 77% margin. Cash at the year end was £5m, after paying total dividends of 150p (over £8m).
Outlook: The problem has been driven by the Chinese Communist Party’s “China First” policy, resulting in two trends that adversely affect Bioventix:
i) longstanding Western IVD customers are suffering both a loss in volume and pricing power, as Chinese IVD compete for market share on cost. This in turn reduces the royalties that BVXP earns for assays.
ii) Local Chinese IVD companies who have used Bioventix antibodies have been encouraged to seek cheaper, royalty-free local alternatives to sustain their own businesses. They think that the pressure to switch to cheaper antibodies will continue: perhaps a 2% reduction in annual revenue short term and potentially an additional 3%-4% also at risk in the medium term.
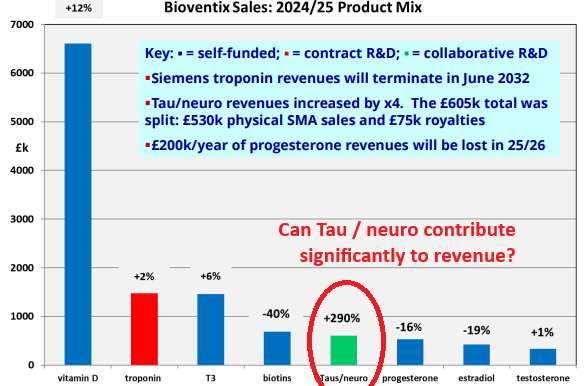
Reflecting that uncertainty, Cavendish their broker, have only now introduced FY Jun 2026F estimates, showing revenue declining -5% y-o-y and EPS down -6% to 136p FY Jun 2026F. The dividend of 150p is uncovered, presumably the analyst would have talked with management and they are comfortable with that. Possibly management wish to signal that the Alzheimer’s Disease tau/neuro antibody diagnostic sales, which increased four-fold from a low base, could make a significant contribution in future years, so they feel that the dividend is sustainable?
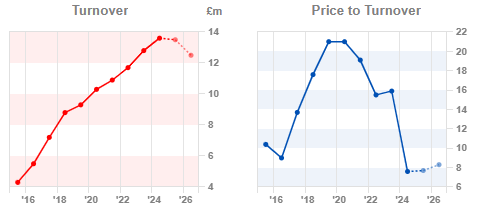
Valuation: The shares are trading on a PER of 14.4x June 2026F and 10x EV/EBITDA the same year. ShareScope’s mini charts show that at their peak the shares were trading on above 20x revenue, versus around 8x now.
Opinion: Leon Boros has made good money on this, but pointed out a year ago that management don’t have good visibility on future revenue: once their test has been incorporated into diagnostic blood testing machines, they receive revenue payments. However, they don’t have a good feel for competitive developments in the market and potential substitution effect. That seems to be echoed by management commentary in the RNS and also the lack of Cavendish forecasts beyond FY Jun 2026F.
Historically medical diagnostics and medical devices have been lower risk for shareholders than bio-techs trying to develop drugs to cure hard to treat diseases like cancer, Alzheimer’s or Parkinson’s.
My view is that BVXP worth following to see if they can find new revenue opportunities in adjacent areas, but I don’t own any and remain cautious for now. Looking at the chart the BVXP investment case now suggests that some investors have lost faith.
Bruce Packard
@bruce_packard
Notes:
Bruce owns shares in Capital Drilling
This article is for educational purposes only. It is not a recommendation to buy or sell shares or other investments. Do your own research before buying or selling any investment or seek professional financial advice.


FYI – This link is wrong:
but pointed out a year ago that management don’t have good visibility on future revenue:
Thanks Charles – not sure what happened there. That has been amended to the correct YouTube video. Two other links (Georgia skyline and Eneraqua announcement) had also gone amiss. These have both been corrected too. Thank you for flagging this with us.
I don’t think it is at all odd that there is a divergence in soft commodities. My own view is that they are being deliberately suppressed for the simple reason that central governments are trying to tame the inflation they created with loose money and the last thing they want in the inflation frame is soft commodities (wheat, cotton etc) inflation showing up in the high street measurements they prefer to focus on for obvious political reasons. The FED et al want every reason to bring interest rates down even if it is a sham.