
Looking to build reliable cash flow with ShareScope? We’ve created this Income Stock Screening Guide to go with our off-the-shelf Income Screen to help you learn how to spot them. It’s designed to highlight the key signals we believe matter when searching for sustainable, high-quality income.
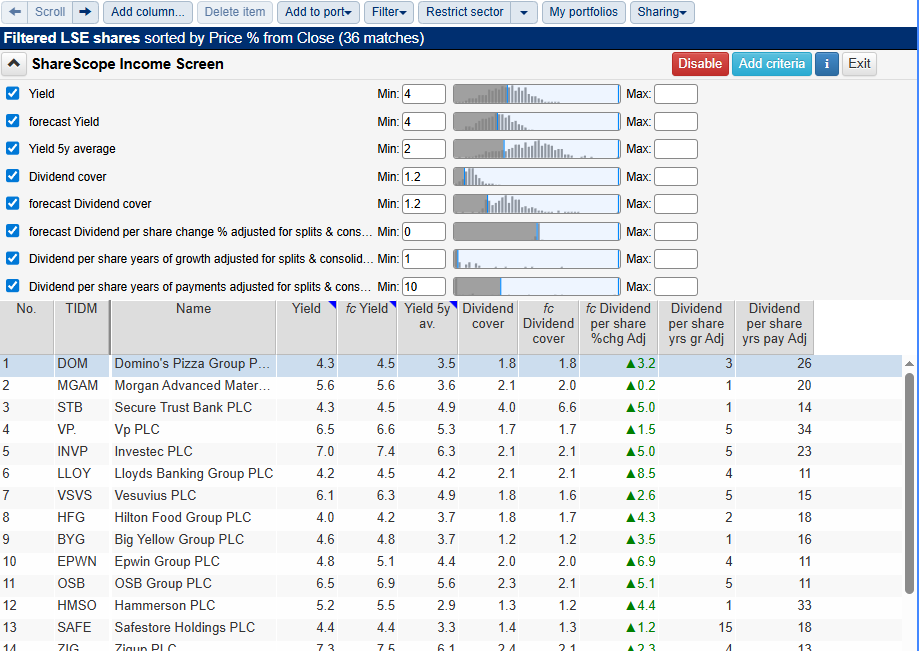
ShareScope subscribers can apply this screen at the click of a button on the home page in ShareScope – click on the “house” icon near the top left of the program and then scroll down the home page to the Popular Stock Screen section.
Use it as a starting point: explore the logic, dig into the data, and then make the screen your own.
What Is an Income Stock?
An income stock is a company known for consistently paying dividends, often with a track record of increasing those payments over time. These businesses appeal to investors seeking stable, long-term income—whether to reinvest or draw as cash flow.
Why we chose these criteria
1. Strong Yield Performance
- Yield ≥ 4%
A minimum current dividend yield of 4% ensures that the stock delivers a meaningful income relative to its share price. This threshold screens for income-generating potential right now.
Jargon Lite Version: For every £10,000 invested, you receive at least £400 annually in dividends.
- Forecast Yield ≥ 4%
Future expected dividends should also yield 4% or more, helping ensure the income stream continues to meet expectations going forward.
Jargon Lite Version: This shows what the Analysts believe the dividend yield will be at in the future. By matching this to our Yield criteria we are insuring this should be same going forward too.
- 5-Year Average Yield ≥ 2%
This historical view highlights companies that haven’t just offered strong yield recently but have a consistent income track record.
Jargon Lite Version: The stock has been a reliable income generator of at least half what we are looking for now (4%) not just recently, but consistently over the last 5 years.
2. Dividend Security
- Dividend Cover ≥ 1.2
This ratio tells us how many times over the dividend is covered by earnings. A value over 1.2 indicates a cushion, meaning payouts are more sustainable even during economic blips.
Jargon Lite Version: The company earns at least 20% more than it pays out in Dividends e.g. £1.20 for every £1 it pays in dividends—a safety buffer.
- Forecast Dividend Cover ≥ 1.2
Looking ahead, dividends remain protected if forecast earnings are also sufficient to cover them. This is key for long-term dependability.
Jargon Lite Version: Even under future projections, the company should safely cover its payouts. This shows what the Analysts believe the dividend cover will in the future. By matching this to our Cover criteria we are insuring this should be same going forward too.
3. Growth and Consistency of Dividends
- Forecast Dividend per Share Change (%) ≥ 0
This ensures that the dividend is not expected to shrink. At a minimum, it should remain stable—or ideally, grow.
Jargon Lite Version: You’re not likely to suffer dividend cuts.
- Dividend per Share Years of Growth ≥ 1
At least one year of growth in dividend per share shows positive movement, not stagnation. It can also suggest that the company is shareholder-focused.
Jargon Lite Version: The company has rewarded shareholders with increasing income.
- Dividend per Share Years of Payments ≥ 10
A decade of uninterrupted dividend payments demonstrates reliability, resilience, and board-level commitment to income investors.
Jargon Lite Version: The company has paid dividends uninterrupted for at least a decade.
Who Is This For?
This screen is ideal for:
- Income-focused investors
- Anyone seeking a steady income stream from equities
Make It Your Own
This screen offers a foundation for identifying reliable dividend payers with growth potential. Now that you understand what each criterion means and why it matters, you can take it further:
- Focus on specific sectors.
- Adjust thresholds depending on your income needs or economic outlook
- Add filters for dividend payment frequency or payout ratios
Learn More About Income Investing
Want to sharpen your income strategy? Dive into Chapter 10 of our Step-by-Step Guide to Investing to explore how to build a dependable dividend portfolio, understand payout patterns, and balance yield with risk.
Read Chapter 10 – Income Investing
We’d love to hear your take. Are these the kind of income-focused criteria you typically use? What would you tweak—or add entirely? Maybe you’ve crafted your own income screen that works wonders. Share your thoughts in the comments, whether it’s feedback, suggestions, or your own strategies.
This article is for educational purposes only. It is not a recommendation to buy or sell shares or other investments. Do your own research before buying or selling any investment or seek professional financial advice.


HI, thanks for the article, while a useful starting point I think it is a bit simplistic and some of your figures are a little on the low side. I guess this is down to the problem with screens that if you set the hurdles too high or have too many criteria then you end up with a very limited list or no results at all at the extreme.
I think your cover ratio of 1.2x is at the low end of what one would want for dividend sustainability, 1.5x to 2x is generally seen as more indicative of a sustainable dividend. In fact the average across UK dividend paying stocks is currently around 2.8x. I personally also factor in coverage by free cash flow and some what surprisingly the average cover on this measure across UK dividend paying shares is currently 3.3x.
In addition the 4% yield you have chosen is not that high as the average across dividend paying UK equities is currently 4.59%, although as you say peoples requirements will vary. While your growth figure of >0% is also low as the average dividend growth rate over the last 5 years is around 5%, but I can see why you have set it there to exclude those that are forecast to cut, which you would probably want to do.
Personally I like to look at more factors and compare these across a universe of around 438 dividend paying stocks in the UK market. Thus I can see how a share compares on the various different factors and overall.
For this I use other valuation measure as well as yield as yield alone is not really the best way to identify value. Then in addition to the earnings and cash flow cover mentioned above I also look at the quality of the company providing those earnings and cash flows as well as measures to identify how secure or otherwise their finances are. I also look at historic and forecast dividend growth rates and pay attention to estimate revisions to see how likely it is that these forecasts might be met and also pay some attention to price momentum.
Overall I have found this a great way to identify good quality dividend growth stocks with strong balance sheets which are good value and that are being upgraded and outperforming the market. It seem to work for me as I have been able to outperform the market by 5% per annum over the last 10 years using these Compound Income Scores, which I make available to investors for a modest fee.
Thank you for taking the time to share such detailed and thoughtful feedback, it’s much appreciated.
You’re absolutely right that screens involve a balancing act. Set the criteria too high and you risk returning very few results, but go too low and the quality may suffer. We chose more modest hurdles in this piece to offer a broad starting point for readers, especially those newer to dividend investing, but your points about cover ratios, yield thresholds, and growth expectations are well taken.
It’s especially helpful that you highlighted both earnings and free cash flow coverage, as well as the broader averages in the UK market. We also appreciate your perspective on the importance of incorporating quality, valuation, and momentum factors alongside yield, and how you’ve built a more comprehensive framework through your Compound Income Scores.
Thanks again for the input – other readers of this guide will no doubt find your approach and insights very useful as they consider how to refine their own strategies.