A look at Nvidia, which is forecast to grow sales by 11x since 2020, compared to Cisco Systems valuation in the previous technology bubble. Companies covered BUR, CGEO and GHH.

The FTSE 100 rose +1% to 8,294 last week. The Nasdaq 100 has recovered strongly from its wobble earlier in August, and was up +5.4% in the last 5 trading days, with NVIDIA up +19% (market cap $3.1 trillion). The Nikkei 225 was also up strongly +9.3%, while even the FTSE China 50 was up more than +3%, so sentiment has improved across the globe. Brent Crude fell -4.4% to $78 per barrel, meaning energy costs look to be under control. Even the Ukraine war seems to have taken a turn for the better, with the invasion of Kursk appearing to have been well-planned and well-executed.
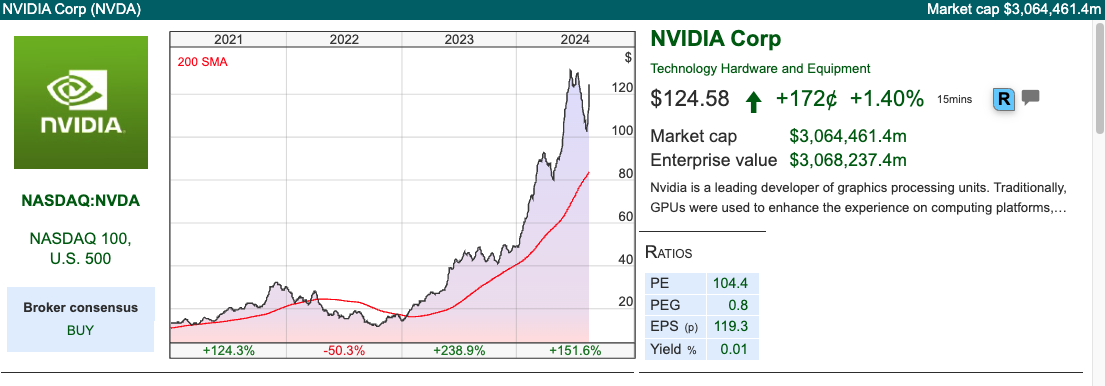
There are many ways to benefit from Sharepad’s multitudes of data, features, charts etc but one of my favourite use cases is for cross-checking articles that I have read. I came across this analysis comparing Nvidia now to Cisco in the late 1990’s when the latter had a market cap of $555bn and was briefly the most valuable company in the world. Cisco hit a peak in March 2000, trading on over 200x PER and 27x sales, but then fell around 90% and reported a loss FY Jul 2021. For comparison, Nvidia is trading on a more reasonable PER of c. 30x Jan 2026F and 16x sales but has a market cap over $3 trillion, third behind AAPL ($3.4tr) and MSFT ($3.1tr).
That sparked my interest, not so much in what the Cisco share price had performed over the following decades (badly), but how much Turnover and PBT CSCO delivered. Using Sharepad’s financial charts to graph fundamental data, it’s possible to see how things turned out.
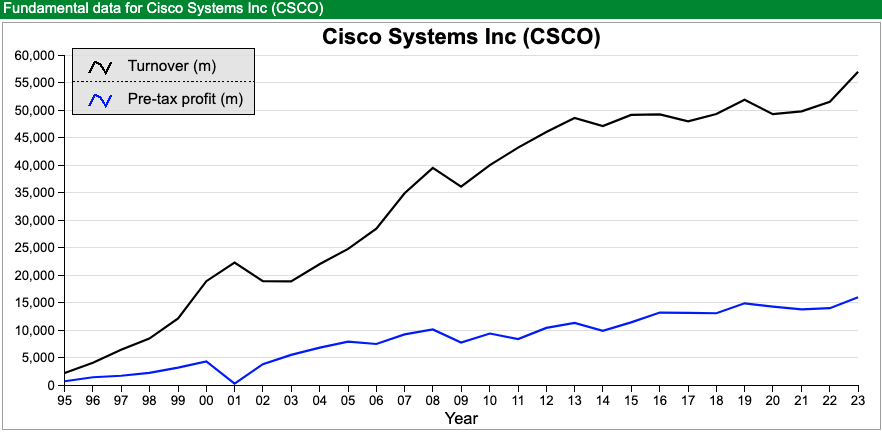
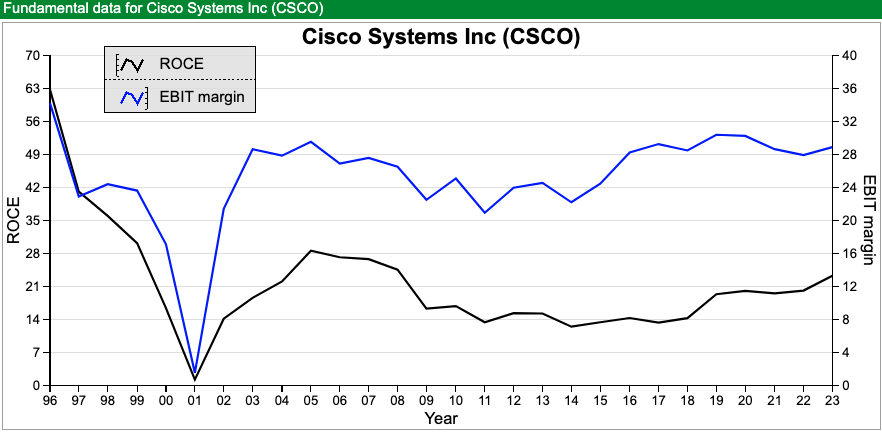
In short, what Cisco has delivered turnover and profit growth, with an EBIT margin of around 30% and high single-digit then improving to mid-teens RoCE. That doesn’t look too bad. The problem was that the business was trading on an extremely high multiple of peak profitability, and the supernormal growth and profits of the 1990s could not be extrapolated into the future.
Cisco is currently trading at $45 per share (market cap $200bn), down from $80 per share, which it achieved at its peak 2.5 decades ago. One feature of Sharepad is that it is possible to switch the financial charts from just one “Instrument” looking at one company, to “List” (circled in red) which allows users to compare the same datapoint (in this case turnover) from two or more companies.
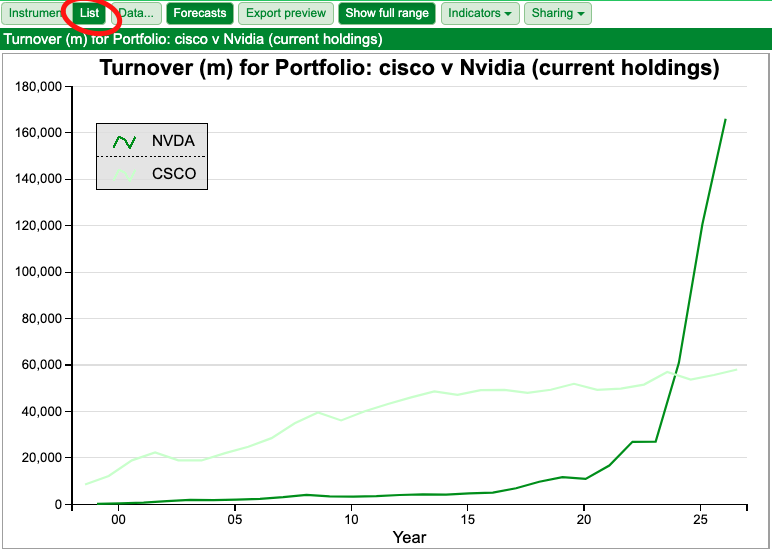
History suggests that investors will extrapolate NVDA’s growth and profits into the future, and at some point, those forecasts will be too optimistic. That’s not to say NVDA is a bad company, or won’t deliver decades of growth, but the growth rate of increasing revenue by 11x between Jan 2020 and Jan 2025F is not sustainable over the long term. It is the change in the growth rate and profitability that is likely to lead to disappointment for investors.
This week I look at litigation finance company Burford and Georgia Capital, two companies which the stockmarket finds hard to value. Then I finish with Gooch & Housego’s profit warning.
Burford H1 Jun Results

This dual-listed litigation finance group, that has won a $16bn claim against the Argentinian government, updated the market with H1 Jun results. The basis of preparation with fair value accounting and consolidated third-party funds, plus the inherently uncertain timing of legal matters, means that this is not an easy company to value. Nevertheless, I do enjoy trying to make sense of what is going on.
Revenues were down -61% to $198m for H1 Jun 2024, and net income was down -90% to $23.4m. However, that was driven by a favourable $182m prior year write-up of YPF (the Argentinian court case) asset in Q1 last year. They give an “underlying” figure on page 8 of the analyst slide pack, which still shows a -31% decline in H1 (realised and unrealised gains but ex the $182m YPF write -up). “Burford only” (which excludes the third party funds) Q2 this year v Q2 last year showed revenues trebling to $137m and Q2 net income of $54m v $21m loss in Q2 last year. So, on that basis, Q2 does look like a good quarter.
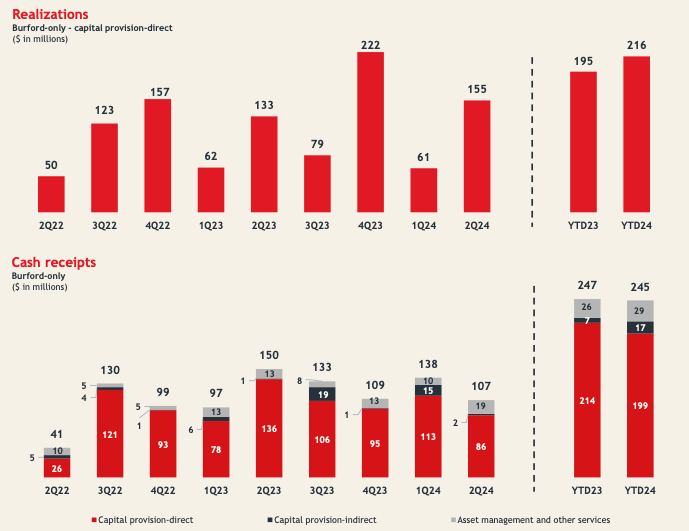
H1 cash realisations were $245m (down -1% v H1 last year), of which $107m was in Q2 (-28% v Q2 last year). Management point to “realisations” which is the total gain when a dispute is resolved, and excludes previously recognised fair value adjustment. This figure was up +16% to $155m v Q2 last year with a ROIC of 179%. The H1 figure of $216m realisations is the highest since H1 2020, as the pandemic backlog continues to clear.
There’s no explanation why the cash figure is down but the other realisation figure is up, but presumably it is a timing difference between a favourable realisation and Burford receiving the cash. Management say that quarterly cash receipts have been around $100m in each of the last 8 quarters.
Court case against Argentina: In September last year the shares rose c. +30% in a day to 1340p, after a NY court said that Argentina owed $16bn in damages for expropriating an oil company YPF, of which the face value of Burford’s share of the claim could be worth $6.3bn or c £23 ($29) per share. Unsurprisingly the Argentinian Govt are appealing this judgement, and the appeals process could take another year or two. During this time Burford is allowed to enforce the original judgement, by going after Argentinian assets. This FT article suggests though that the process is not straightforward though, because Argentina says there are no substantial assets within the US jurisdiction. In response, Burford seem to be going after state-owned companies and even the Banco Central de la República Argentina (BCRA). Perhaps not coincidentally, economy-minister Luis Caputo said the central bank had sent some of its gold (Argentina has just under $5bn of gold reserves) to an undisclosed location abroad.
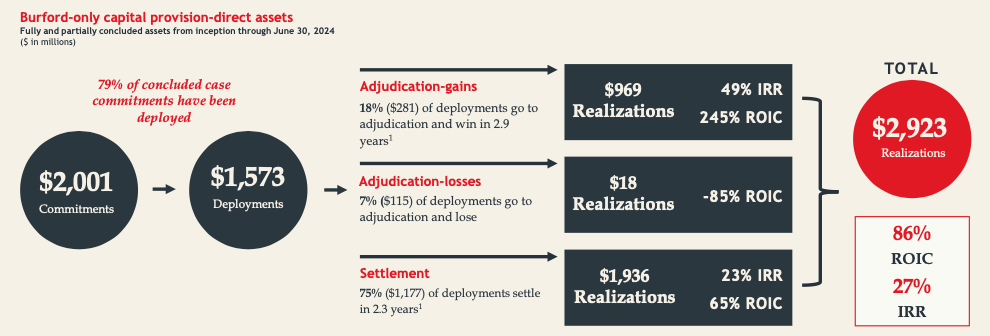
Valuation: Burford’s tangible book value is 778p per share. However, it’s worth noting that “tangible” in this case does include $1.8bn (or 650p per share) of unrealised fair value accounting gains – of which the YPF claim against Argentina is $1.4bn (just under 500p per share), with $500m (180p) of unrealised other fair value gains. So if you want to exclude Argentina, then the shares are trading on 3.6x tangible book value, or 10x book value excluding FV write-ups completely.
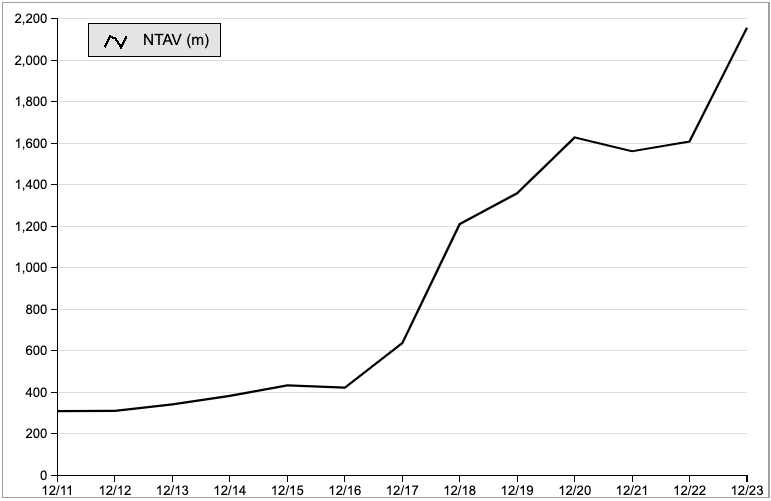
Unlike banks which also have balance sheets stuffed full of fair value accounting assets, Burford has at least managed to grow tangible book value to $2.2bn, up around 5x since 2016.
Alternatively, the business has generated c. $400m of cash for the last couple of years, less somewhere between $271m (FY 2023) and $134m (H1 2024 annualised) of operating expenses. Assuming a tax rate of 20%, and converting to pence, would give an EPS of between 37p to 76p – that’s just a very rough calculation because Burford don’t give enough disclosure to calculate cash returns.
Opinion: I own this, having bought in a couple of times at below £5 and I think it’s fun to follow. The market struggles to value the shares (previous peak £20 in Aug 2018, pandemic low in Mar 2020 £3.30 per share). The assets are of uncertain value and timing, but they’re being financed with debt (bonds) which does create refinancing risk. Currently, net debt stands at 0.8x tangible equity (versus 1.5x to 2.0x US bond covenants), so the business no longer looks distressed and there could be an upside, in my view. I think now the business has reached maturity, management would benefit from providing figures that make it possible to do a CashRoCI calculation, as investors are rightly suspicious of fair value accounting.
Georgia Capital H1 Jun Results

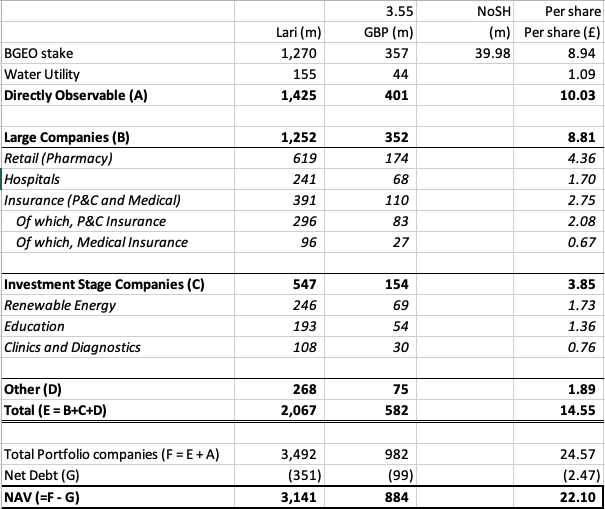
This Tbilisi-based spin-off from Bank of Georgia announced mixed H1 results, with NAV per share falling to 78.55 GEL (GBP £22.10 a -9% decline in GBP versus Dec 2023 and -16% decline versus Mar 2023). For contrast the share price has fallen almost -30% from the end of March. The shares now trade at a discount of less than half book value.
Some of that weakness has been caused by Georgian Lari depreciation, due to political protests against the ruling Georgian Dream party, but also a rising discount rate used to value the portfolio of businesses. The Central Bank has actually cut interest rates from 11% to 8% this year and last, but following protests about the Georgian Govt’s “Russia Law”, aimed at foreign-financed NGOs, the sovereign bond spread blew out 150bp (now recovering c. 75bp) so the discount rate used to calculate the firm’s cost of equity increased.
It’s also worth remembering that CGEO owns a stake in BGEO, that is worth around £9 of CGEO’s £22 NAV, down from over £11 at the end of March. So there’s a double exposure to country risk, but if you think Georgia has a future as an independent country, then to me that counts as a positive.
Operationally, performance looks encouraging. Revenue growth for the unlisted businesses is +7%, with an improving margin so EBITDA growth is mid-teens. Within that, the two largest businesses (Pharmacies and Hospitals) are up less than 5%. However, other businesses such as Insurance are showing good growth, particularly Medical Insurance +70% as well as the smaller “Investment Stage” companies like Renewable Energy +34% and Education +29% are doing well.
The original intention of CGEO management was to invest and grow businesses in Georgia. However, the shares are trading at such a large discount, and most of the businesses are now FCF positive, so that management have earmarked $110m (c. 19% of the market cap) for share buybacks and dividends through to the end of 2026.
Valuation: I’ve updated my valuation table, showing the NAV in Georgian Lari, then converted to GBP and divided by the shares outstanding.
Opinion: The Georgian elections are in October, which seems an obvious catalyst. If the Georgian Dream party manage to hold on to power, there are likely to be accusations of vote rigging and possibly also street protests. That said, I don’t think there’s much appetite for internal conflict, because the civil war in the 1990’s caused such chaos. Georgia is a small country (4.4m population) and it will be hard for the government to pursue an overtly pro-Russian policy, as most of the population view their belligerent Northern neighbour as a threat and closer European integration as the future.
Gooch and Housego Profit Warning
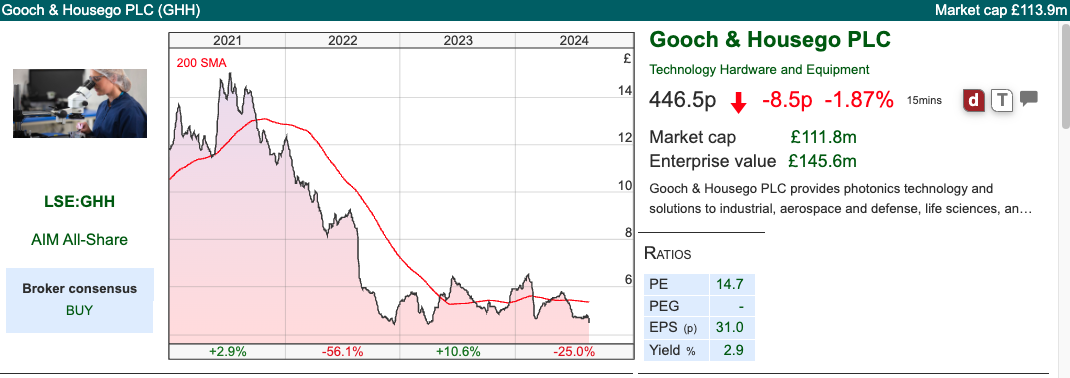
This Somerset headquartered photonics business announced a profit warning, with FY Sept 2024F adj PBT expected to be £1.5m (16%) lower and warning about an H2 weighting. That suggests we could see further downside, with another trading update scheduled for 8th October. Management blame destocking, by medical and industrial customers. Both of these were declining at H1 Mar 2024 results, while Aerospace & Defence was growing strong, up +36%. However, the Industrial and Life Sciences still represent ¾ of Group revenue.
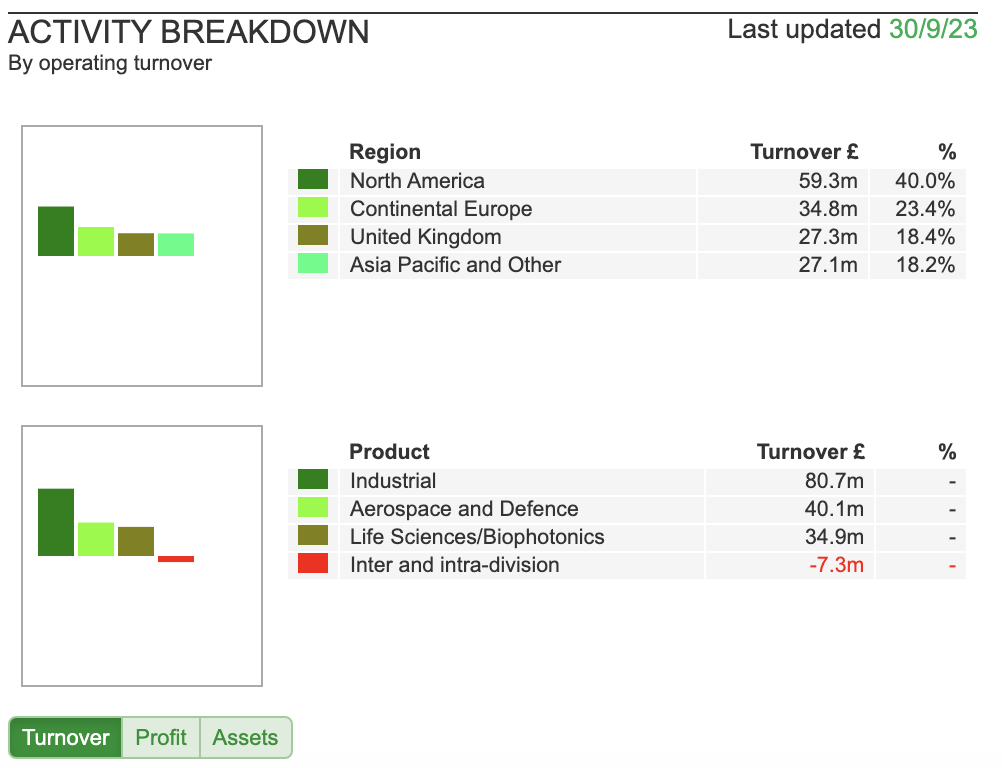
 Aside from the diversification by industry type, there’s also a wide geographical diversification with just 18% of turnover coming from the UK (v North America 40%, Europe 23%) at the previous FY.
Looking at previous RNSs suggests that the communication style tends to be over-optimistic. There seems to be a consistent theme of management suggesting near-term challenges like a competitive labour market and supply chain disruption will be resolved while the medium-term is encouraging. Yet the share price has fallen -66% from a peak of over £14 per share in September 2021.
Valuation: The shares are trading on a PER of 18x FY Sept 2024F (following a -16% cut to forecasts). Last week’s RNS says that FY Sept 2025F expectations are unchanged (Sharepad shows 39.5p) which implies a very strong +50% rebound – so a PER of 11.5x next year if you believe the forecasts. Then +20% growth to 48p FY Sept 2026F. Management have kept their medium-term target to increase return on sales to mid-teens levels, versus 6% EBIT at the H1 March stage.
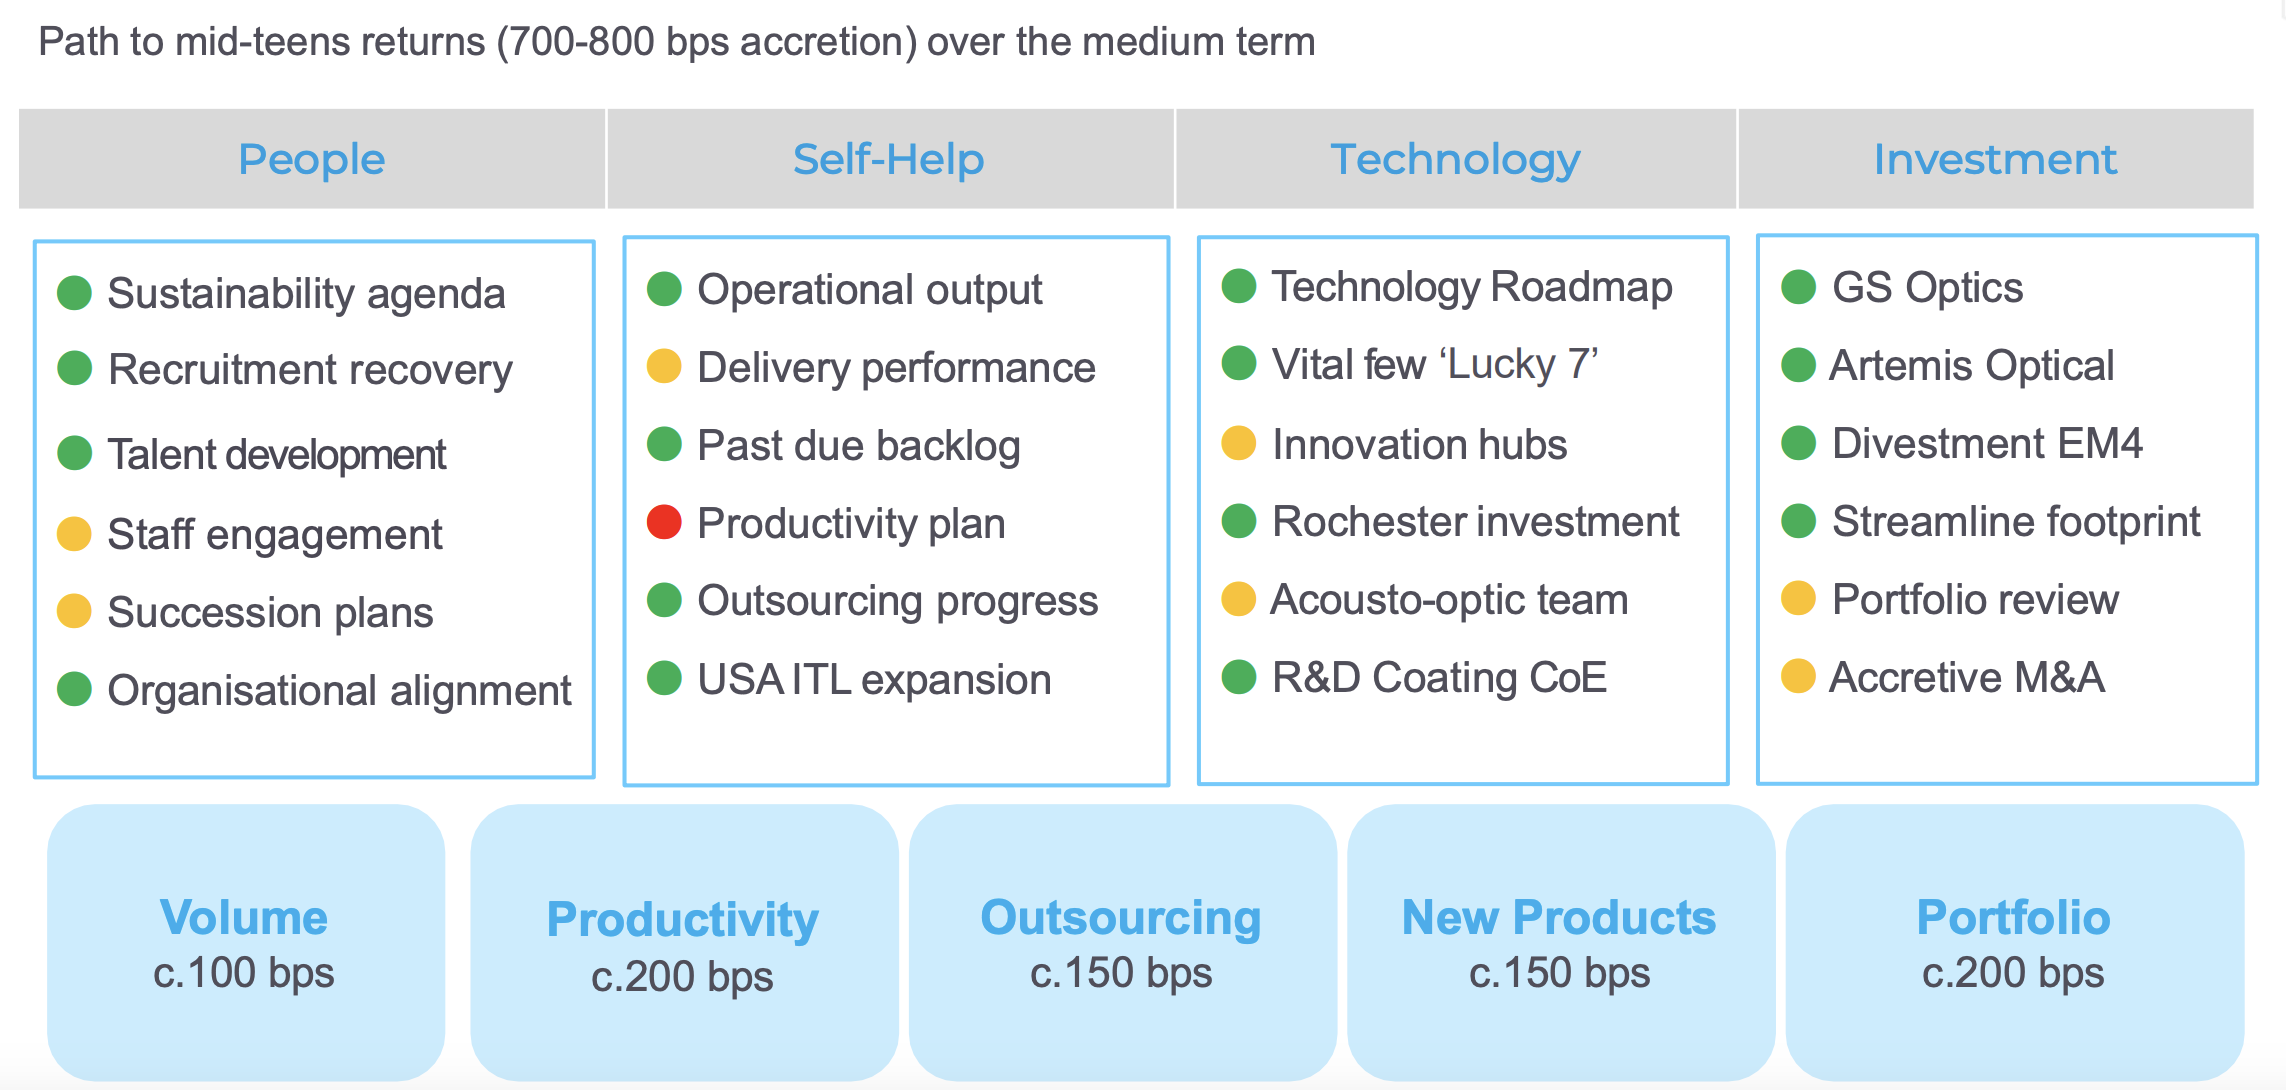
When I last wrote about the shares, in June last year, EPS forecasts were 38p (Sept 2024F) and 40p (Sept 2025p). The -33% reduction in FY Sept 2024F implies management have a track record of asking their broker to reduce forecasts for the current year but remaining optimistic about the future. The Chief Executive, Charlie Peppiatt, has been in the role since Sept 2022, I can imagine he inherited a mess, but by 2025 really needs to be delivering the forecast EPS.
Sharepad’s quality indicators are on the low side.

Opinion: It’s not clear to me if the disappointment has come from anything more fundamental than supply chain disruption, then de-stocking. The RNS does contain an intriguing quote: “we are also mindful of growing low-cost competition for the Group’s components.”
Interestingly, the shares were only down -4% on the morning of the RNS, which suggests either i) investors were already sceptical of this year’s EPS forecasts ii) investors are looking through this year’s disappointment and believe EPS of 39.5p Sept 2025F can still be achieved. I bought a starter position in Oct 2023, but had an inkling that I was too early and didn’t increase my position size. I’ll wait a few more months and decide whether to buy more or cut my losses.
Notes
Bruce owns shares in BUR, CGEO and GHH
Bruce Packard
brucepackard.com
Got some thoughts on this week’s commentary from Bruce? Share these in the SharePad “Weekly Market Commentary” chat. Login to SharePad – click on the chat icon in the top right – select or search for “Weekly Market Commentary” chat.

This article is for educational purposes only. It is not a recommendation to buy or sell shares or other investments. Do your own research before buying or selling any investment or seek professional financial advice.

Bi-Weekly Market Commentary | 20/08/2024 | BUR, CGEO, GHH | Headed for the ‘Cisco Bay?
A look at Nvidia, which is forecast to grow sales by 11x since 2020, compared to Cisco Systems valuation in the previous technology bubble. Companies covered BUR, CGEO and GHH.
The FTSE 100 rose +1% to 8,294 last week. The Nasdaq 100 has recovered strongly from its wobble earlier in August, and was up +5.4% in the last 5 trading days, with NVIDIA up +19% (market cap $3.1 trillion). The Nikkei 225 was also up strongly +9.3%, while even the FTSE China 50 was up more than +3%, so sentiment has improved across the globe. Brent Crude fell -4.4% to $78 per barrel, meaning energy costs look to be under control. Even the Ukraine war seems to have taken a turn for the better, with the invasion of Kursk appearing to have been well-planned and well-executed.
There are many ways to benefit from Sharepad’s multitudes of data, features, charts etc but one of my favourite use cases is for cross-checking articles that I have read. I came across this analysis comparing Nvidia now to Cisco in the late 1990’s when the latter had a market cap of $555bn and was briefly the most valuable company in the world. Cisco hit a peak in March 2000, trading on over 200x PER and 27x sales, but then fell around 90% and reported a loss FY Jul 2021. For comparison, Nvidia is trading on a more reasonable PER of c. 30x Jan 2026F and 16x sales but has a market cap over $3 trillion, third behind AAPL ($3.4tr) and MSFT ($3.1tr).
That sparked my interest, not so much in what the Cisco share price had performed over the following decades (badly), but how much Turnover and PBT CSCO delivered. Using Sharepad’s financial charts to graph fundamental data, it’s possible to see how things turned out.
In short, what Cisco has delivered turnover and profit growth, with an EBIT margin of around 30% and high single-digit then improving to mid-teens RoCE. That doesn’t look too bad. The problem was that the business was trading on an extremely high multiple of peak profitability, and the supernormal growth and profits of the 1990s could not be extrapolated into the future.
Cisco is currently trading at $45 per share (market cap $200bn), down from $80 per share, which it achieved at its peak 2.5 decades ago. One feature of Sharepad is that it is possible to switch the financial charts from just one “Instrument” looking at one company, to “List” (circled in red) which allows users to compare the same datapoint (in this case turnover) from two or more companies.
History suggests that investors will extrapolate NVDA’s growth and profits into the future, and at some point, those forecasts will be too optimistic. That’s not to say NVDA is a bad company, or won’t deliver decades of growth, but the growth rate of increasing revenue by 11x between Jan 2020 and Jan 2025F is not sustainable over the long term. It is the change in the growth rate and profitability that is likely to lead to disappointment for investors.
This week I look at litigation finance company Burford and Georgia Capital, two companies which the stockmarket finds hard to value. Then I finish with Gooch & Housego’s profit warning.
Burford H1 Jun Results
This dual-listed litigation finance group, that has won a $16bn claim against the Argentinian government, updated the market with H1 Jun results. The basis of preparation with fair value accounting and consolidated third-party funds, plus the inherently uncertain timing of legal matters, means that this is not an easy company to value. Nevertheless, I do enjoy trying to make sense of what is going on.
Revenues were down -61% to $198m for H1 Jun 2024, and net income was down -90% to $23.4m. However, that was driven by a favourable $182m prior year write-up of YPF (the Argentinian court case) asset in Q1 last year. They give an “underlying” figure on page 8 of the analyst slide pack, which still shows a -31% decline in H1 (realised and unrealised gains but ex the $182m YPF write -up). “Burford only” (which excludes the third party funds) Q2 this year v Q2 last year showed revenues trebling to $137m and Q2 net income of $54m v $21m loss in Q2 last year. So, on that basis, Q2 does look like a good quarter.
H1 cash realisations were $245m (down -1% v H1 last year), of which $107m was in Q2 (-28% v Q2 last year). Management point to “realisations” which is the total gain when a dispute is resolved, and excludes previously recognised fair value adjustment. This figure was up +16% to $155m v Q2 last year with a ROIC of 179%. The H1 figure of $216m realisations is the highest since H1 2020, as the pandemic backlog continues to clear.
There’s no explanation why the cash figure is down but the other realisation figure is up, but presumably it is a timing difference between a favourable realisation and Burford receiving the cash. Management say that quarterly cash receipts have been around $100m in each of the last 8 quarters.
Court case against Argentina: In September last year the shares rose c. +30% in a day to 1340p, after a NY court said that Argentina owed $16bn in damages for expropriating an oil company YPF, of which the face value of Burford’s share of the claim could be worth $6.3bn or c £23 ($29) per share. Unsurprisingly the Argentinian Govt are appealing this judgement, and the appeals process could take another year or two. During this time Burford is allowed to enforce the original judgement, by going after Argentinian assets. This FT article suggests though that the process is not straightforward though, because Argentina says there are no substantial assets within the US jurisdiction. In response, Burford seem to be going after state-owned companies and even the Banco Central de la República Argentina (BCRA). Perhaps not coincidentally, economy-minister Luis Caputo said the central bank had sent some of its gold (Argentina has just under $5bn of gold reserves) to an undisclosed location abroad.
Valuation: Burford’s tangible book value is 778p per share. However, it’s worth noting that “tangible” in this case does include $1.8bn (or 650p per share) of unrealised fair value accounting gains – of which the YPF claim against Argentina is $1.4bn (just under 500p per share), with $500m (180p) of unrealised other fair value gains. So if you want to exclude Argentina, then the shares are trading on 3.6x tangible book value, or 10x book value excluding FV write-ups completely.
Unlike banks which also have balance sheets stuffed full of fair value accounting assets, Burford has at least managed to grow tangible book value to $2.2bn, up around 5x since 2016.
Alternatively, the business has generated c. $400m of cash for the last couple of years, less somewhere between $271m (FY 2023) and $134m (H1 2024 annualised) of operating expenses. Assuming a tax rate of 20%, and converting to pence, would give an EPS of between 37p to 76p – that’s just a very rough calculation because Burford don’t give enough disclosure to calculate cash returns.
Opinion: I own this, having bought in a couple of times at below £5 and I think it’s fun to follow. The market struggles to value the shares (previous peak £20 in Aug 2018, pandemic low in Mar 2020 £3.30 per share). The assets are of uncertain value and timing, but they’re being financed with debt (bonds) which does create refinancing risk. Currently, net debt stands at 0.8x tangible equity (versus 1.5x to 2.0x US bond covenants), so the business no longer looks distressed and there could be an upside, in my view. I think now the business has reached maturity, management would benefit from providing figures that make it possible to do a CashRoCI calculation, as investors are rightly suspicious of fair value accounting.
Georgia Capital H1 Jun Results
This Tbilisi-based spin-off from Bank of Georgia announced mixed H1 results, with NAV per share falling to 78.55 GEL (GBP £22.10 a -9% decline in GBP versus Dec 2023 and -16% decline versus Mar 2023). For contrast the share price has fallen almost -30% from the end of March. The shares now trade at a discount of less than half book value.
Some of that weakness has been caused by Georgian Lari depreciation, due to political protests against the ruling Georgian Dream party, but also a rising discount rate used to value the portfolio of businesses. The Central Bank has actually cut interest rates from 11% to 8% this year and last, but following protests about the Georgian Govt’s “Russia Law”, aimed at foreign-financed NGOs, the sovereign bond spread blew out 150bp (now recovering c. 75bp) so the discount rate used to calculate the firm’s cost of equity increased.
It’s also worth remembering that CGEO owns a stake in BGEO, that is worth around £9 of CGEO’s £22 NAV, down from over £11 at the end of March. So there’s a double exposure to country risk, but if you think Georgia has a future as an independent country, then to me that counts as a positive.
Operationally, performance looks encouraging. Revenue growth for the unlisted businesses is +7%, with an improving margin so EBITDA growth is mid-teens. Within that, the two largest businesses (Pharmacies and Hospitals) are up less than 5%. However, other businesses such as Insurance are showing good growth, particularly Medical Insurance +70% as well as the smaller “Investment Stage” companies like Renewable Energy +34% and Education +29% are doing well.
The original intention of CGEO management was to invest and grow businesses in Georgia. However, the shares are trading at such a large discount, and most of the businesses are now FCF positive, so that management have earmarked $110m (c. 19% of the market cap) for share buybacks and dividends through to the end of 2026.
Valuation: I’ve updated my valuation table, showing the NAV in Georgian Lari, then converted to GBP and divided by the shares outstanding.
Opinion: The Georgian elections are in October, which seems an obvious catalyst. If the Georgian Dream party manage to hold on to power, there are likely to be accusations of vote rigging and possibly also street protests. That said, I don’t think there’s much appetite for internal conflict, because the civil war in the 1990’s caused such chaos. Georgia is a small country (4.4m population) and it will be hard for the government to pursue an overtly pro-Russian policy, as most of the population view their belligerent Northern neighbour as a threat and closer European integration as the future.
Gooch and Housego Profit Warning
This Somerset headquartered photonics business announced a profit warning, with FY Sept 2024F adj PBT expected to be £1.5m (16%) lower and warning about an H2 weighting. That suggests we could see further downside, with another trading update scheduled for 8th October. Management blame destocking, by medical and industrial customers. Both of these were declining at H1 Mar 2024 results, while Aerospace & Defence was growing strong, up +36%. However, the Industrial and Life Sciences still represent ¾ of Group revenue.
Looking at previous RNSs suggests that the communication style tends to be over-optimistic. There seems to be a consistent theme of management suggesting near-term challenges like a competitive labour market and supply chain disruption will be resolved while the medium-term is encouraging. Yet the share price has fallen -66% from a peak of over £14 per share in September 2021.
Valuation: The shares are trading on a PER of 18x FY Sept 2024F (following a -16% cut to forecasts). Last week’s RNS says that FY Sept 2025F expectations are unchanged (Sharepad shows 39.5p) which implies a very strong +50% rebound – so a PER of 11.5x next year if you believe the forecasts. Then +20% growth to 48p FY Sept 2026F. Management have kept their medium-term target to increase return on sales to mid-teens levels, versus 6% EBIT at the H1 March stage.
When I last wrote about the shares, in June last year, EPS forecasts were 38p (Sept 2024F) and 40p (Sept 2025p). The -33% reduction in FY Sept 2024F implies management have a track record of asking their broker to reduce forecasts for the current year but remaining optimistic about the future. The Chief Executive, Charlie Peppiatt, has been in the role since Sept 2022, I can imagine he inherited a mess, but by 2025 really needs to be delivering the forecast EPS.
Sharepad’s quality indicators are on the low side.
Opinion: It’s not clear to me if the disappointment has come from anything more fundamental than supply chain disruption, then de-stocking. The RNS does contain an intriguing quote: “we are also mindful of growing low-cost competition for the Group’s components.”
Interestingly, the shares were only down -4% on the morning of the RNS, which suggests either i) investors were already sceptical of this year’s EPS forecasts ii) investors are looking through this year’s disappointment and believe EPS of 39.5p Sept 2025F can still be achieved. I bought a starter position in Oct 2023, but had an inkling that I was too early and didn’t increase my position size. I’ll wait a few more months and decide whether to buy more or cut my losses.
Notes
Bruce owns shares in BUR, CGEO and GHH
Bruce Packard
brucepackard.com
Got some thoughts on this week’s commentary from Bruce? Share these in the SharePad “Weekly Market Commentary” chat. Login to SharePad – click on the chat icon in the top right – select or search for “Weekly Market Commentary” chat.
This article is for educational purposes only. It is not a recommendation to buy or sell shares or other investments. Do your own research before buying or selling any investment or seek professional financial advice.