
A look at the bank sector, that has been disappointing for decades but has now begun to outperform the wider market. Companies covered BARC, CBG, LLOY, MTRO, HSBA, STAN

Lloyds kicks off the H1 Jun reporting season for UK banks on the 25th of July, closely followed by NatWest, Standard Chartered, HSBC and Barclays. Most people in the country hold a current account with one of the four main clearing banks. These banks have a high street presence, sponsor sporting events, advertise on TV and generally feel very familiar.
However, that familiarity has proved costly to equity investors in banks’ shares; performance has consistently disappointed investors who thought they understood how banks make profits. Using Sharepad’s multigraph feature we can see that the FTSE Banks index (black) performed in line with the wider All Share (red) from the late 1990s to the financial crisis, but sold off dramatically between 2007 and 2009 and never really recovered. The sector is down -60% versus a positive +40% performance from the wider index over the last 25 years.
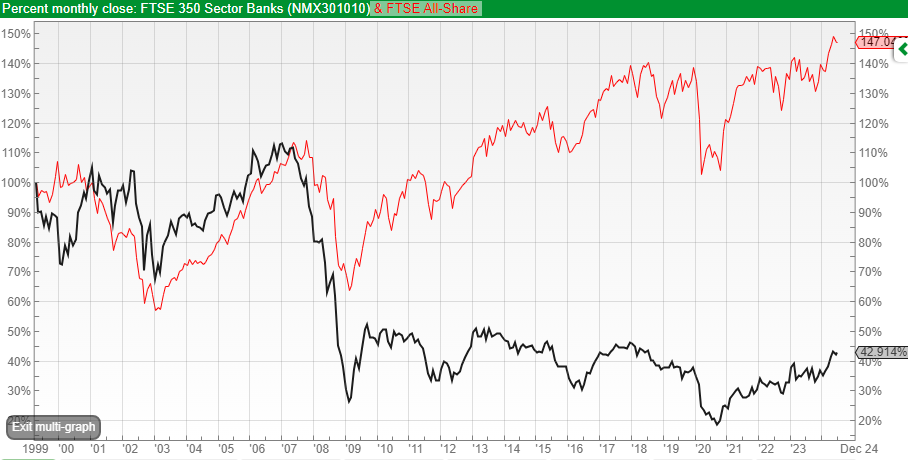
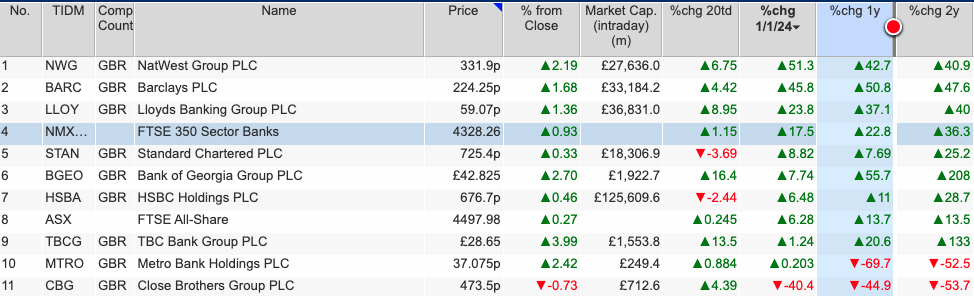
Even in the last decade, when the financial crisis was just a painful memory, banks have still underperformed. Things though are beginning to look more hopeful. On both a 12M and YTD view, the sector is showing good momentum, outperforming the wider FTSE All Share Index, led by NatWest and Barclays.
We can use Sharepad to look at the long-term trends that can help explain what is going on, and why the sector could finally become investible. But first, it is worth trying to understand what has gone wrong.
What has caused the valuing destruction:
Shareholder returns have two components, growth and profitability. Looking at growth first, we can see that UK banks’ revenue growth has gone backwards since the financial crisis.
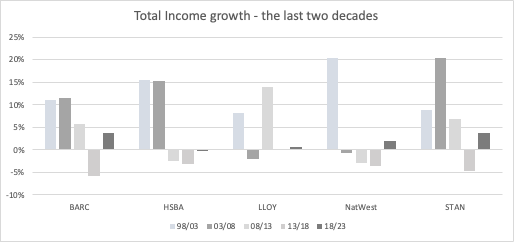
The chart shows 5-year CAGR top-line revenue growth downloaded from SharePad but split into 5 separate 5-year periods. Before the financial crisis, most banks were reporting double-digit CAGR, growing much faster than the economy as a whole. Immediately following the financial crisis banks shrank. The exception was Lloyds, due to the disastrous acquisition of HBOS (which was “rescued” by Lloyds, except that at £666bn, HBOS’s balance sheet was double the size of LLOY) and STAN which only suffered self-inflicted problems after the financial crisis.
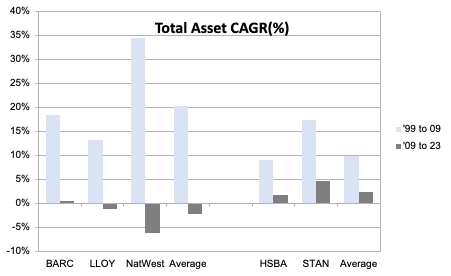
Another way of looking at this is the trend in aggregated total assets, again created by downloading Sharepad data into Excel and creating a graphic.
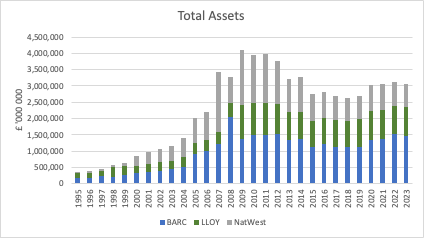
Barclays, Lloyds and NatWest grew total assets at a CAGR of +20% up to 2009, much faster than top-line revenue growth. As banks faced competition from demutualised building societies using the wholesale funding markets and securitisation (Northern Rock, HBOS) management grew assets in response to falling net interest margins. The +20% CAGR total asset growth equates to a 6x increase from £600bn a decade earlier. The remarkable thing was that no one noticed that bank balance sheets were growing so much more quickly than GDP or if anyone did notice, they thought this didn’t matter.
HSBC and Standard Chartered (the Asian banks) began reporting in dollars from the late 1990s onwards and mainly operate outside the UK, so I excluded them from the chart above. The two Asian banks grew at +10% in US dollars before the financial crisis (light blue), then falling to +2% CAGR afterwards (grey), as the chart below shows.
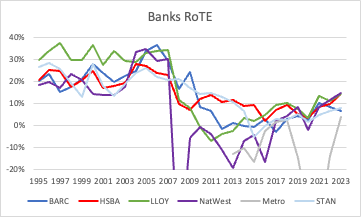
Not only growth, but profitability has also suffered. In the decade before the financial crisis, UK banks reported an average Return on Net Tangible Assets (that is shareholders’ equity less goodwill) of around 20%, but this average Return on Tangible Equity (ROTE) has fallen to 2% for the years after the financial crisis. For instance, between 2009 and 2016 NatWest failed to report a profit.
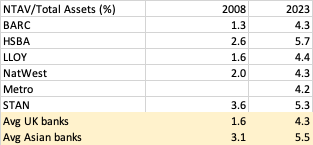
Some of the lower profitability was due to banks being slow to recognise bad debts from 2008 and pushing back losses into later years. However, most was caused by two issues on the liability side of banks’ balance sheets. The first was regulators forcing banks to fund their balance sheets with more equity (an expensive form of funding). Net Tangible Asset Values/Total Assets are now above 4%, compared to 2% or even lower in 2008. If profits stay the same, but the regulator demands 2-3x more equity funding, RoTE will inevitably fall.
The second cause of structurally lower profitability was low interest rates. Banks enjoy the benefit of customer deposits as a cheap source of funding. Even now, after interest rates have risen to 5.25% around a third of NatWest’s customer deposits (£140bn) are non-interest bearing. Other banks don’t disclose this figure but I would imagine that it’s a similar proportion. Having non-interest-bearing current accounts and similar is a huge funding advantage relative to a lender like DUKE, which pays SONIA plus 2% for its Revolving Credit Facility. However, if SONIA ever fell back below 50bp, this relative advantage disappears. So even if spreads on their lending products, like mortgages, remain competitive there is a windfall from the liability side of the balance sheet in the form of cheap funding.
Understanding the “Structural Hedge”
UK banks refer to a “structural hedge” in the analyst presentations. This is not a banking Gardeners’ World or Chelsea Flower Show metaphor, instead, management means a financial strategy that helps them smooth out their net interest income and profits over time.
As rising interest rates are generally helpful for bank net interest income, management use a structural hedge to delay recognising some of this rising interest rate benefit in order to smooth earnings. Below is a slide from a Barclays Nov 2023 presentation, explaining the concept.
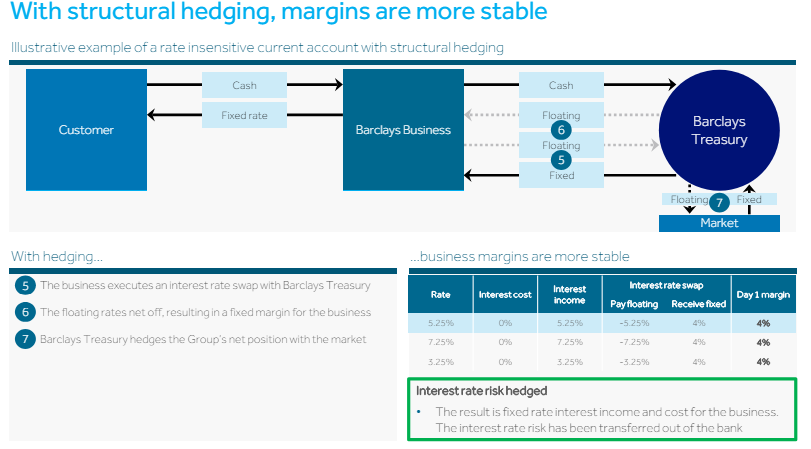
Barclays saw a £3.6bn (28% of Net Interest Income and half of forecast PBT) in gross benefit. Lloyds said they saw an £800m benefit from their structural hedge in 2023, and are guiding to between £700m-£800m again this year, with the same level of incremental revenue in 2025 and 2026. That represents 6% of net interest income and 12% of forecast FY Dec 2024 profits. HSBC has said that their structural hedge represents a tailwind but didn’t quantify the amount in the FY results presentation. NatWest have said they expect their structural hedge to grow this year and continue into FY Dec 2025F and Dec 2026F, but like HSBC, they haven’t quantified the benefit with a number in the P&L.
In summary, the structural hedge will be a tailwind for most banks for the next couple of years.
A Fall in Conduct and Litigation Costs
Following the financial crisis, banks have paid tens of billions in fines for bad behaviour. Bank management will tend to separate out these costs, and imply they are exceptional items. Often this is because it is easier for regulators to fine the corporate, rather than go after an individual, where the burden of proof is much higher. However, given the regularity with which these “exceptional” costs recur, investors in banks’ equity have started to notice that these costs are not “one-offs”. When management make a mistake, it is the shareholders who pay.
There are many examples, from Payment Protection Insurance mis-selling or Libor rigging or any of a dozen other conduct costs. The key is to remember that a core purpose of financial services is to coax people into accepting risks that they would not, if fully informed, consent to bear. Or on the lending side, persuade people to borrow money which they might not have done if the APR was not suppressed by packaging the loan with a poor value insurance product. So conduct costs and litigation could be “a feature, not a bug” of the banking system. Slide 28 of Barclays Investor Update says that over the last decade, the bank has paid out £16bn in litigation and conduct costs. The numbers will be similar for other banks.
The most recent of these scandals is unfair commission structures on car loans, which could cost the UK bank sector between £10bn and £20bn, according to analysts quoted in the press. Lloyds has recognised £450m for costs and fines at the FY results. Close Brothers has also seen its share price fall -60% from the start of the year because of this issue, before recovering.
However, the FCA’s investigation relates to behaviour before 2021, so this is a legacy issue. With banks’ consumer duty rules and obligation to treat the customer fairly, banks have now had to adapt their business models. We may see a year or two of costs related to the current FCA investigation, but the overall impact is likely to be much less than the PPI mis-selling. So a second reason to turn more positive on banks could be a fall in mis-selling, conduct and litigation costs.
The Threat from Neo-banks
New entrants, from Egg to ING Direct to Metro Bank have tended to reduce returns for the traditional banks, but without finding a successful business model. In banking, you are only as smart as the loan your dumbest competitor is making. Before the financial crisis, the threat came from de-mutualised building societies like Northern Rock and Halifax (the HBOS). Spreads on mortgages collapsed from about 200bp in the late 1990s to 20bp a decade later. They now stand at around 50bp.
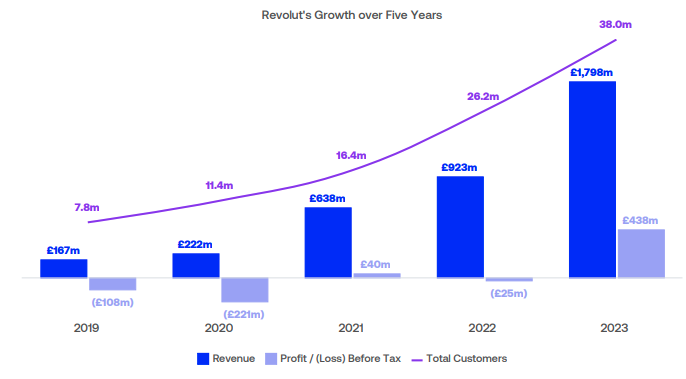
Atom Bank, Starling and Monzo are all making inroads into the UK market, but the fastest and most highly valued is Revolut (with a mooted valuation of $40bn, equating to 17x sales and 91x reported earnings). Revolut uses word-of-mouth growth through referral programs, incentivising existing users to invite friends and family, plus targets younger customers preferring to advertise on social media platforms TikTok and Instagram. The strategy seems to be working with revenues growing +95% to $1.1bn while generating PBT of $438m. Customer numbers were up +45% to 38m across the globe.
What next for UK banks?
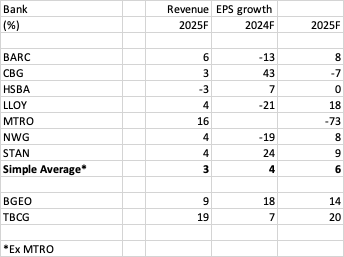
Sharepad forecast data, in the table below, shows that with the exception of HSBC, UK banks are expected to grow their top line by mid-single digits next year. That’s much less exciting than the likes of Revolut, but may turn out to be more sustainable.
I have also included the London-listed Georgian banks, BGEO and TBCG at the bottom of the table, as they do seem to be remarkably good value, albeit with political risk and a belligerent Northern neighbour.
Close Brothers (which has a July year-end) is likely most exposed to the Motor Loan Discretionary Commission FCA investigation. So far CBG management have said that they will only take a £10m hit to FY July 2024F numbers. The FCA is expected to set out their next steps by 24th September at the latest. Hence CBG has decided to provisionally reschedule FY July 2024F results to 19th September (from 24th September).
The valuation table below shows that are UK banks looking cheap on mid-single-digit PER ratios, both in absolute terms and relative to recent history (4-year average PER). Dividend yields are also around 20-30% higher than recent history.
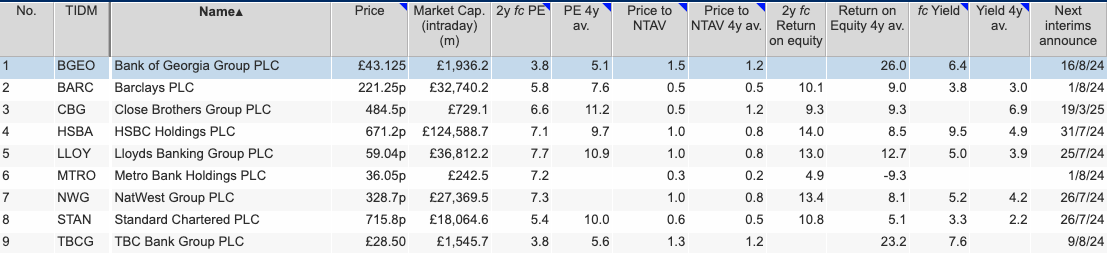
For a longer historical context, banks used to trade on around 12-15x PERs. One useful feature I find with Sharepad is the ability to compare current or forecast valuation ratios compared to the 4-year average, to see how valuations compare to recent history. For instance, Close Brothers in the chart below is currently trading on around 0.5x P/NTAV versus a 4-year average of 1.2x, as investors worry about the hit from the FCA’s investigation into motor loans.
In the more distant past, Lloyds used to trade on above 6x Net Tangible Asset Values (NTAVs) and RBS/NatWest on around 4x before the financial crisis, justified by >30% Returns on Net Tangible Book.
We will never see those high returns again, as the FCA and Bank of England have demanded that banks fund their balance sheets with a much greater equity component and is policing conduct to make sure banks are Treating their Customers Fairly. However, 2-year forecast RoEs and now above the 4-year average, which seems anomalous given that 2 forecasts PERs are below their historic 4-year average.
My thoughts are that the worst is over for UK banks, though there are probably more exciting opportunities with greater revenue growth elsewhere. Wise, trading on around 20x forecast PER and just below 5x revenue strikes me as having many of the characteristics of Revolut, but with a more realistic valuation that has been tested by public markets. I last wrote about WISE here.
Notes
The author owns shares in Bank of Georgia and Close Brothers.
Bruce Packard
Got some thoughts on this week’s commentary from Bruce? Share these in the SharePad “Weekly Market Commentary” chat. Login to SharePad – click on the chat icon in the top right – select or search for “Weekly Market Commentary” chat.

This article is for educational purposes only. It is not a recommendation to buy or sell shares or other investments. Do your own research before buying or selling any investment or seek professional financial advice.


