
In the last update, I looked at the leading markets (NASDAQ & S&P500) and what to expect after the break higher and I also talked about the AI stocks becoming frothy. Can anyone remember AI?
So, What Happened?
The leading markets melted around 5% higher over the coming weeks and then ran out of steam after a particularly frothy move fuelled by the AI media frenzy. The pullbacks that followed mutated into a market correction bringing the leading markets down to the big gun support areas. The small to mid-cap markets, especially in the UK visited 52-week lows but held the range. The main point I always bang home here is to focus on the leading markets pulling back to the major levels as leaders lead, not laggards.
A Grindy Period for Stocks.
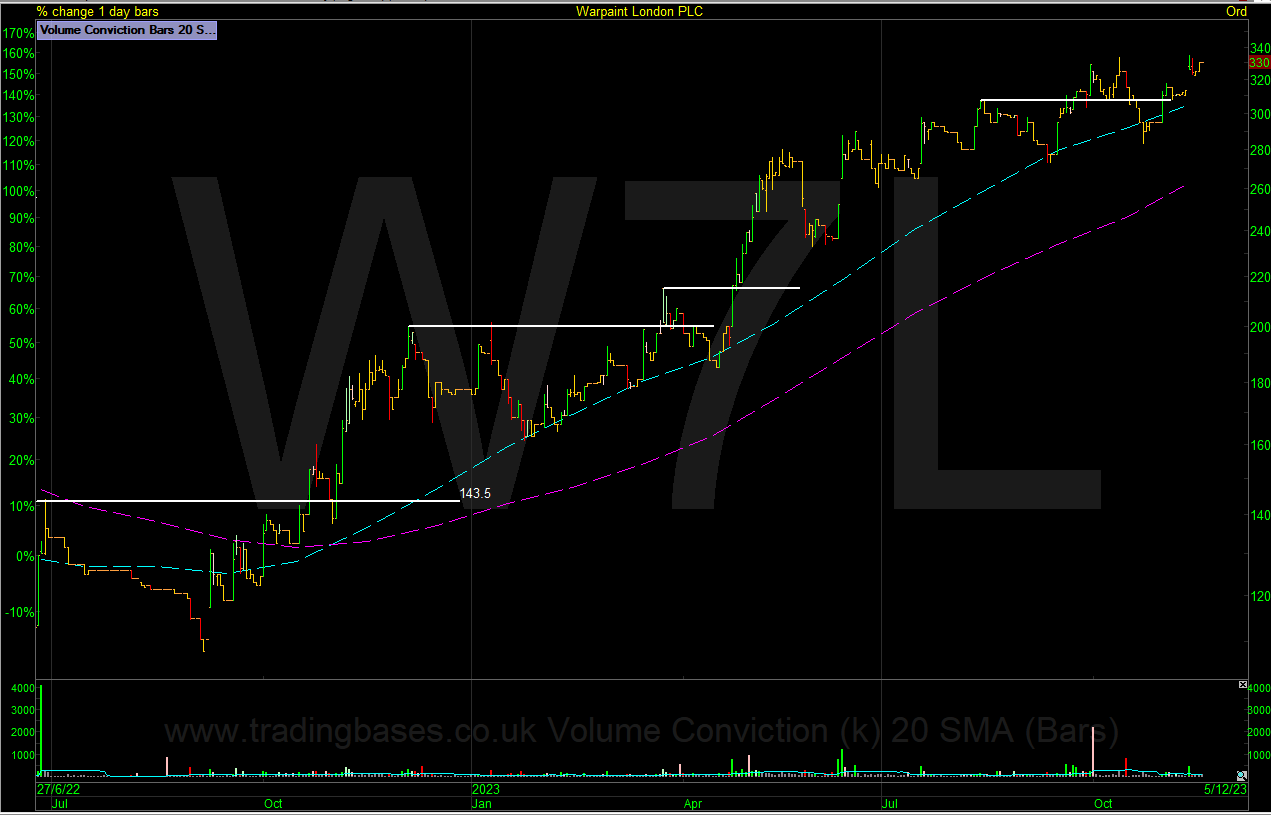
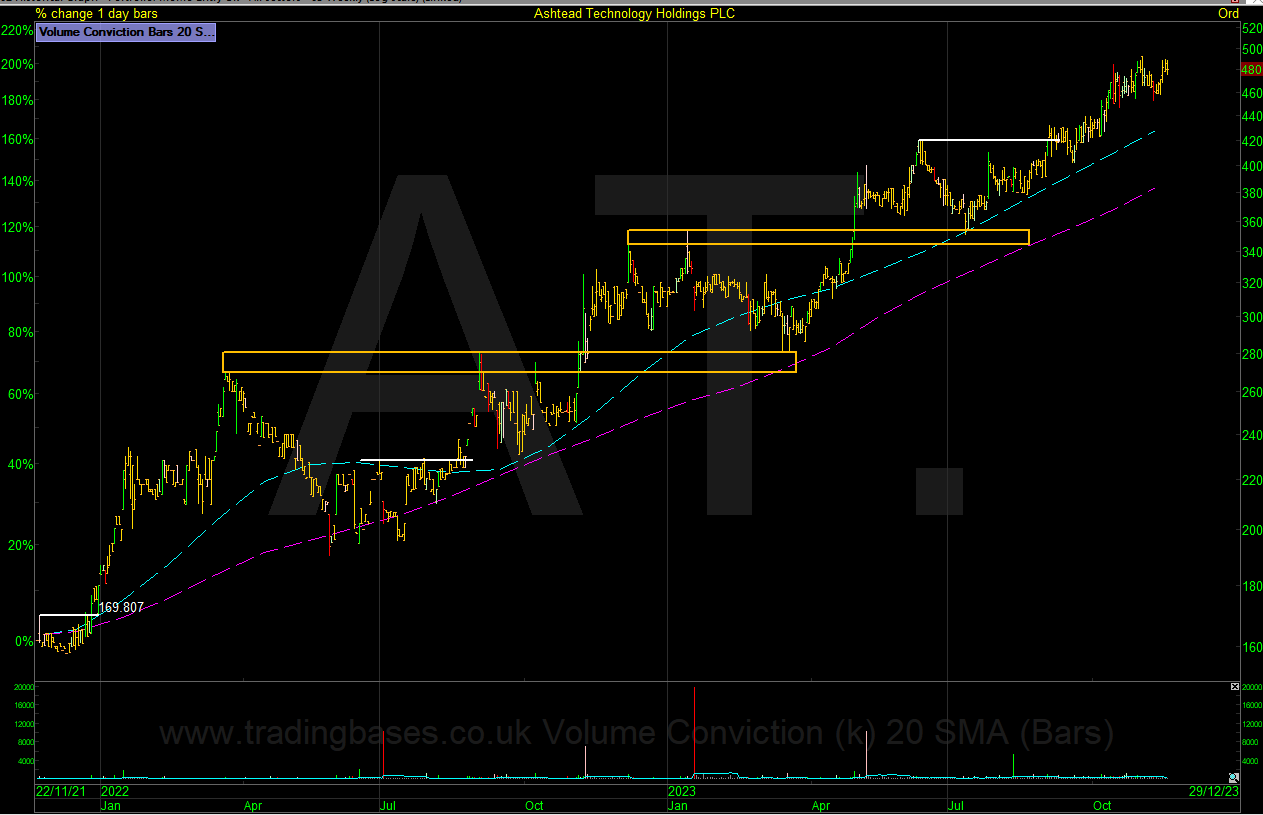
My focus in small-cap growth trends had a free health check after a stellar move higher. Some of my positions didn’t make it. Most did. Notable trends being in stocks like Warpaint London & Ashtead Technology.
Warpaint London
Ashtead Technology Holdings
Markets Reverse on High Volume.
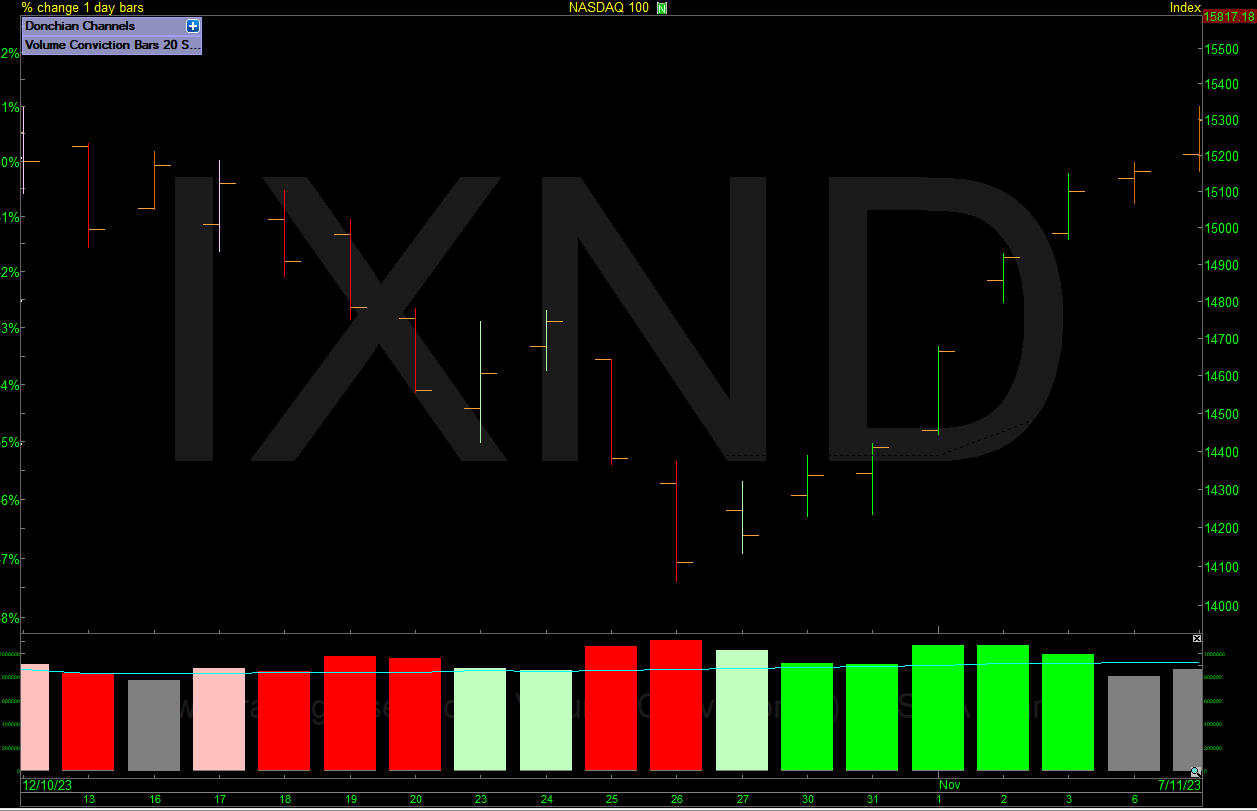
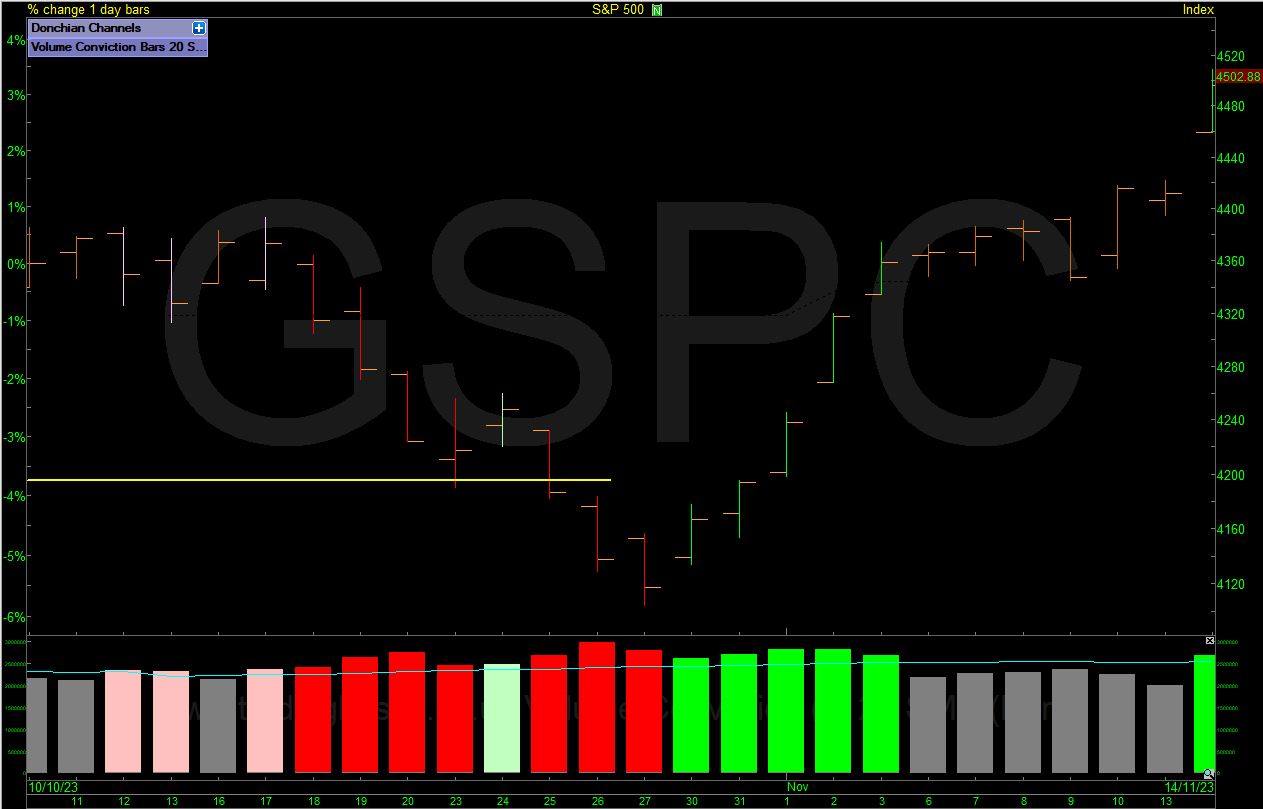
You know when the markets are so tough that you feel the need to sign into your trading accounts and watch prices move up and down on a tick-by-tick time frame. You might start to curve fit or reinvent your trading approach or flatten all trades regardless of trade management rules and sadly for many investors they might walk away from the markets altogether. That is where the market bottoms. The markets always seem to bottom on the week you get the knot inside your stomach and need to sign into your trading accounts to press some buttons. This is evident in the high-volume aggressive manner markets reverse. Study the charts below to help build resilience to these market reversal areas.
Daily NASDAQ100 High Volume Reversal
Daily S&P High Volume Reversal
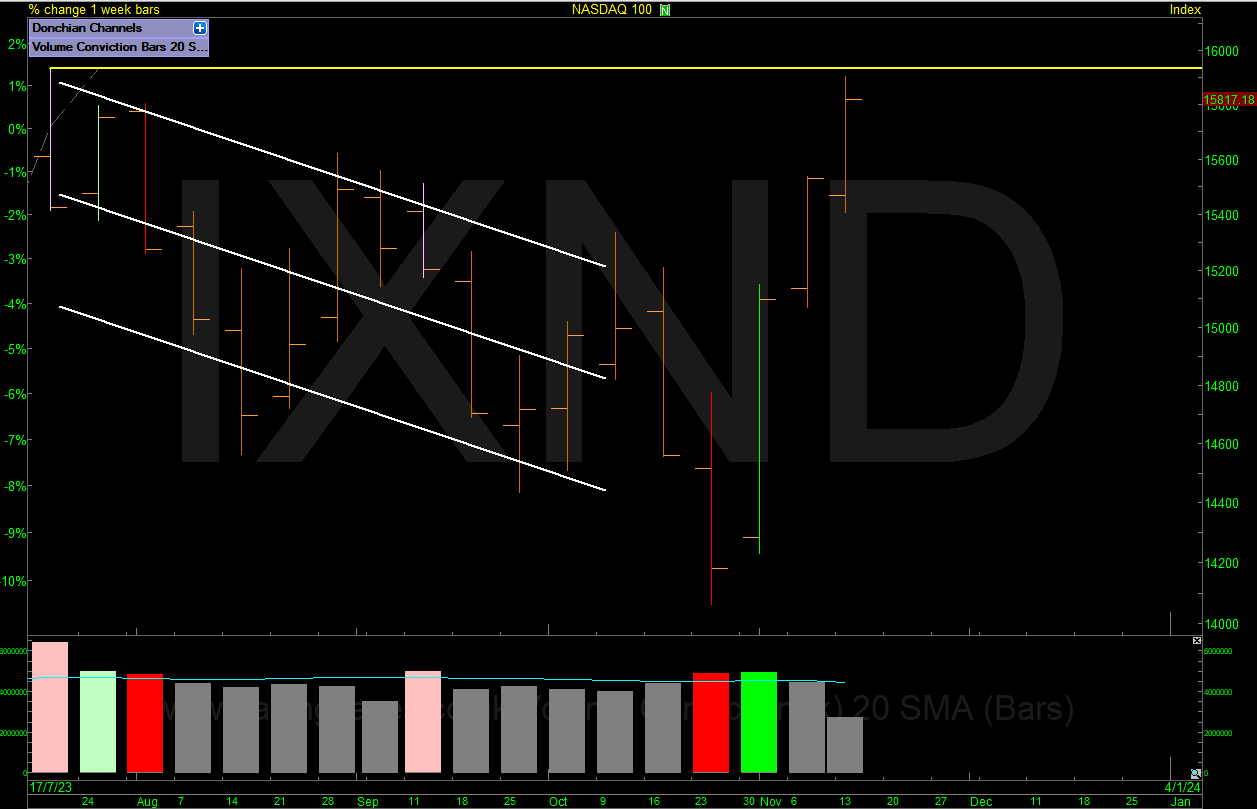
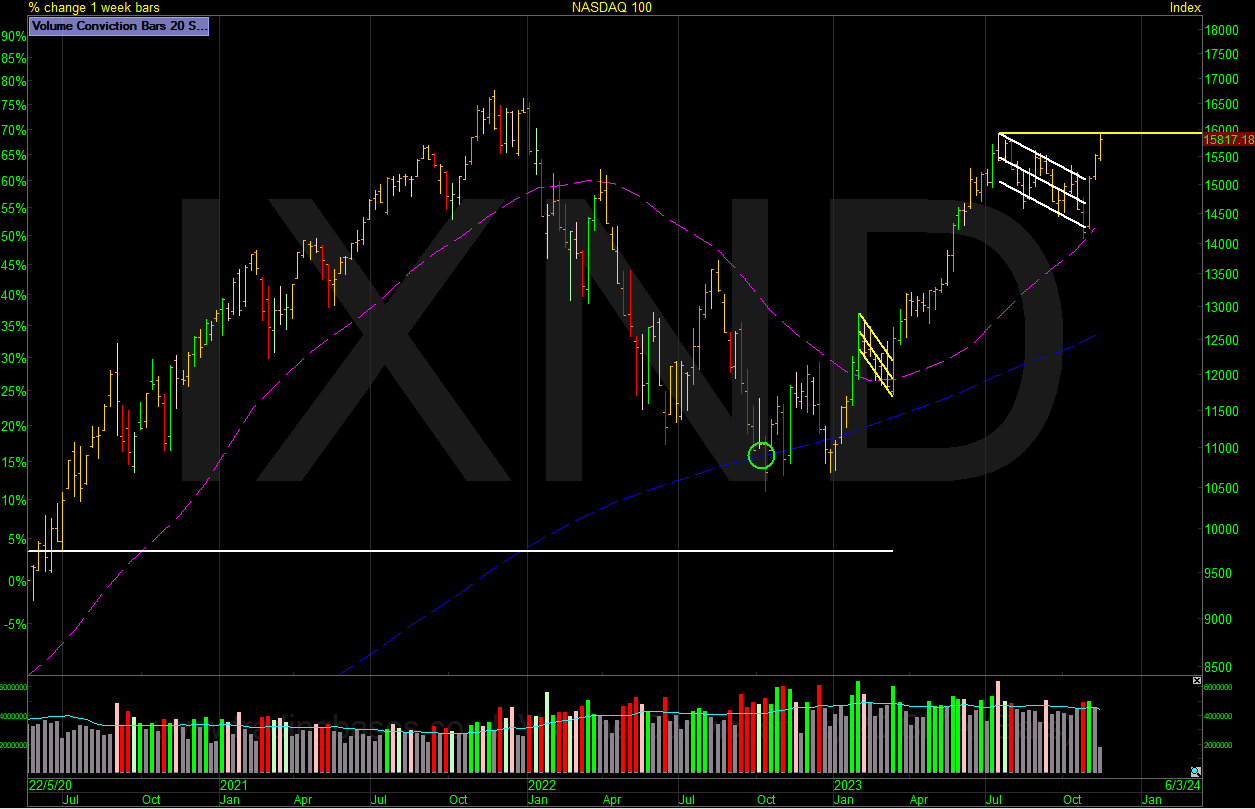
Weekly NASDAQ100 High Volume Reversal
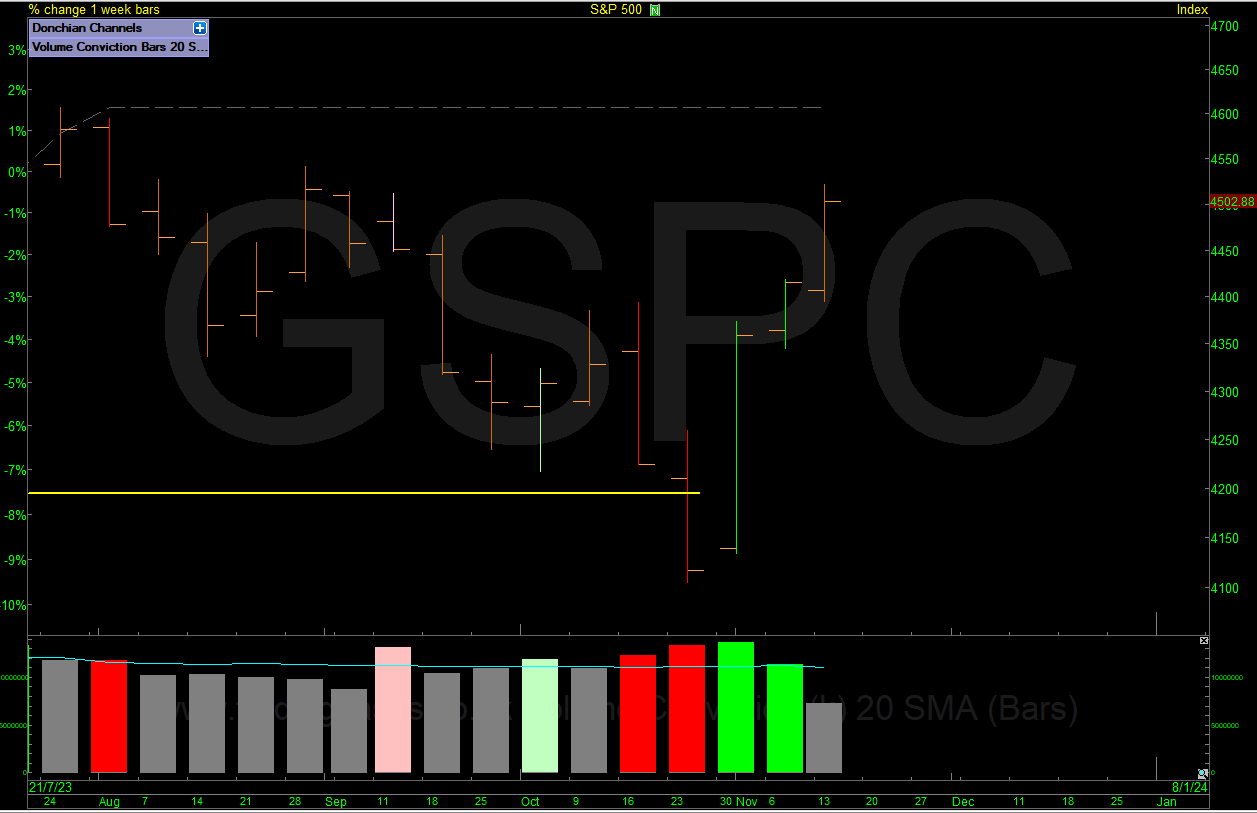
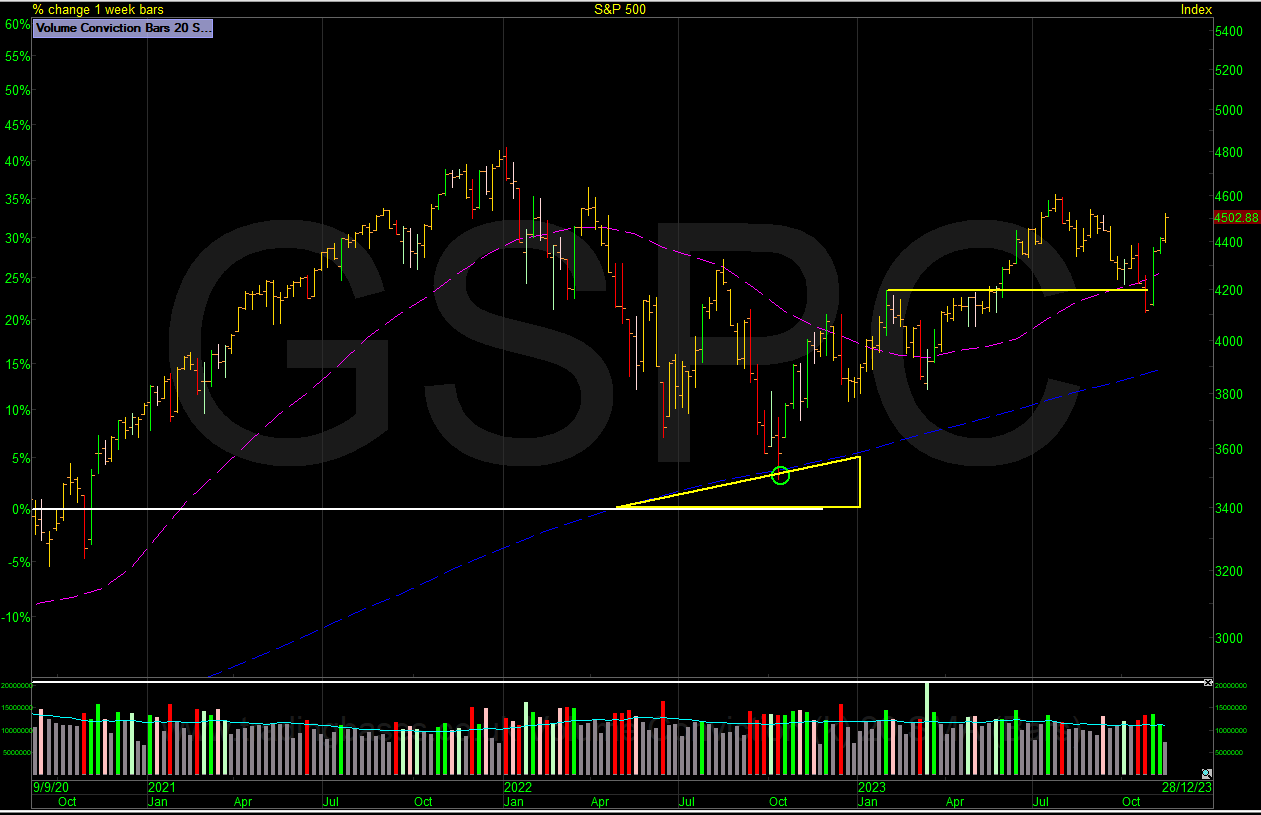
Weekly S&P500 High Volume Reversal
Visit my last article to recap on how I use volume – Using Volume to Help Make Better Informed Investment Decisions
The Market Trend
The markets as a whole are mixed with the damage done in the recent correction, but the leading markets are structurally fine. Markets correct through time or price, and we just had a correction in price. It will still take time for the long-term trend to sort itself out, especially in the UK markets.
Current 200-day (10 Month) Trends at Time Of Writing.
Transports – Falling
Dow – Rising
S&P – Rising
Nasdaq – Rising
Russell – Falling
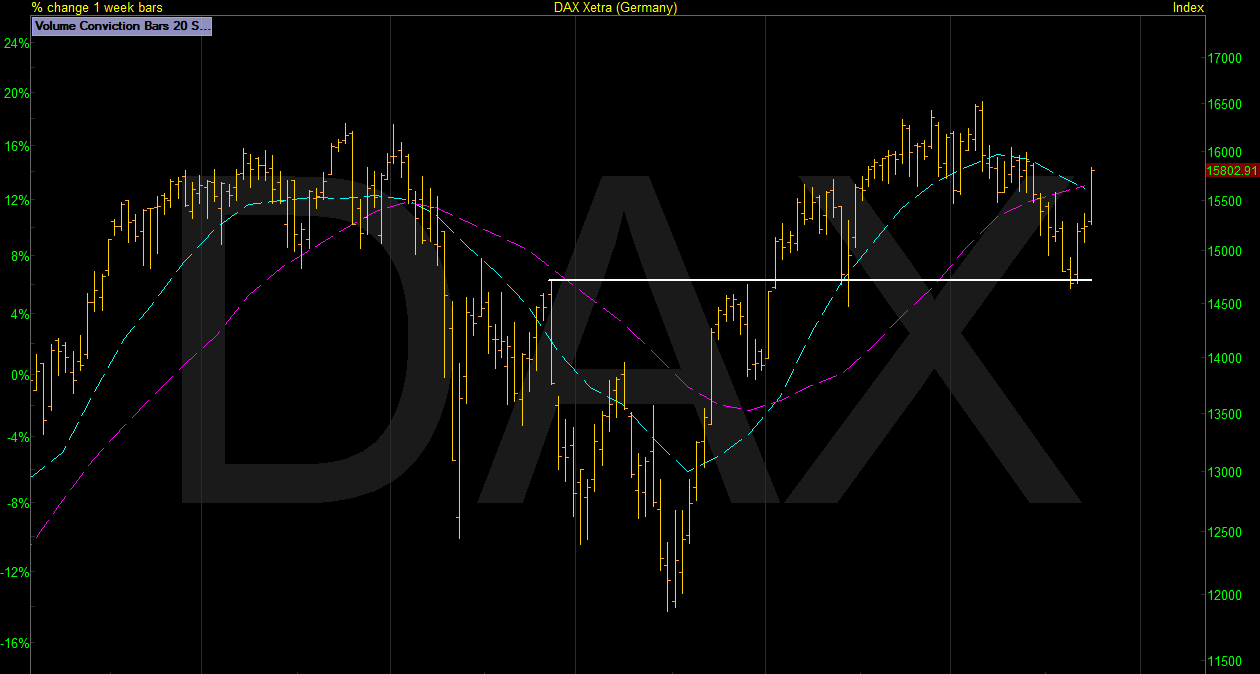
Dax – Rising
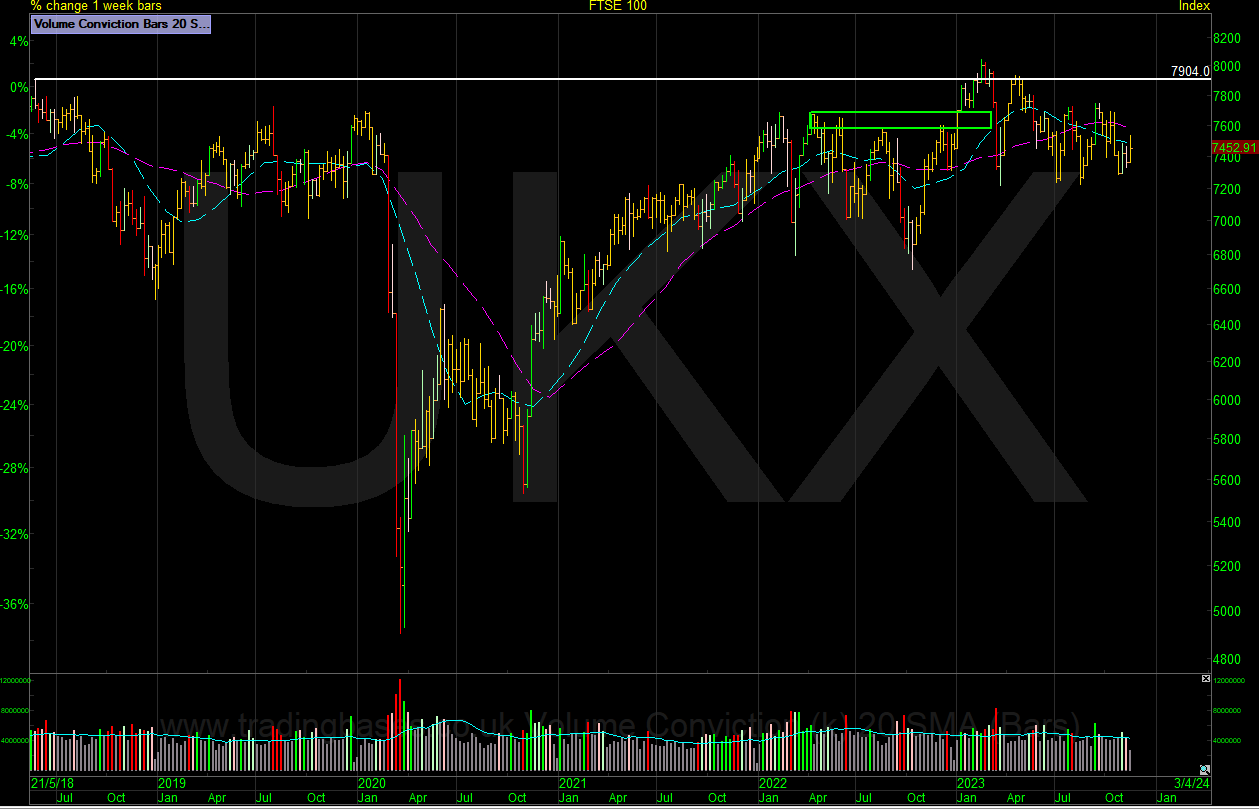
FTSE 100 – Falling
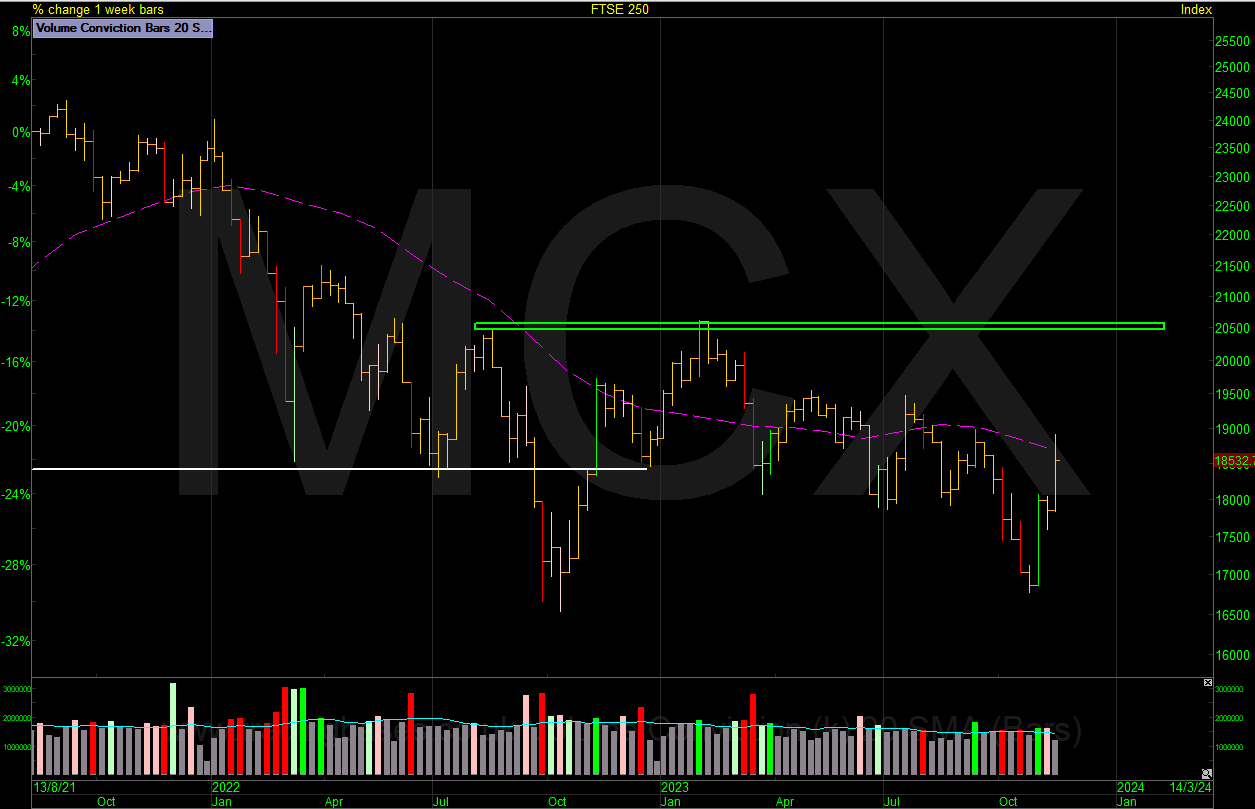
FTSE 250 – Falling
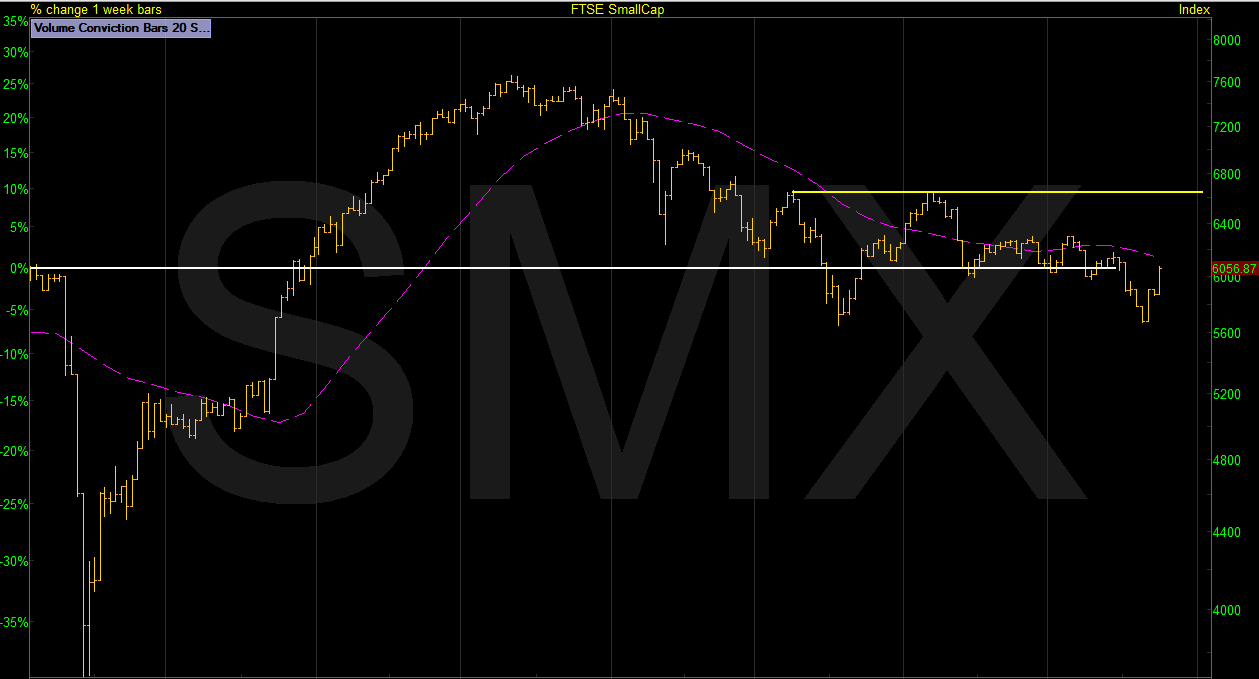
SMX – Falling
In the US the Dow, S&P and NASDAQ markets are rising along with the DAX. All UK markets are falling over the 200-day lookback period even with the strong move off the lows we’ve had. Its early days.
Big Picture Levels Recap
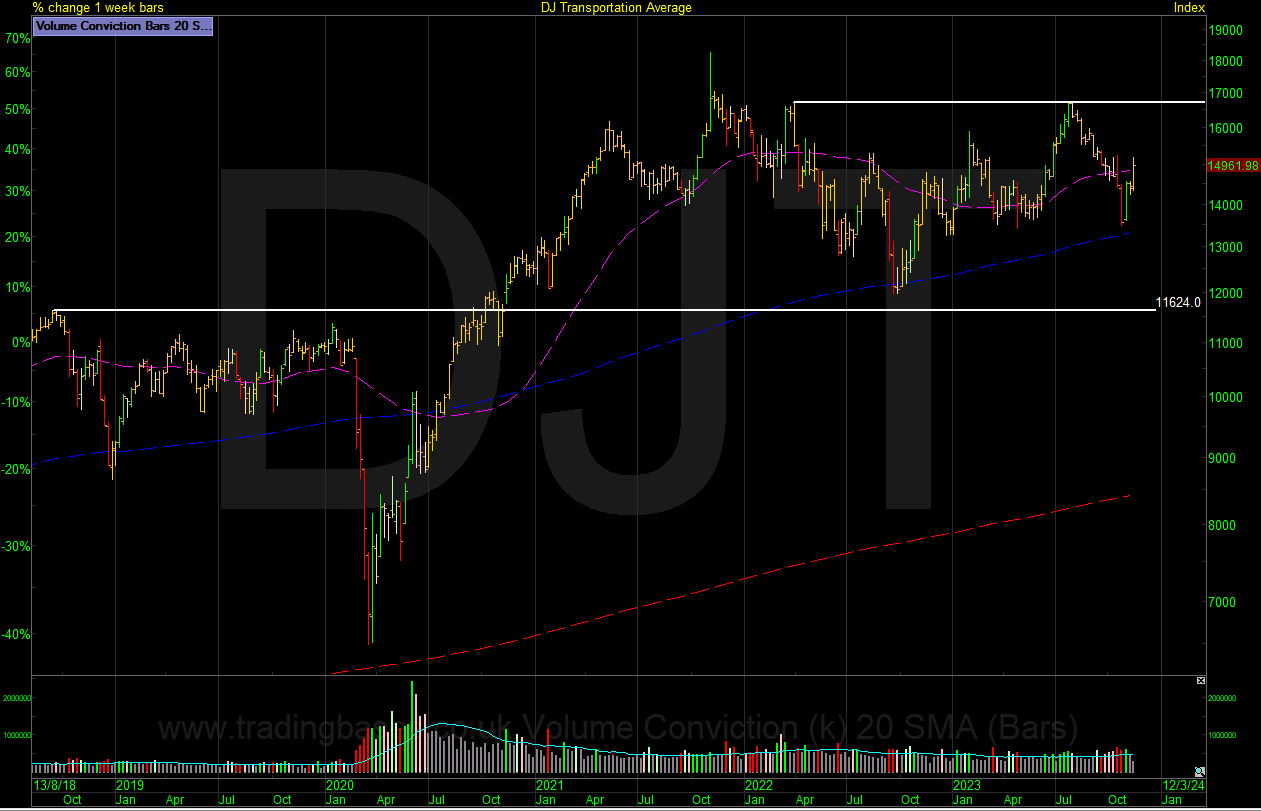
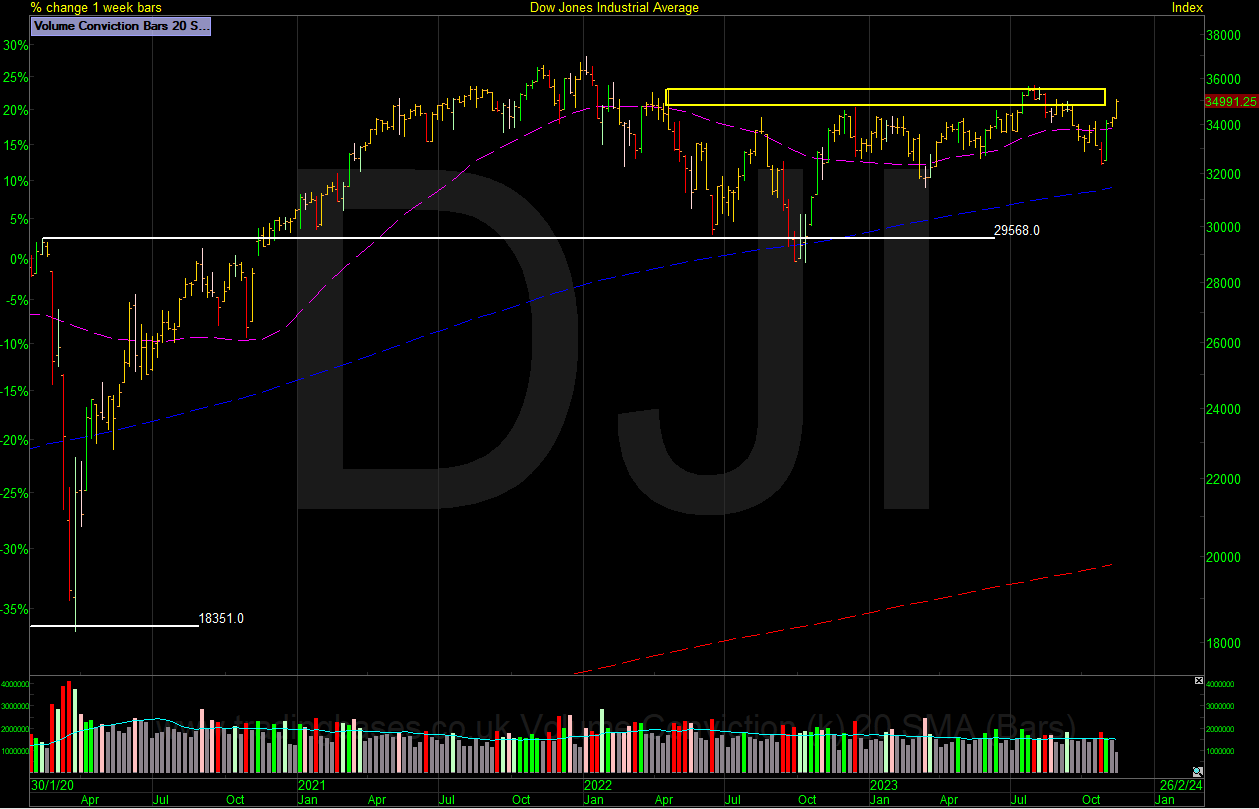
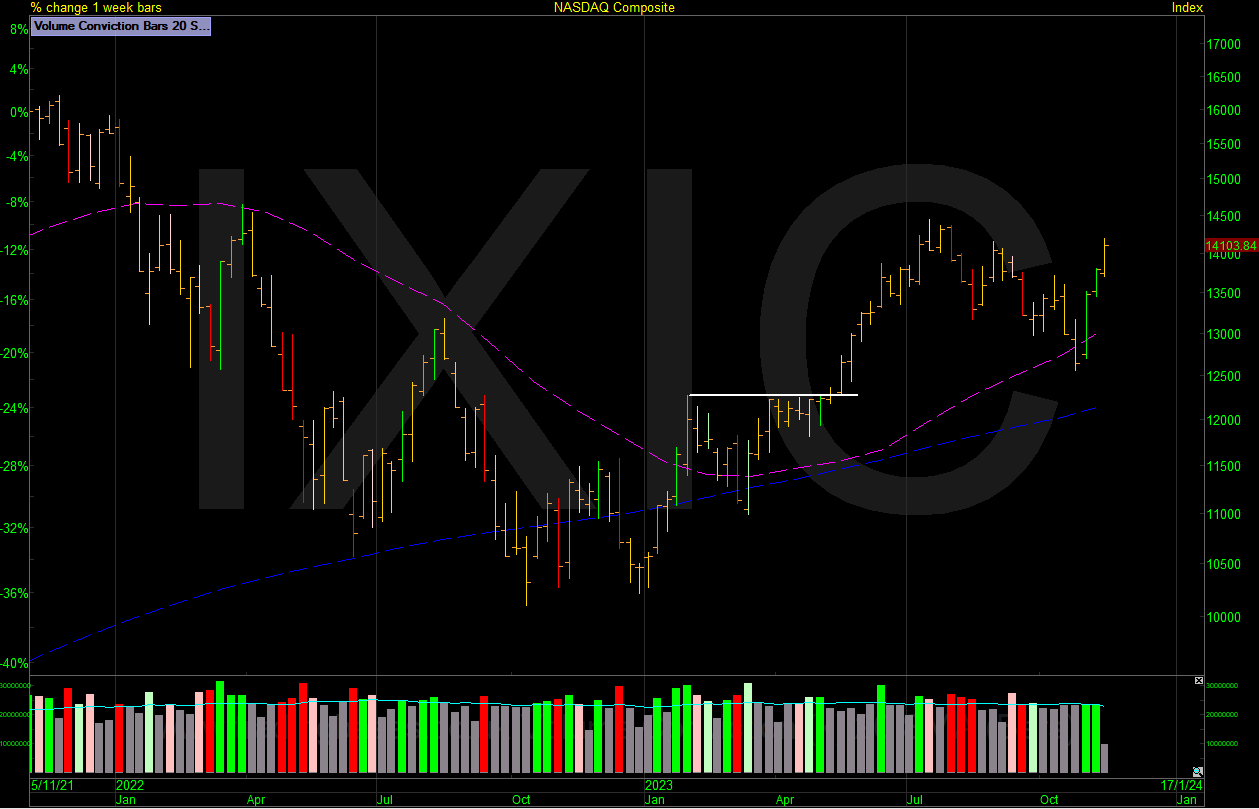
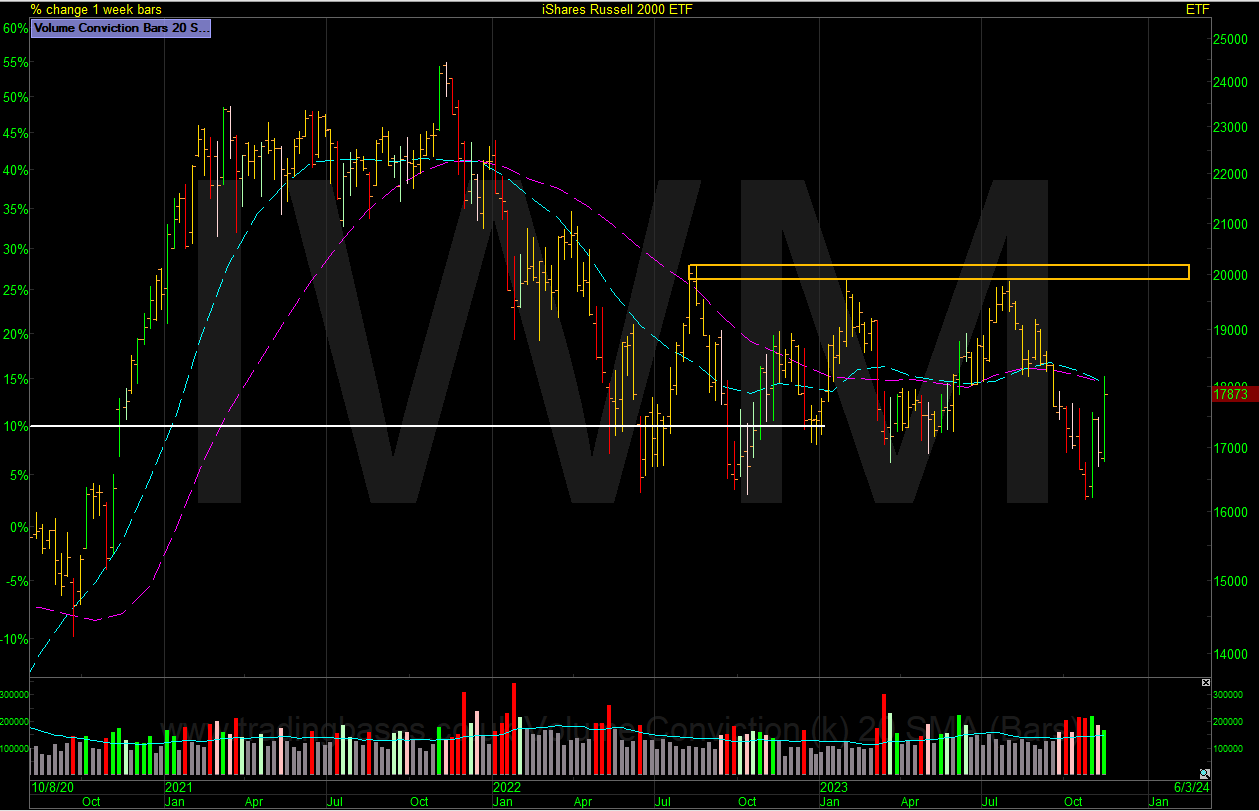
The charts below have the 10-month moving average in purple, the 50-month moving average in blue and the 200-month moving average in red. Zoom those charts out to see the forest before the trees.
DJT Transports Still trading in range, but I’ve noted a higher baseline.
DJI Dow Jones Still trading in range, but I’ve noted a higher baseline.
S&P 500 After breaking out earlier in the year we have had a pullback to the 100-day area, and this turned into a correction after a small bounce-back rally. The correction came all the way back to the prior breakout level. What was resistance becoming support?
IXND NASDAQ 100 as with the S&P the NASDAQ 100 had a normal and expected pullback that turned into a correction and in the case of the NASDAQ 100 it came into the rising 10 Month average (200d)
IXIC NASDAQ Composite as with the NASDAQ 100 corrected to the 10 Month average.
IWM RUSSELL 2000 moved back to the baseline highs before collapsing all the way back to 52-week lows and the bottom of the base.
DAX The DAX correction found support on the previous line in the sand as it did earlier in the year. What was resistance should become support.
FTSE 100 continues to trade in a range.
FTSE 250 in a large base and back into the range after a visit to 52-week lows during the correction.
FTSE Smallcaps as with the FTSE250 in a large base after a visit to 52-week lows during the correction.
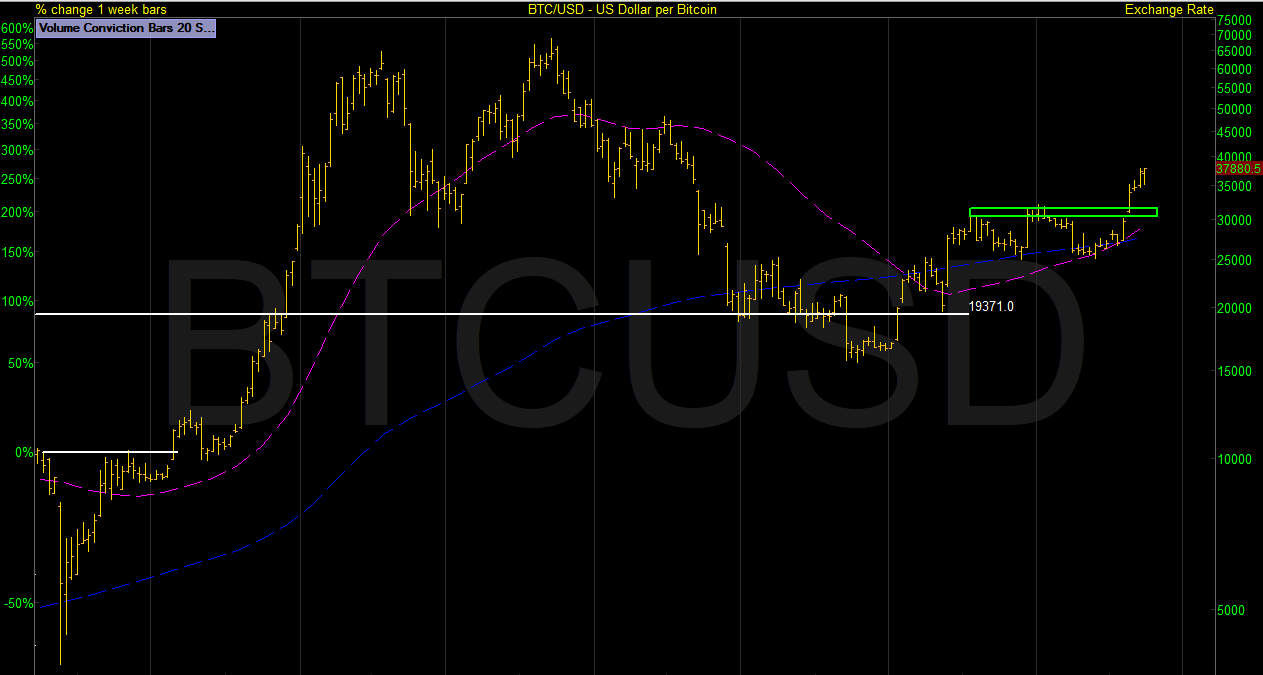
BTC/USD built the base we were looking for and has since broken out. Potential for pullbacks to be in play on the long side.
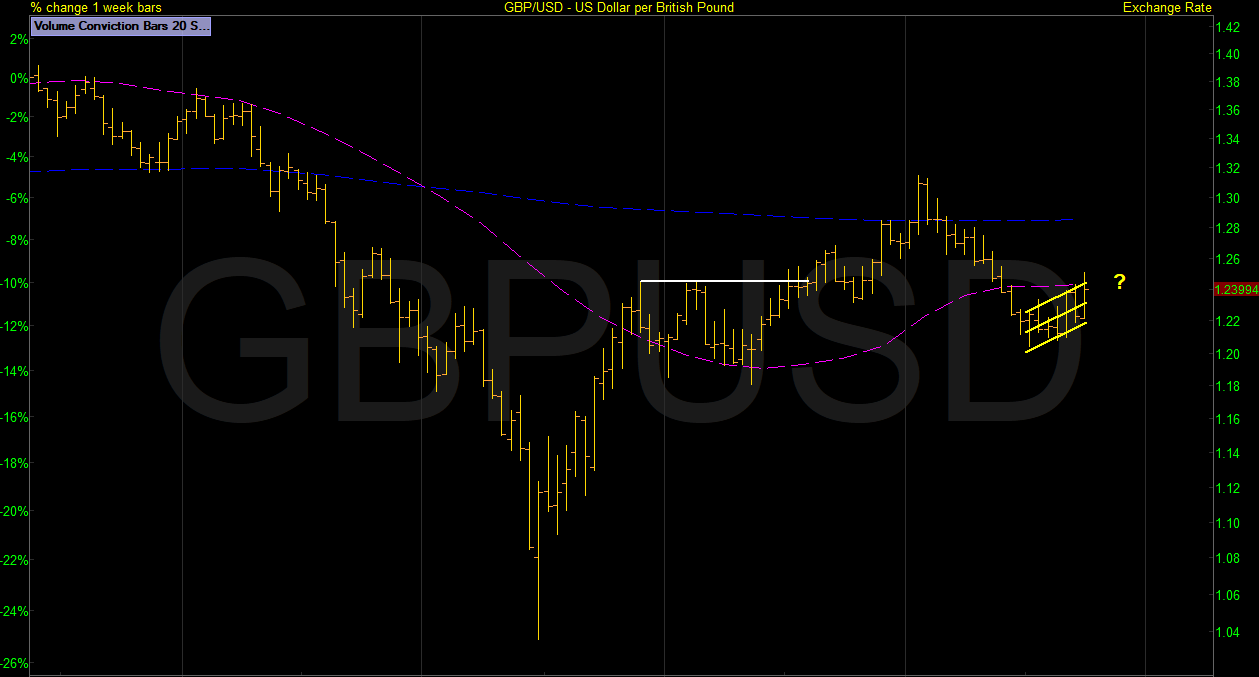
GBP/USD Emerged from a potential St1 Base but has seen a hard correction and currently looks like a bear channel below the 10-month (200d) average.
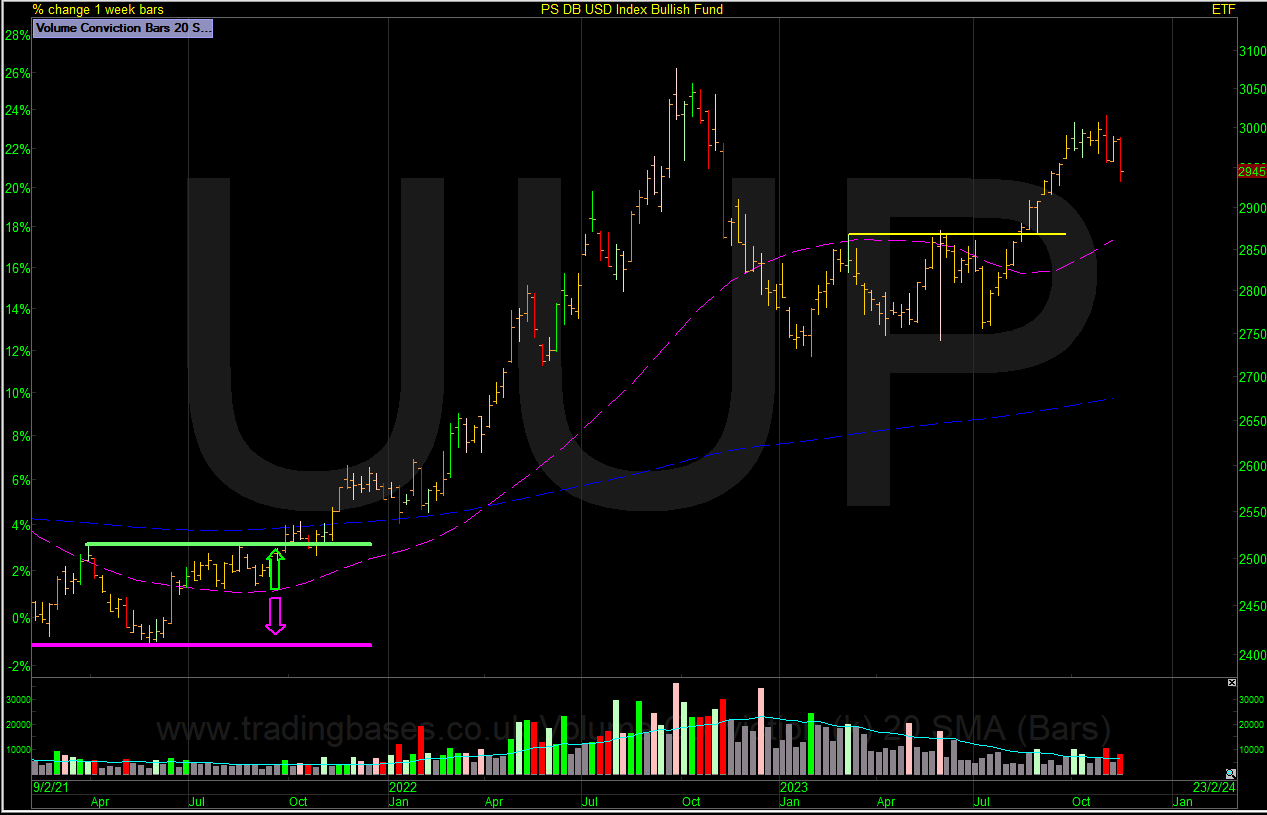
UUP built a base and then broke higher. Normal pullback to 100-day area.
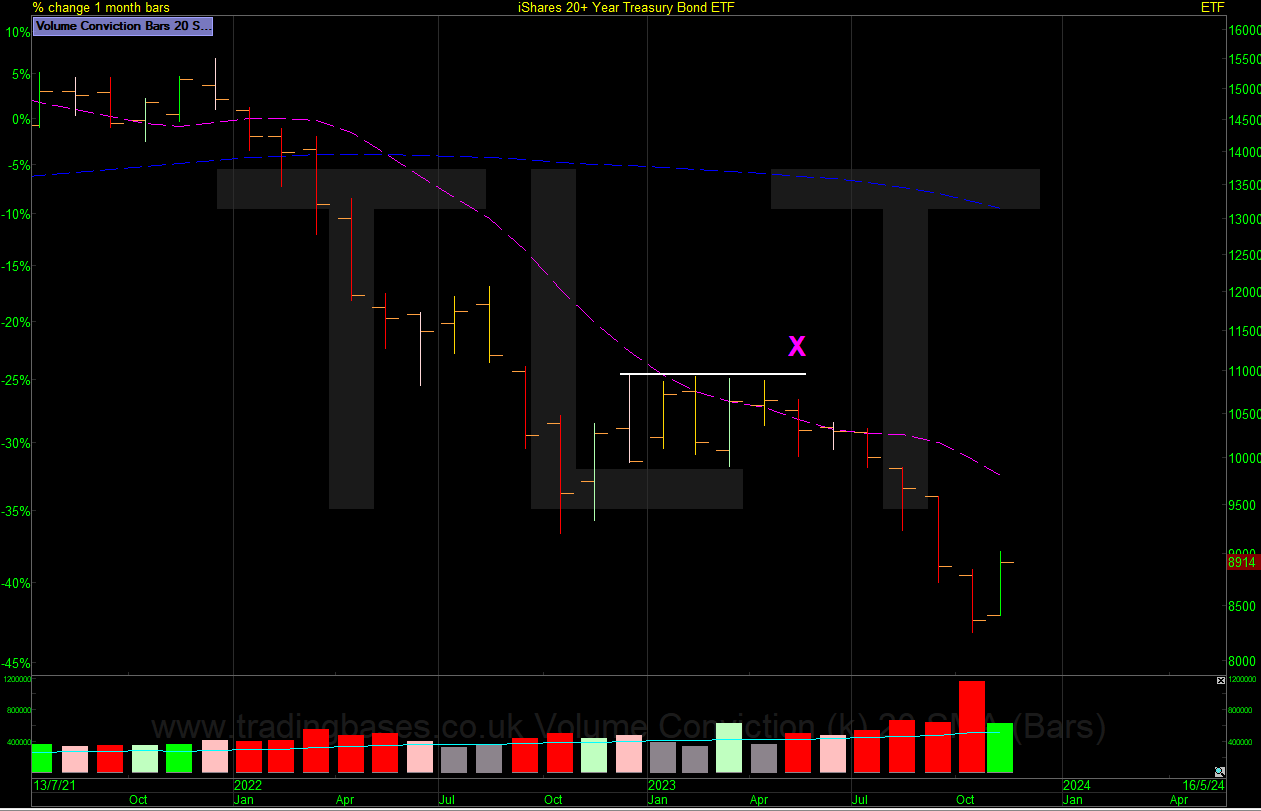
TLT 20-Year Treasury Bond – No breakout from the prior base and what followed was a high volume move through the lows culminating in a weekly reversal on the highest volume ever traded. Note the monthly chart trying to reverse on volume conviction. 2 Weeks to go for the monthly close.
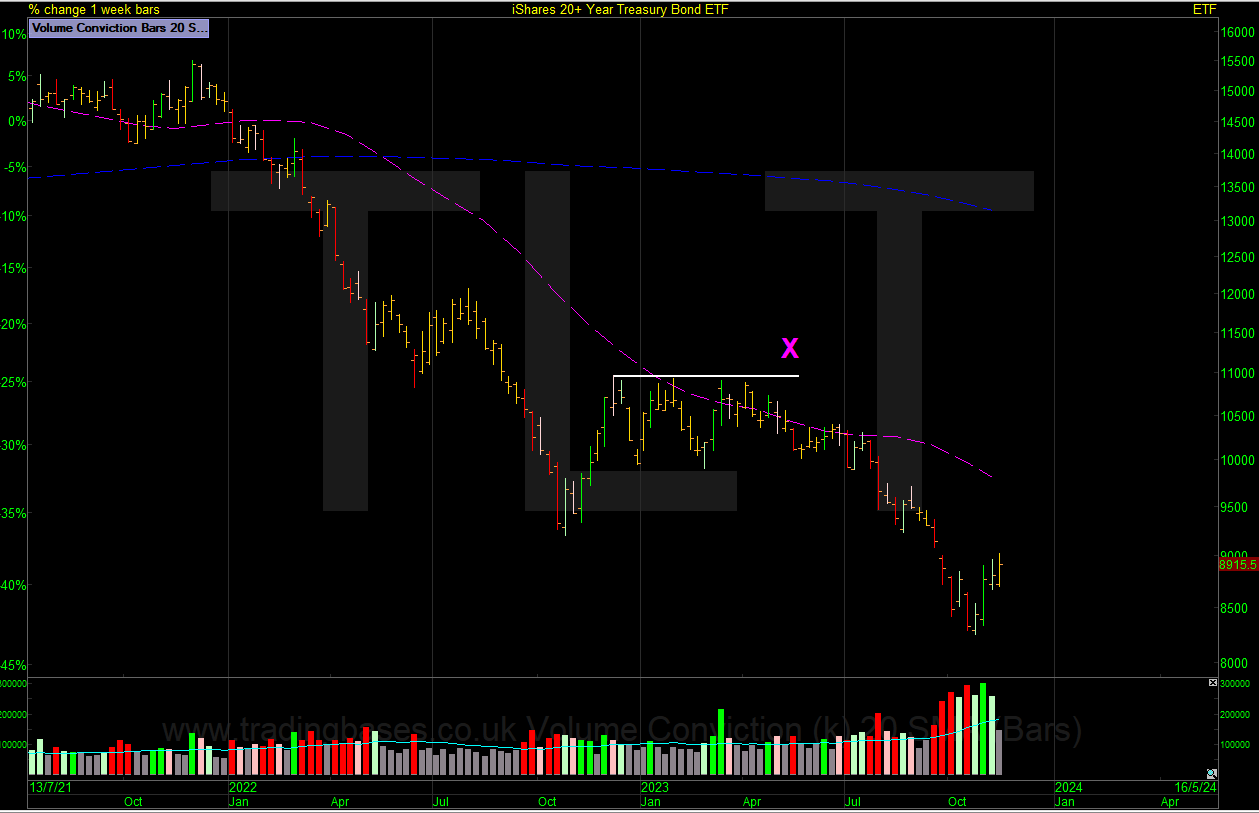
TLT 20-Year Treasury Bond – Note the monthly chart trying to reverse on volume conviction. 2 Weeks to go for the monthly close.
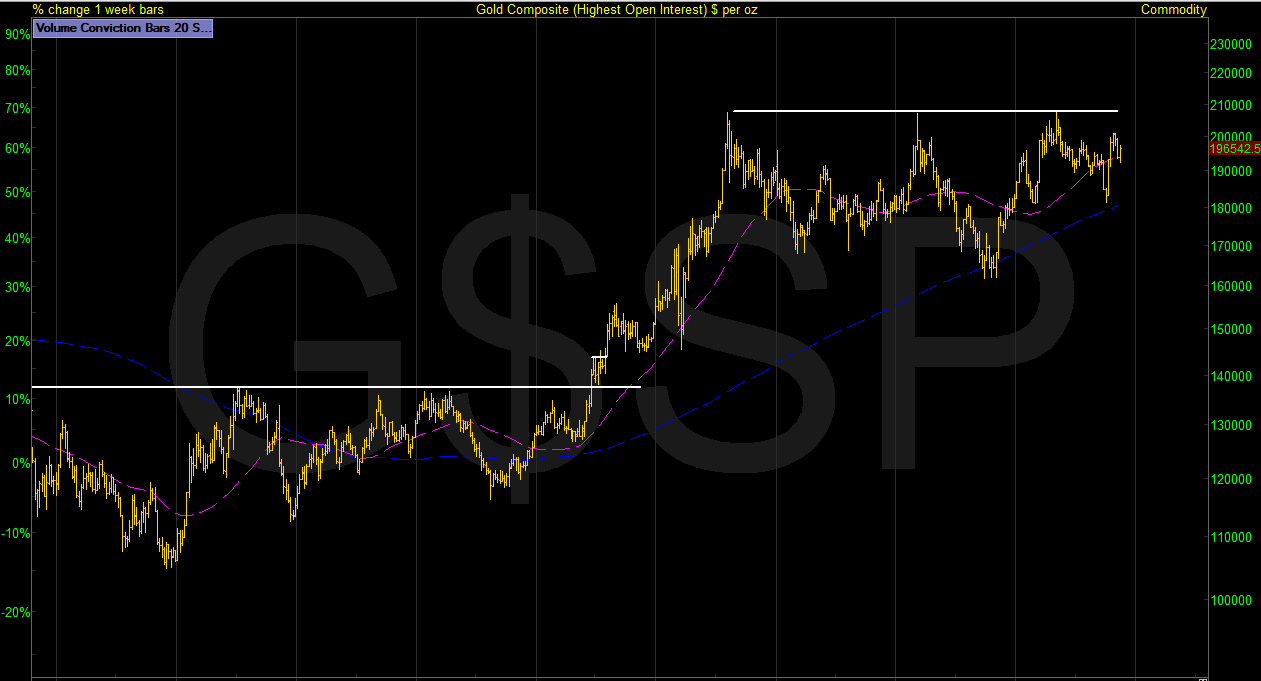
GOLD In a large base finding resistance at multiyear highs so look for higher lows and tightening (coiling) price action building up pressure for a possible breakout.
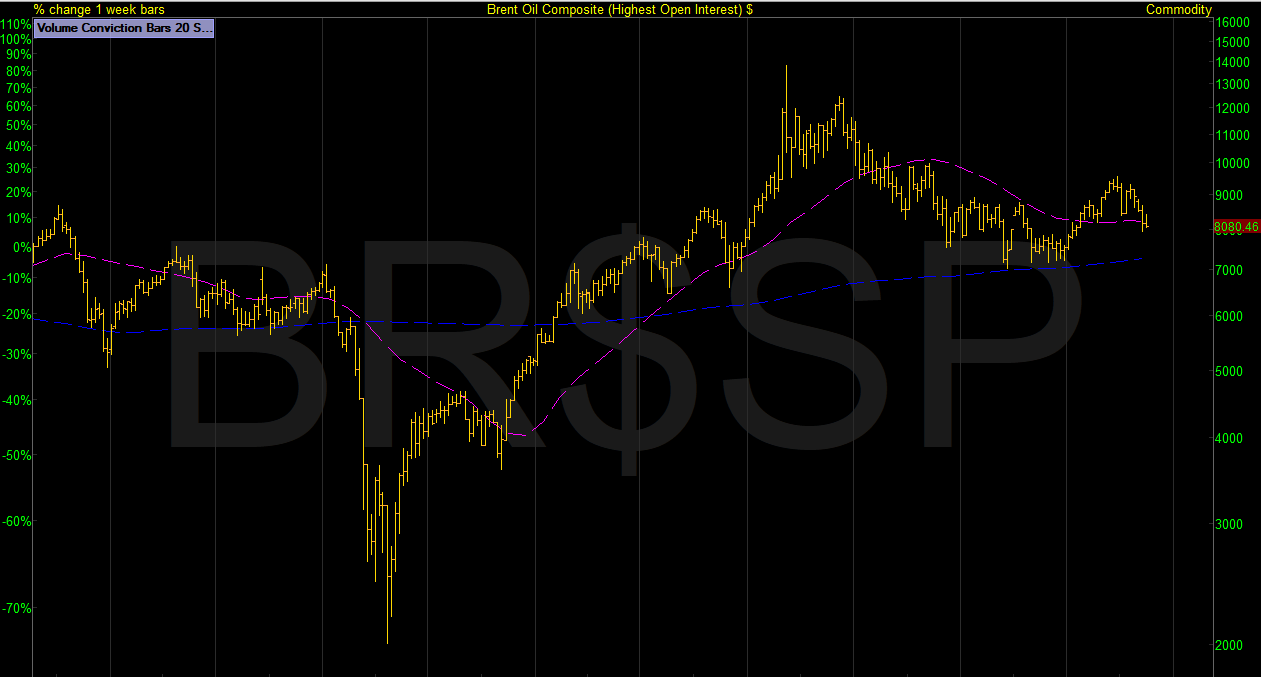
OIL BRENT still above the 50-month.
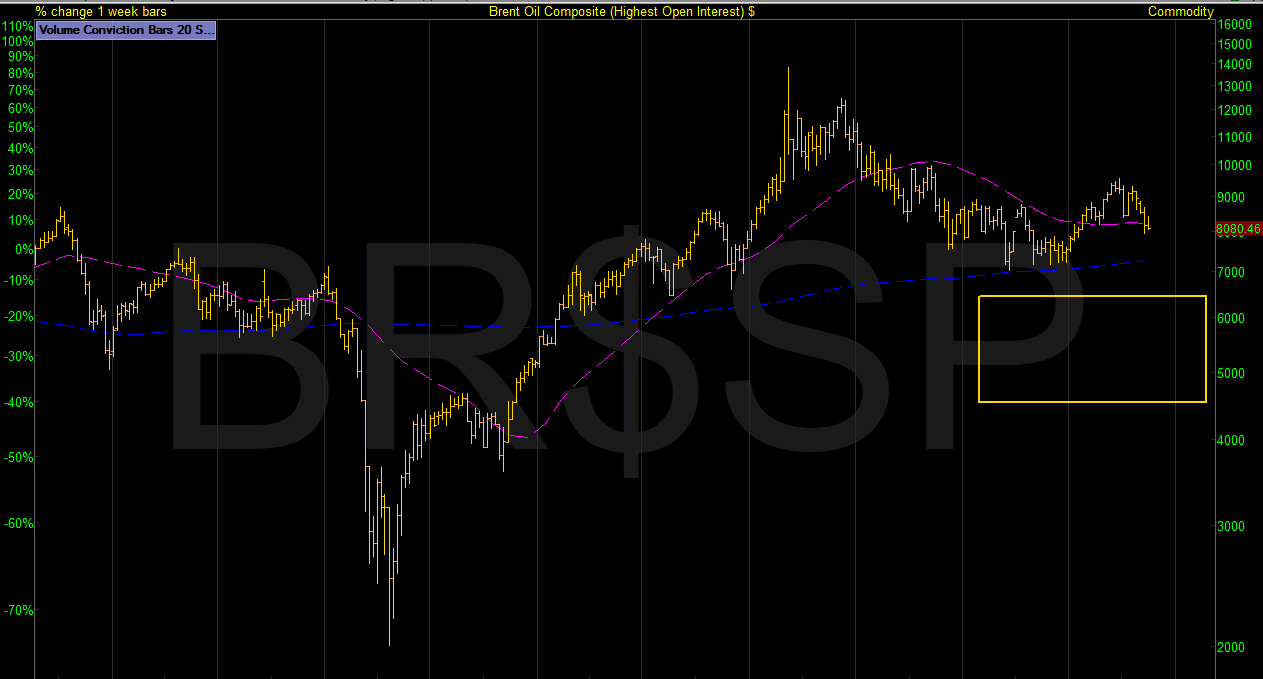
OIL BRENT my preferred area for oil to trade that would be better for the markets.
What Have the Daily Screens Been Seeing?
Recently we are seeing a pickup in large caps and investment trusts hitting the breakout screens. Money flowing back into the lower-risk stocks after the correction is the first part of the puzzle. Let’s see if that money can spill over into the smaller-cap high-growth names going forward. Oilers and gold stocks are keeping a low profile and still missing the strength screens in any numbers. If there is going to be a big move in these areas, we will see them all come through the strength screens first.
And As Always Trade What You See.
Jase
Got some thoughts on this week’s article from Jason? Share these in the SharePad chat. Login to SharePad – click on the chat icon in the top right – select or search for a specific share or the “Traders chat”.

This article is for educational purposes only. It is not a recommendation to buy or sell shares or other investments. Do your own research before buying or selling any investment or seek professional financial advice.


