
In this article, I’m going to cover how I use volume to assist my trading and investment decisions. I will cover multiple timeframes to see who is in control of price action and whether those that are in control of the price action are distributing or accumulating positions as a group. I will look at volume at a reversal of a trend. I will look at finding better breakout levels that were built on volume and I will also cover the actual breakout itself and quash a few myths.
I will talk about accumulation and distribution bars on daily weekly and monthly timeframes, volume conviction and smart money so I will cover these terms first.
Accumulation Bar – A bar that closes up on above-average volume. Wide range bars showing volume conviction.
Distribution Bar – A bar that closes down on above-average volume. Wide range bars showing volume conviction.
Smart Money – Institutional money and large holders.
Volume Footprint
We can study the volume footprint on any timeframe from intraday charts to monthly charts. For this article, I will run through daily, weekly and monthly charts. The volume footprint shows you who is in the driving seat controlling the price action. Bulls (accumulation) or bears (distribution)
Multiple timeframe volume analysis and the smart money
We can also see if smart money is in control by looking for sustained volume interest on more meaningful timeframes of the weekly and monthly charts. The daily chart volume footprint will highlight every news report or stock tip where retail investors became active but many of these higher volume days can fizzle out and not be seen on a weekly or monthly timeframe. We want to separate short-term noise from medium to long-term sustained conviction.
Volume accumulation or distribution shows conviction
To help clearly visualise the volume footprint of accumulation and distribution on the charts I developed my own way of studying volume called Volume Conviction and volume conviction bars. It was added to ShareScope in 2016 and is now also available in SharePad.
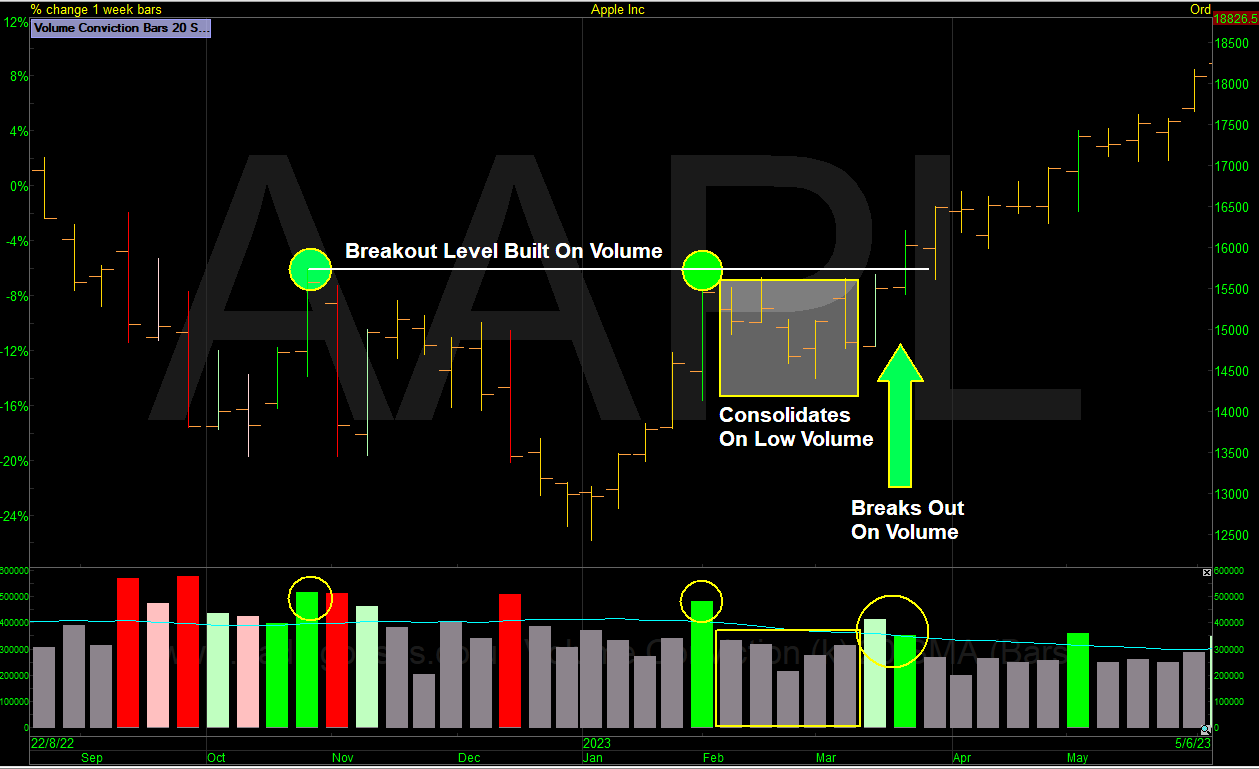
The Chart of Apple using Volume Conviction indicator and Volume Conviction Bars.
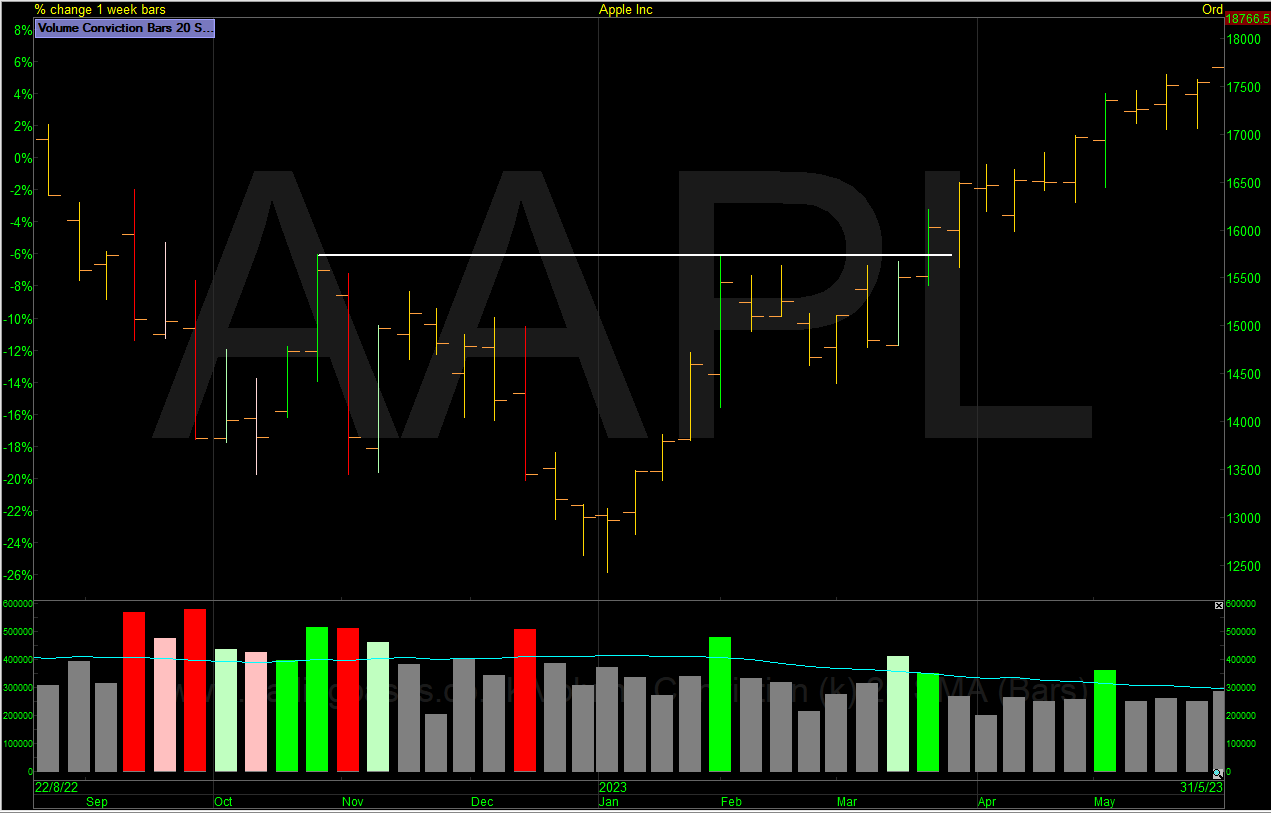
You can clearly see on this weekly chart of Apple that the green-up weeks on above-average volume have what I term volume conviction. The same goes for the down weeks on above-average volume. The emphasis being placed on wide range bars. Accumulation & Distribution. The above-average volume bars on the chart are coloured to replicate the volume histogram. The below-average volume bars are grey.
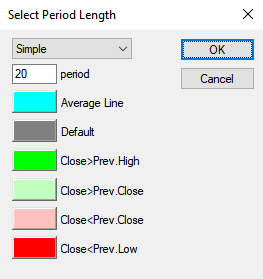
Add Volume Conviction in ShareScope
To add Volume Conviction – Add Indicator / ShareScope Indicator / Search for Volume Conviction in the script library.
These are my settings for the volume histogram.
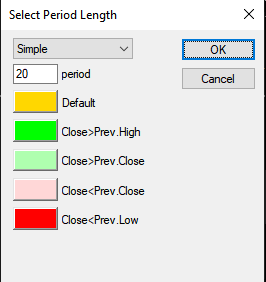
To add Volume Conviction Bars – Other Main Graph Features / ShareScope Studies / Search for Volume Conviction Bars in the script library.
These are my settings for the volume bars. The only difference being I like orange bars on the chart.
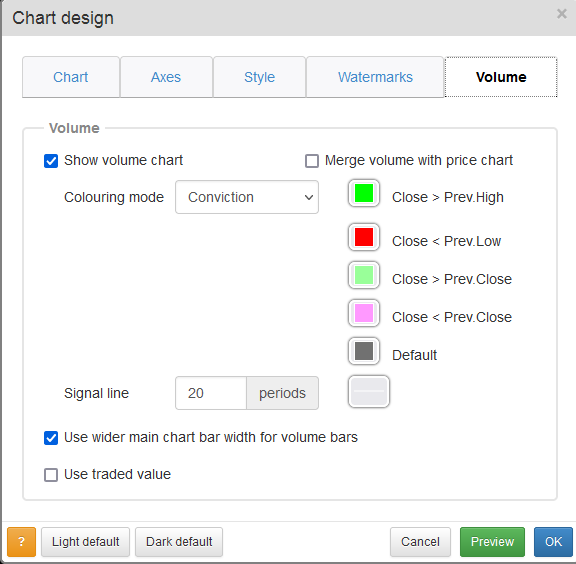
Add Volume Conviction in SharePad
To add Volume Conviction – Design in bottom left / Volume / In colouring mode select Conviction.
These are my volume conviction settings in SharePad.
Examples of How I Use Volume
Below are some examples of what I look for when studying volume accompanied with an example on a chart.
- Volume During consolidations
- Defining Breakout Levels
- Volume During Breakouts
- Volume During Pullbacks
- Volume Around Reversals
Volume During Consolidations
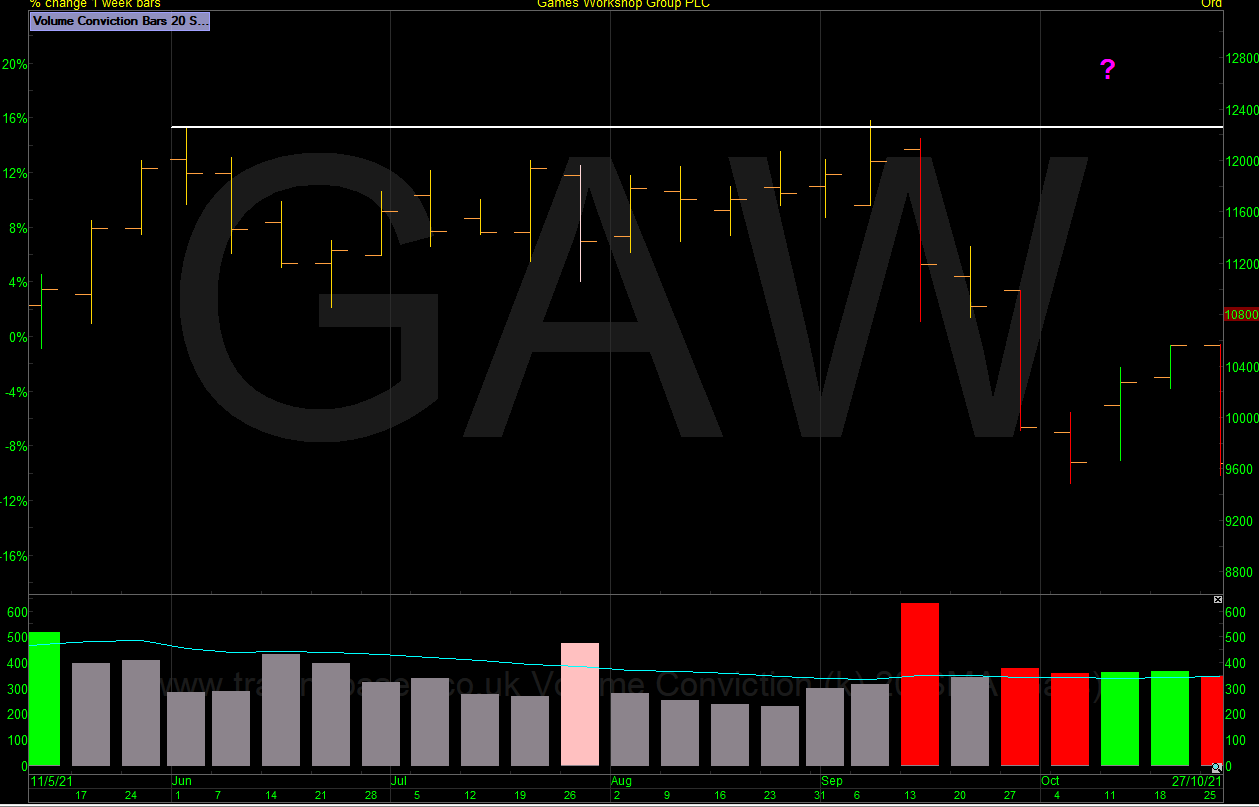
When a stock trades sideways in a base I want to see what the smart money is doing. This base in Games Workshop from 2021 was built on low volume and the high-volume weeks were all to the downside.
Games Workshop Weekly Chart. No accumulation. Notable distribution. Avoid.
Games Workshop 2 Day Chart. Note the large range days are all showing distribution.
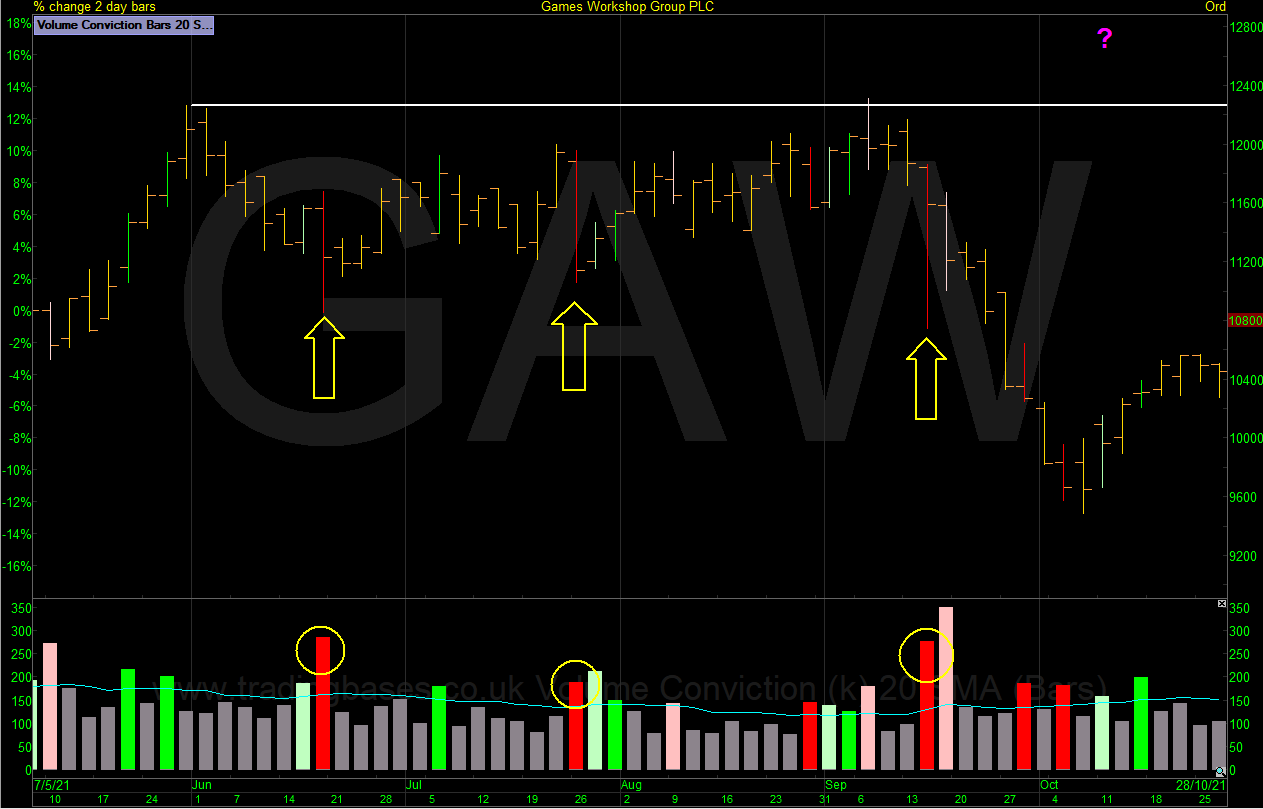
The Games Workshop base failure marked the top in the trend and a classic case of bus too full. It just ran out of steam and anyone with volume conviction on their chart could clearly see this before the huge leg down. When a stock is melting higher on decreasing volume and being smashed back down on above-average volume It tells us the stock is under distribution.
In 2015 Gamma Communications built a multi-month base following a move higher off its IPO in 2014. The market topped out in June, but GAMA showed no weekly large-range distribution bars and continued to consolidate sideways in a base. Accumulation weeks are few but in a tough market, we have no red flags of note. Good action in a bad market culminates in a +60% rally on volume in the following 5 weeks.

Defining Breakout Areas
I like to see breakout levels that are built on volume. Price moving above a breakout level that was built on high volume over a meaningful timeframe is telling me I should take notice. The sell pressure that came in at the price that built the breakout level has subsided.
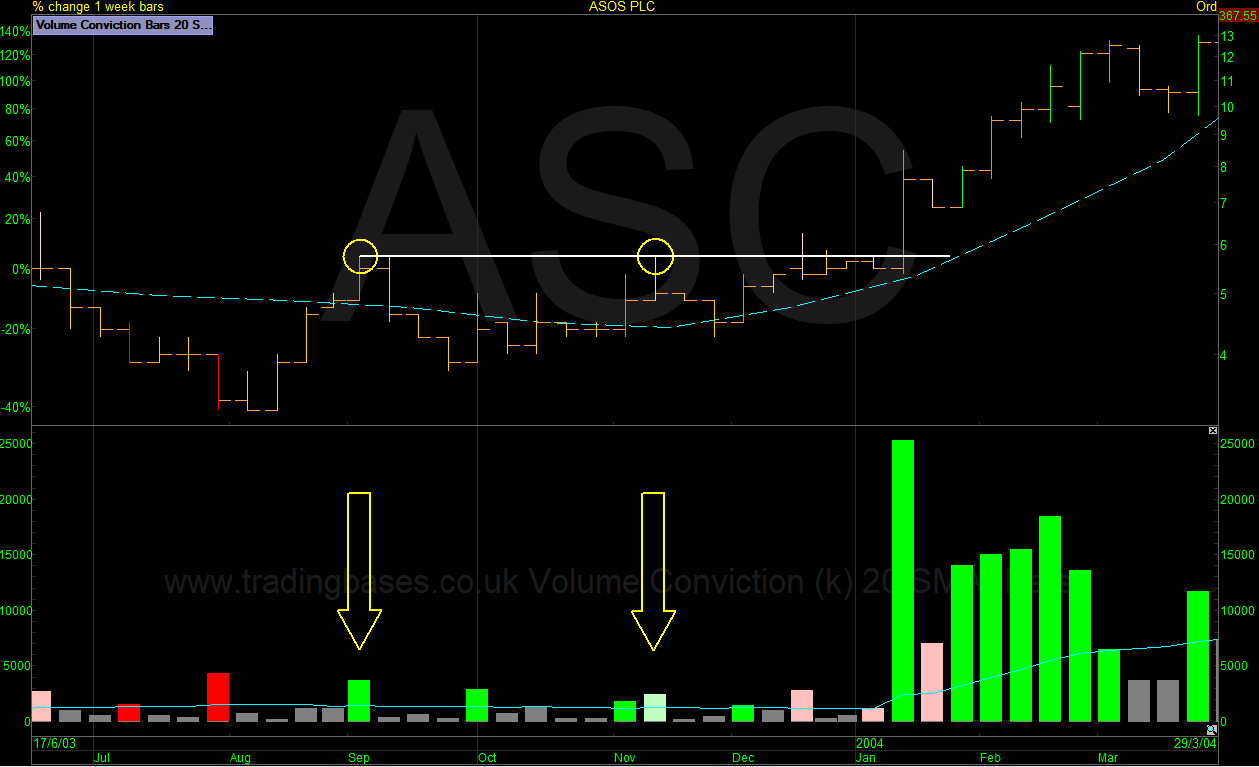
ASOS from 2003 is a great example of this. ASOS built a multi-month base and the defined breakout level is very clear. The weekly chart highlights the defined 5.75 weekly bar levels were posted on above-average volume. These levels were also above-average volume monthly bar highs.
ASOS breakout level built on above-average volume.
Volume During Breakouts
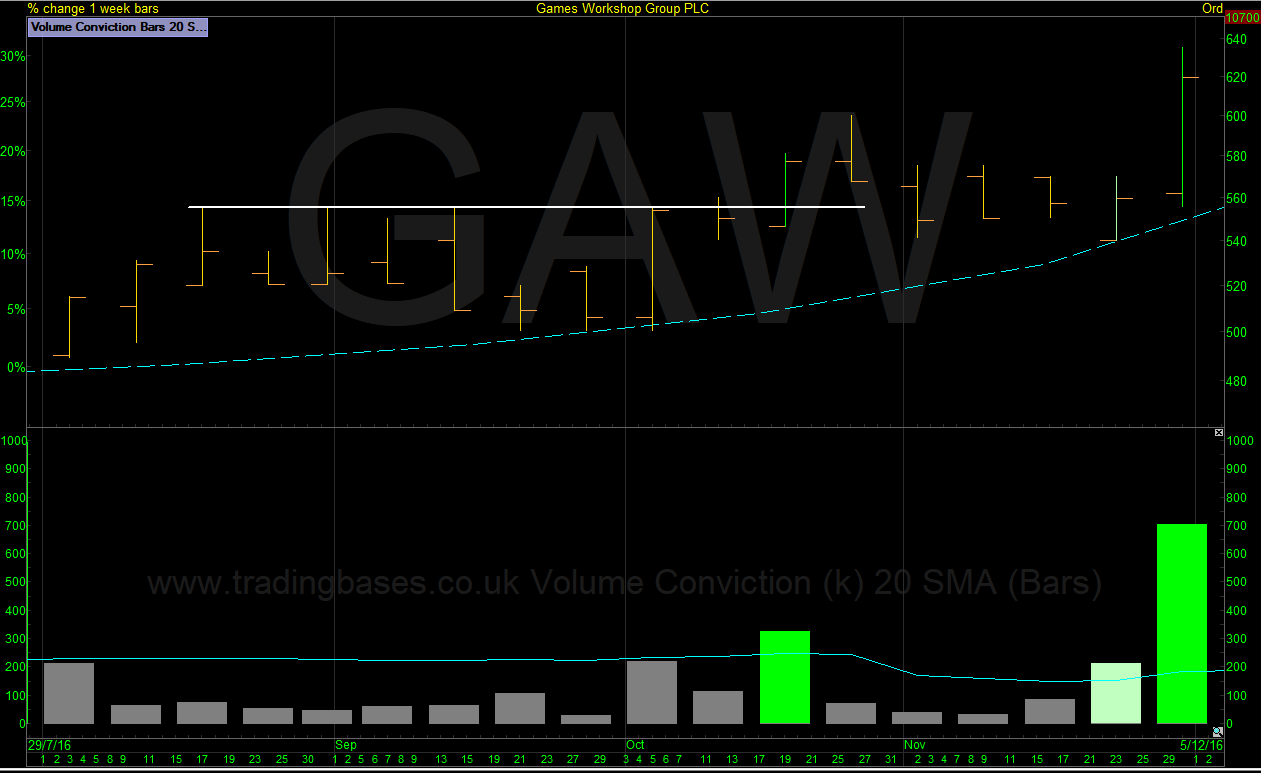
Slow Burners – Some stocks sneak out of the base on low daily volume and gain more volume interest as the stock starts to gain attention. In 2016 Games Workshop emerged from the base on extremely low daily volume but the weekly timeframe told a better story posting a conviction bar. Games Workshop still traded sideways for another 5 weeks before leaving the area on volume conviction.
If you subscribe to the commonly held belief that you should avoid breakouts on low daily volume you will miss some great winners. The actual breakout isn’t so important to me than the mechanics of how the level was built and who is in charge. Is retail breaking the stock out on a newspaper tip on high daily volume? Is the stock breaking out on low volume after smart money has soaked up all the supply? Two very different scenarios and the retail pop is more likely to fail and recoil back into the base until the smart money is ready to support the breakout. It’s my belief that smart money builds the base and in the examples above the base on GAW that marketed the top in 2021 was built by smart money distributing their position over time and the base on GAMA was built by smart money accumulating their position over time. Once the buy and sell pressure equalises as the price action coils tighter the stock can trend again higher or lower and often in an explosive fashion. This could be evident on a daily timeframe but sometimes it might sneak out on lower volume and not be visible until the weekly highlights it. My point being, I prefer to focus on consolidations and breakout levels that were built by institutional smart money over a meaningful timeframe. If you zoom out of the daily charts while studying volume you will also zoom out of the noise.
Games Workshop breakout on below average daily volume.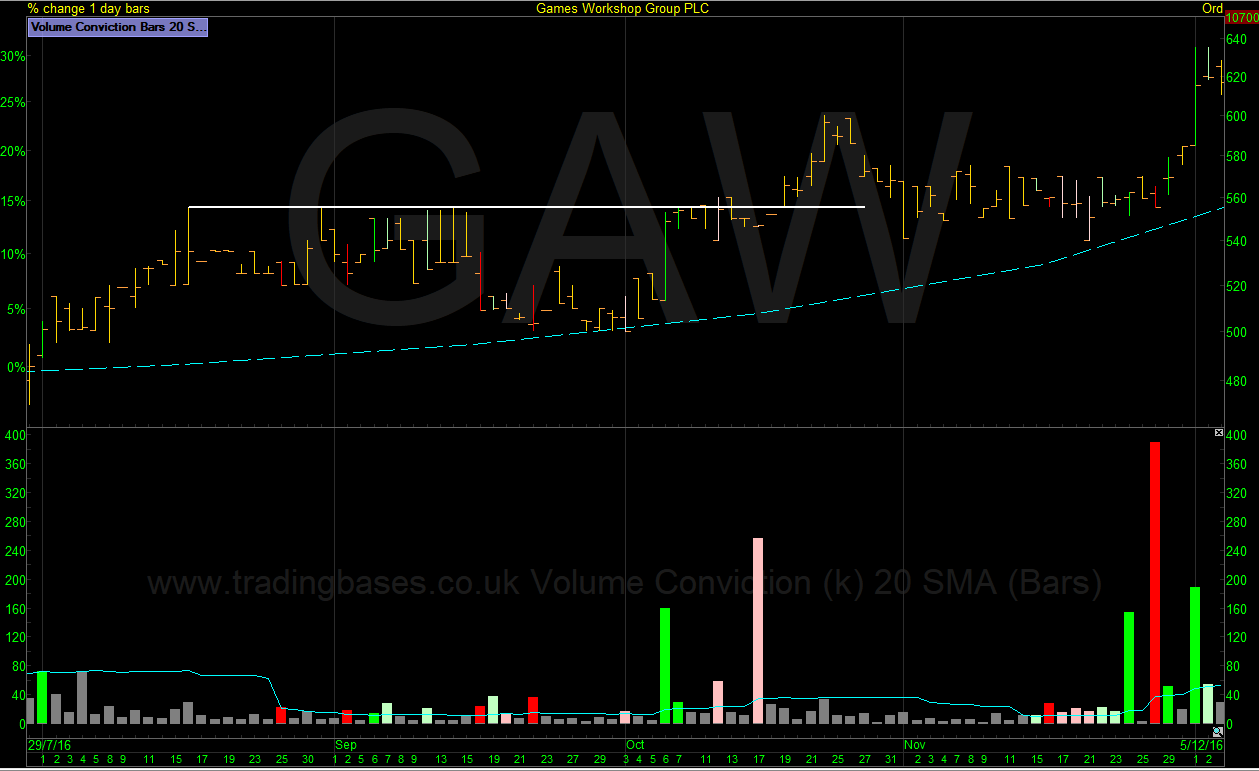
Games Workshops volume conviction breakout is clear to see on the weekly chart.
Games Workshop Monthly Volume Conviction Bars.
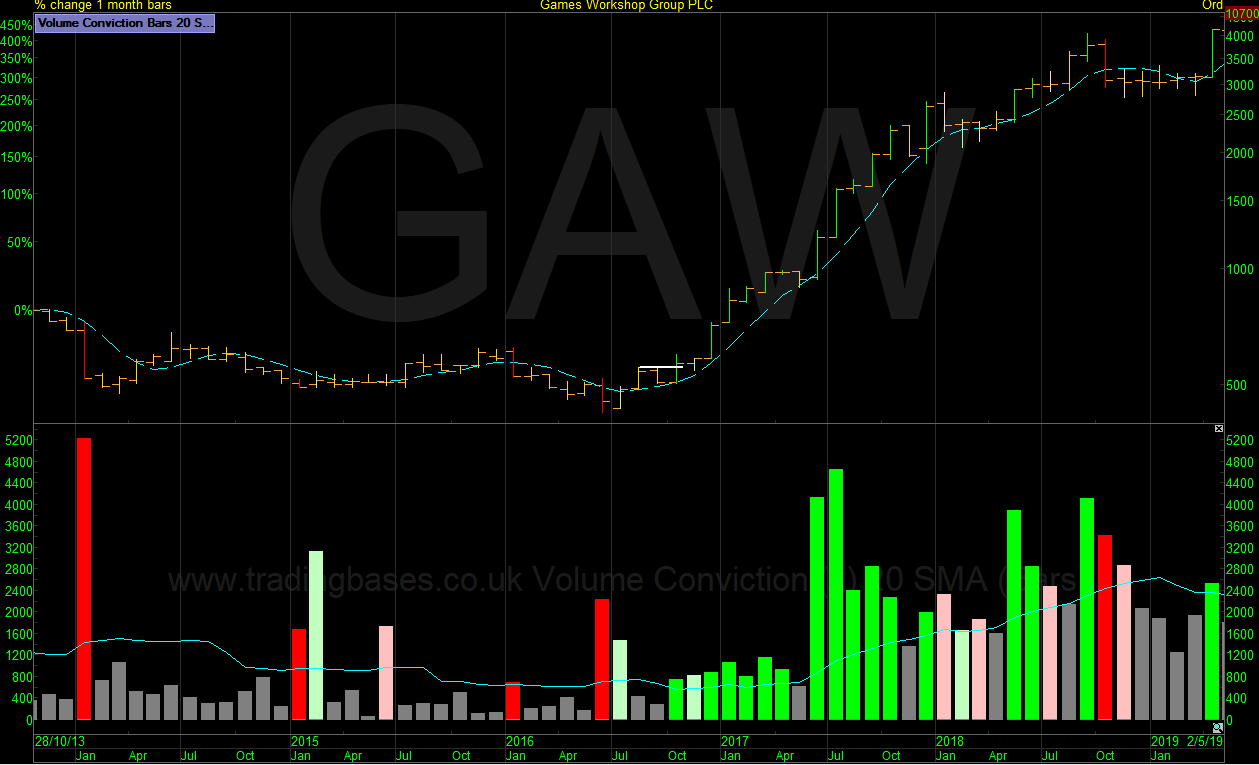
Games Workshop posted a monthly volume conviction breakout 10 days after the weekly and the rest is history. 13 out of the next 15 months closed on monthly volume conviction.
Volume During Pullbacks
In a perfect world when a stock is trending higher or in a base consolidation, I want to see it pull back in an orderly fashion on below-average volume. In the real world, many will have the odd distribution bar thrown in, especially on the daily chart.
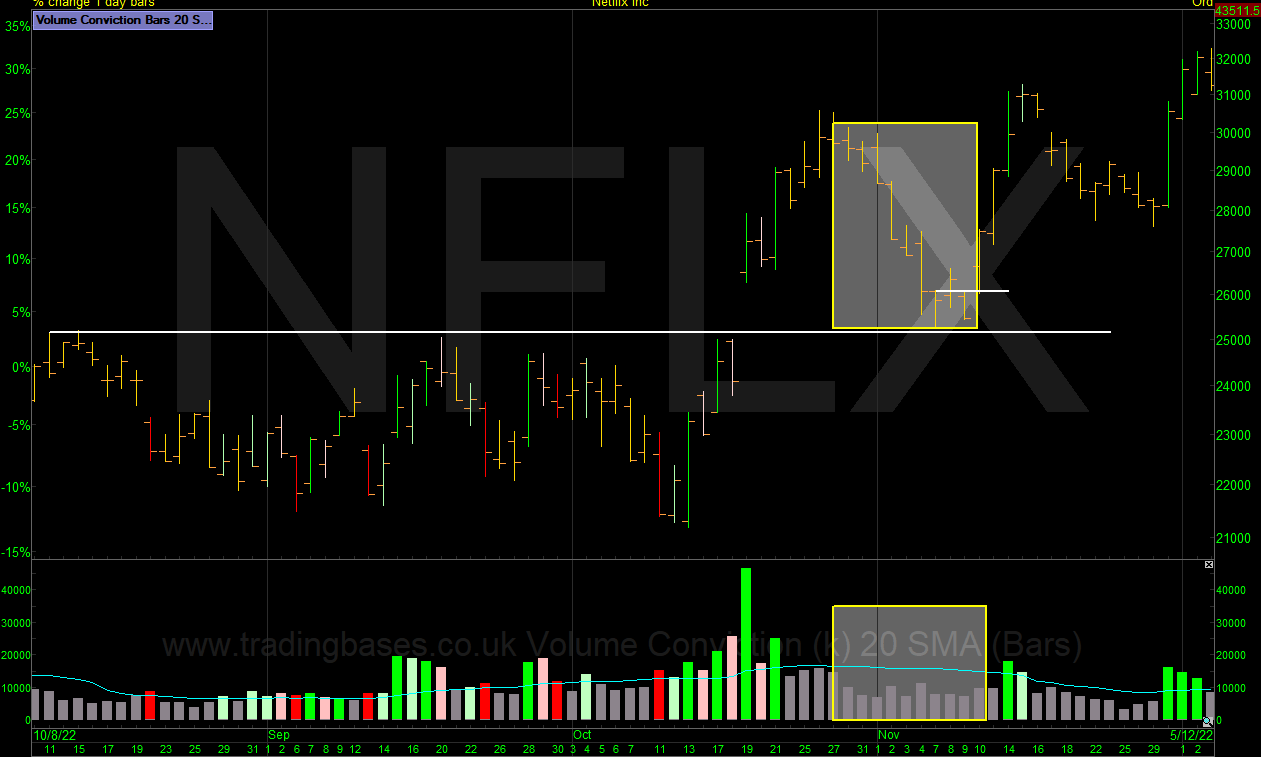
Netflix Pulls back on low volume to the breakout area before reversing higher. 1-day Chart.
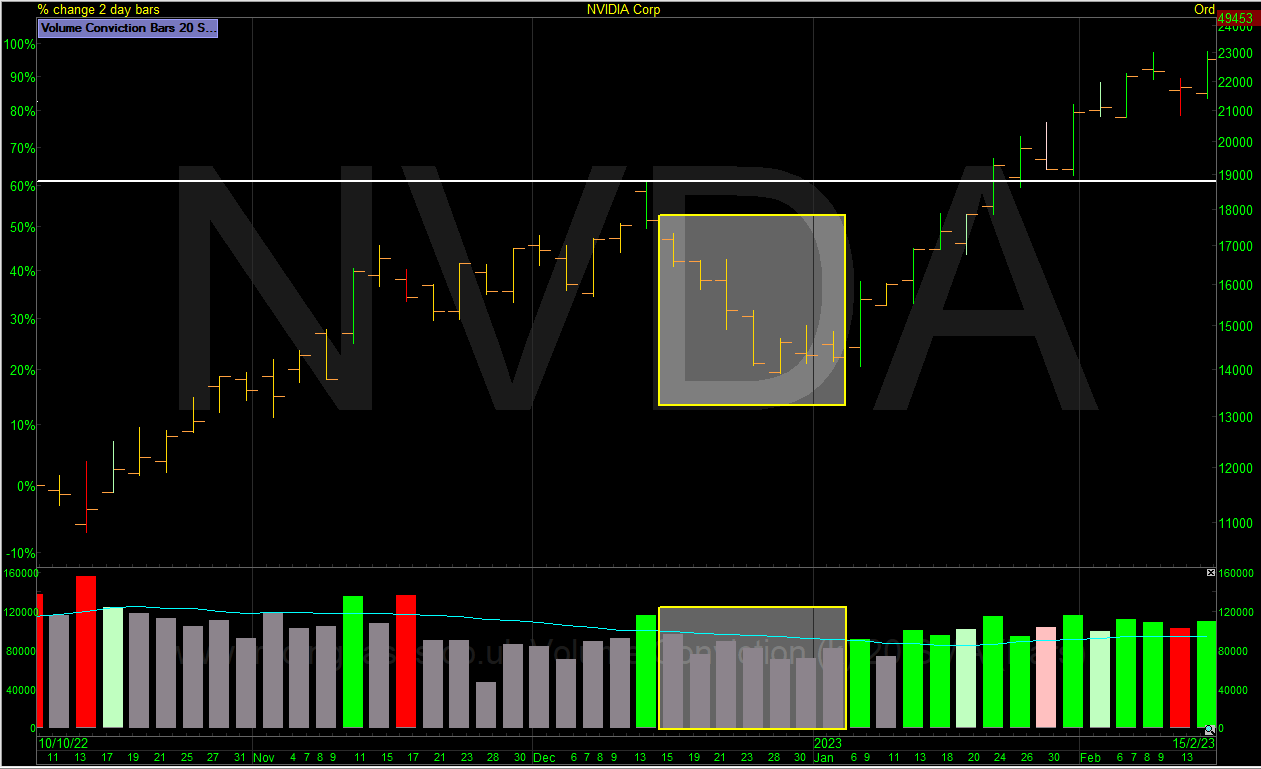
NVIDIA Pulls back on low volume before reversing higher on volume conviction. 2-day Chart.
Volume Around Reversals
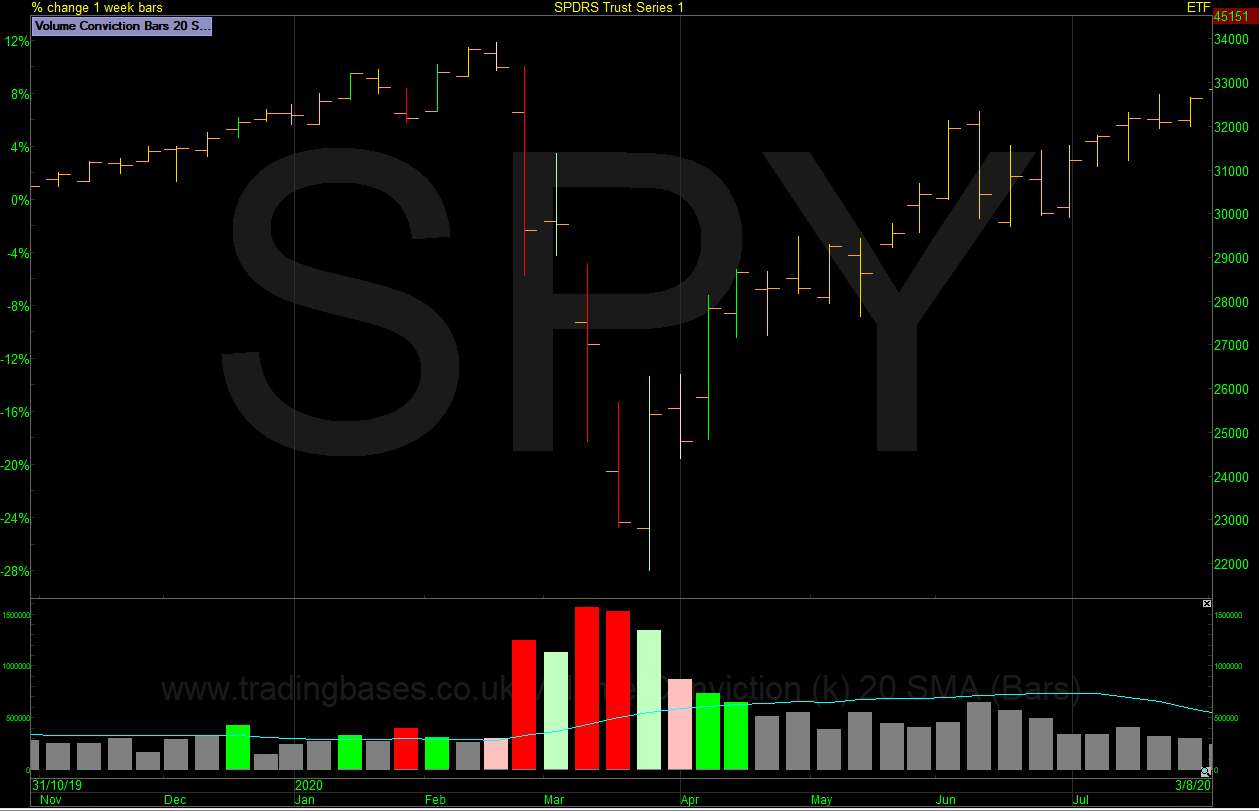
The SPY chart from the covid crash of 2020 makes for a great example of what to look for when a market move becomes exhausted. Do you remember how the news feeds questioned the low volume recovery? The weekly chart shown below traded all the way back to new all-time highs before any distribution hit the chart. If you traded off price and volume you probably did extremely well but if you traded off news and opinions, you probably had an extremely tough and confused time.
SPY 3-day chart.
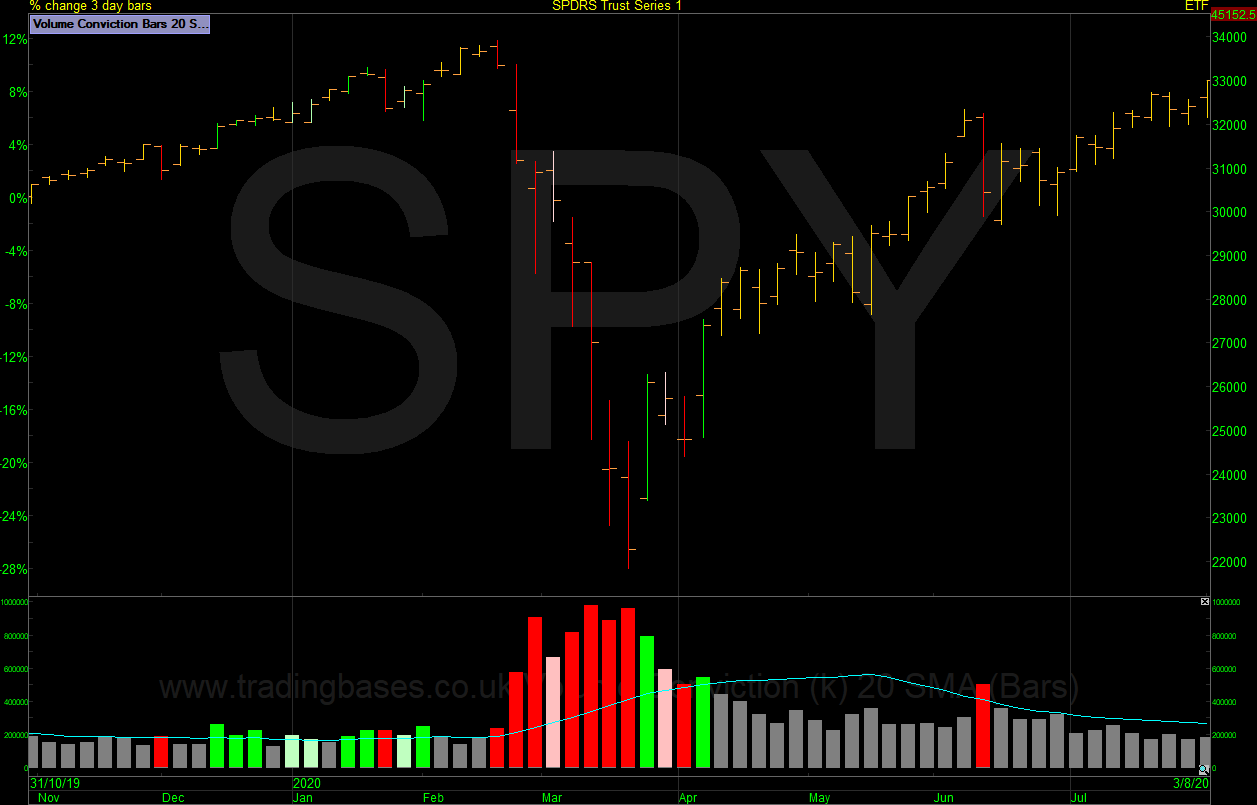
SPY Weekly Chart – Note no distribution weeks came in on the run back to all-time highs.
Final Note
Though sometimes all the stars do align, realistically I’m not expecting to see everything I like from the volume footprint in the base to the high-volume breakout on the daily, weekly etc. Studying how the smart money is positioned helps me make a better informed decisions and psychologically its far easier knowing I’m aligned with the smart money when it comes to trading my plan. It can help me avoid late-stage bases built on distribution (GAW) and highlight early bases built on accumulation (GAMA, AAPL, ASC)
Apple – Sometimes the stars align.
Jason Needham
Got some thoughts on this week’s article from Jason? Share these in the SharePad chat. Login to SharePad – click on the chat icon in the top right – select or search for a specific share or the “Traders chat”.
This article is for educational purposes only. It is not a recommendation to buy or sell shares or other investments. Do your own research before buying or selling any investment or seek professional financial advice.


