
In this article, I’m going to jump straight into the business end of where the money is made when you’re right. I’ll run through three methods of managing a winning position; from a defensive stance of de-risking or top-slicing the position, to an aggressive approach of adding to the position as it rises.
It’s not whether you’re right or wrong but how much money you make when you’re right and how much you will lose when you’re wrong. George Soros
The 80 – 20 Rule
Invented by the Italian economist Vilfredo Pareto in 1906 the 80 -20 rule (Pareto principle) when applied to investments assumes that 20% of a portfolio’s holdings will account for 80% of the portfolio returns. If I expand on that from a trend-following point of view let’s say I trade 20 stocks from entry to exit. 80% of the returns will probably come from 4 of those stocks. Those 4 stocks will be considered outliers so if the bulk of returns comes from the outliers It’s logical that this is the area we should focus on if we want to be better than average. The catch is we don’t know which of those 20 stocks will be an outlier. All we can hope for is that if we cast a net over the right group of stocks, we will have the occasional outlier in the mix, but I must add that we must trade those stocks in a way that will return an outlier on the ones that survive long enough (trend) and with this in mind I’ll show you how I approach it on a small-cap growth stock targeting a primary trend of months to years.
The Entry
To keep everything simple and easy to understand I will run this example using a £100K account and the risk on the trade will be 1% of the account (£1000)
To position size for this trade we need a few things. An entry and exit price for the stop distance (the bracket) and risk per trade calculated from 1% of the closed balance of the portfolio.
- Entry Price = 350
- Exit Price (stop loss) = 315
- Stop Distance (entry – exit) = 35
- Risk in pounds £100,000 x 1% = £1000
Calculate the Position Size by dividing the risk by the stop distance.
1000/35 = 28.57 Lots or 2857 shares. (1 Lot = 100 shares) Multiply lots by 100 for shares.
Position Sizing Calculator from trading bases.
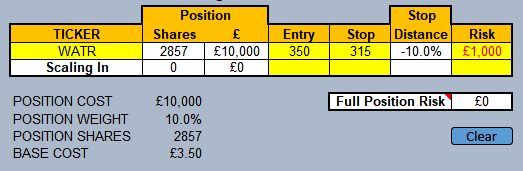
I’ve chosen the tight bracket and risk of 1% of account on this trade to keep it simple but as you will notice a 10% weighting will be far too heavy on entry for most investors. You can simply widen the bracket (stop distance) or lower the risk to adjust the weighting. Lowering the risk to 0.5% would halve the weighting to 5% on entry.
Outliers Will Earn Their Weighting
A common misconception is that you must bet big to win big. In practice, you can and probably should bet small and practice patience to win big. Betting small on entry makes holding a basket of stocks psychologically easier and as some of those stocks start to trend in your favour, they will earn their weightings in the portfolio. Think of it as a diversified basket of potential winners on entry and a concentrated weighting in those stocks that are working. Concentration is the result of adding to winners and price appreciation.
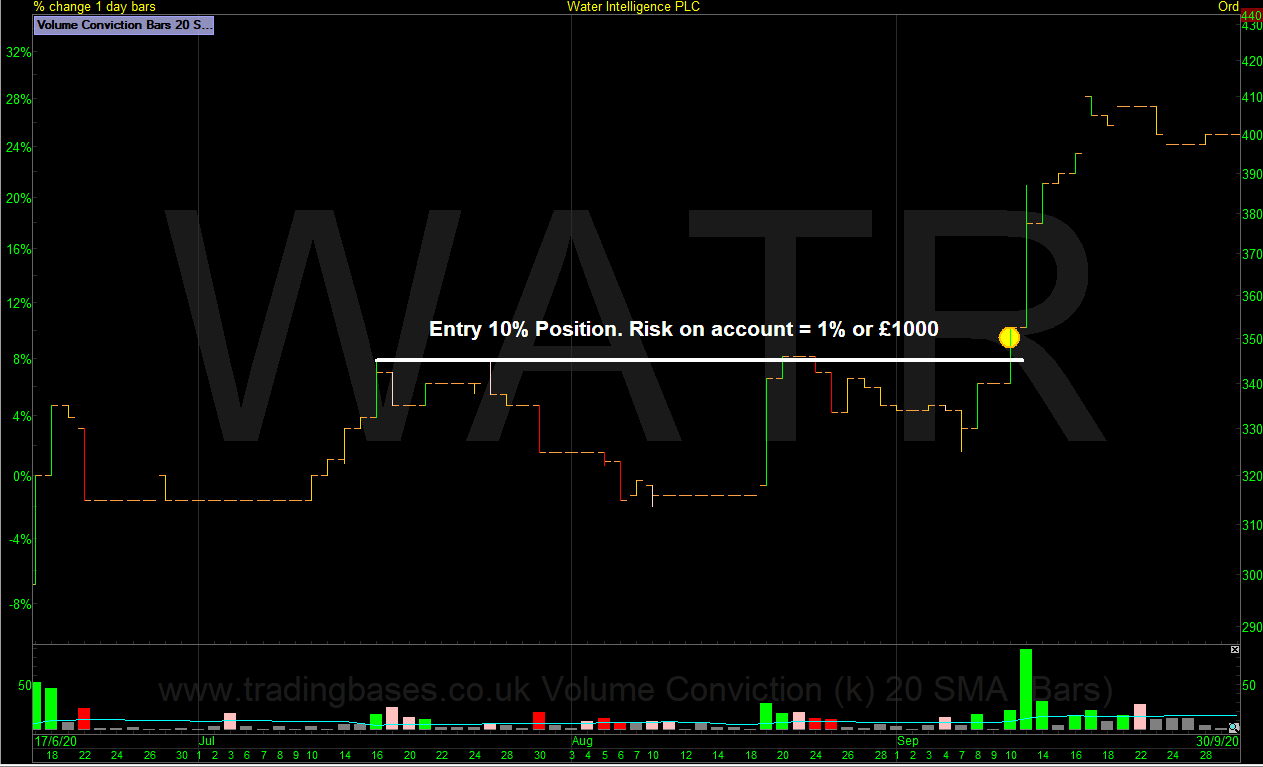
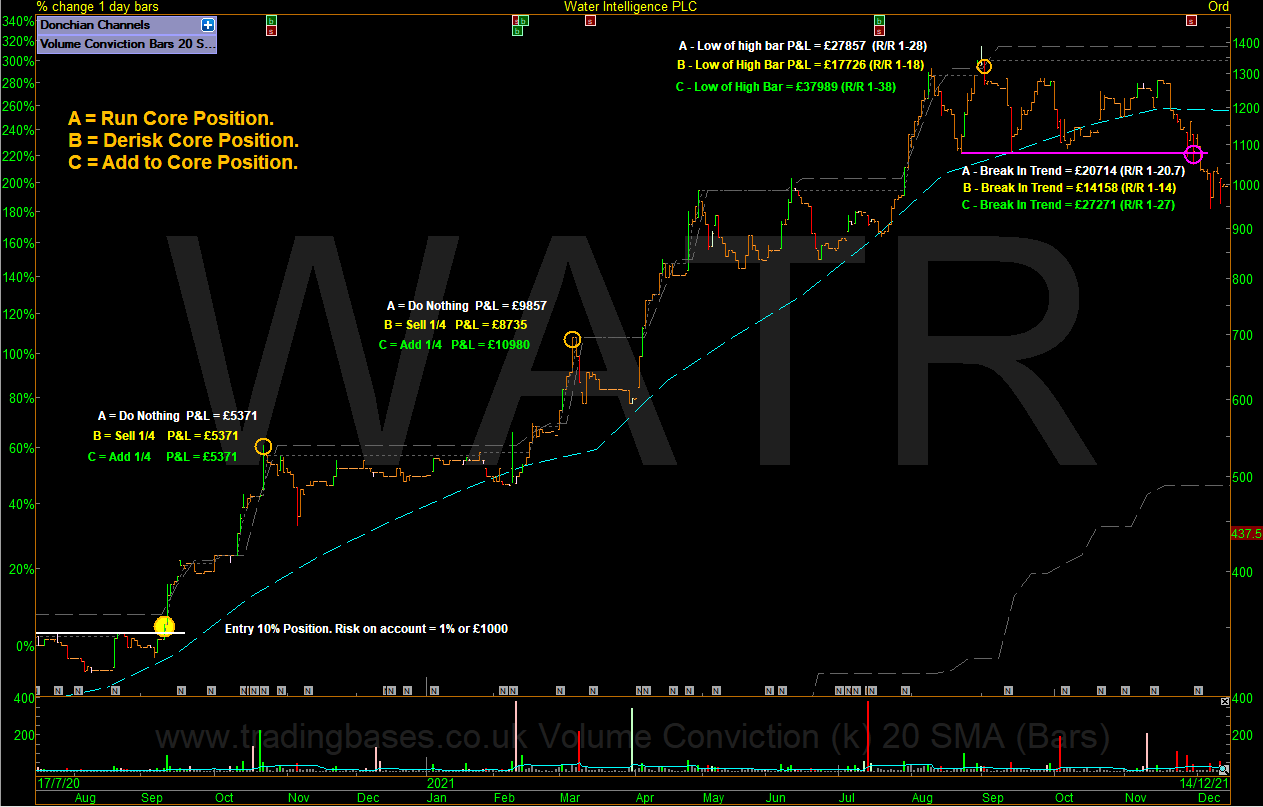
Water Intelligence – The Entry
Three Methods of Trade Management
Now we have a position sized for and entered we move forward with the trade management techniques to compare the outcomes of three different methods from defensive to aggressive. The risk of the aggressive method will never go up over 1% of portfolio. It will go down once a trailing stop starts to lower risk.
Adjustment 1
The stock rallies over 50% in a short period of time. There are three methods I’m going to compare. Method A will hold the original position from entry to exit. Method B will sell a portion on the way up to lock in some gains (top slice) and method C will add to the position as it rises. I’ve given method B the use of a crystal ball and allowed it to get the high of the move. This obviously means method C is getting the worst price to add to the current move.
- A – Do Nothing. P&L = £5371
- B – Sell ¼. P&L = £5371
- C – Add ¼. P&L = £5371
Water Intelligence – Adjustment 1
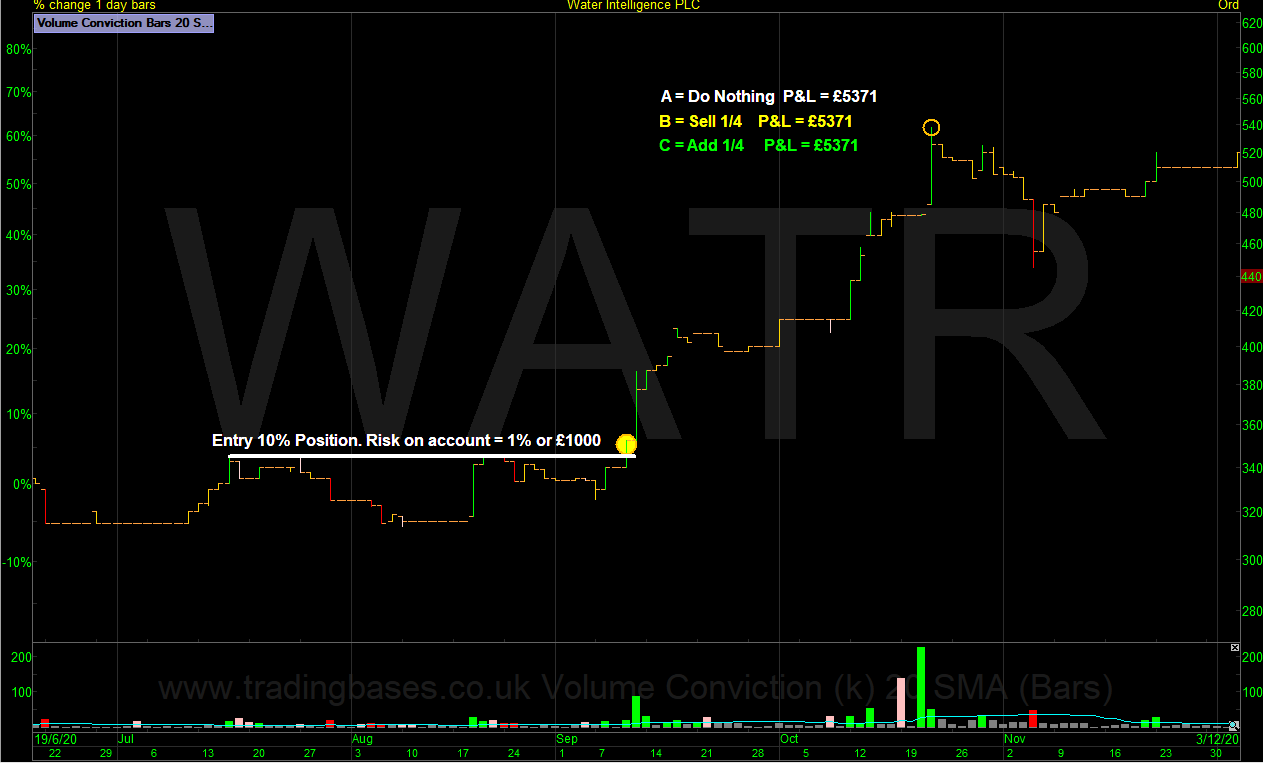
Adjustment 2
The stock pulls back after the first rally and then goes on another +50% run of the lows. Again, I’ve given method B the high of the move to lock in some more gains and added to method C at the high of the move.
- A – Do Nothing. P&L = £9857
- B – Sell ¼. P&L = £8735
- C – Add ¼. P&L = £10980
Water Intelligence – Adjustment 2
Run The Winner
Now our adjustments are behind us we need to let our winners run. Method A has been practising that from the start. Buying the breakout and holding the full position for the trend. Method B locked in some gains by selling half of the initial position in two adjustments into strength. Method C was happily taking those shares off method B as method C is adding to all his holdings the same way so he can capitalise on the next outlier even though he doesn’t know which stock in his portfolio it could be yet. It might not work out on this trend, but method C is happy to treat all potential outliers equally. The worst case for method C is he gets stopped out for a loss on the last add but still makes money.
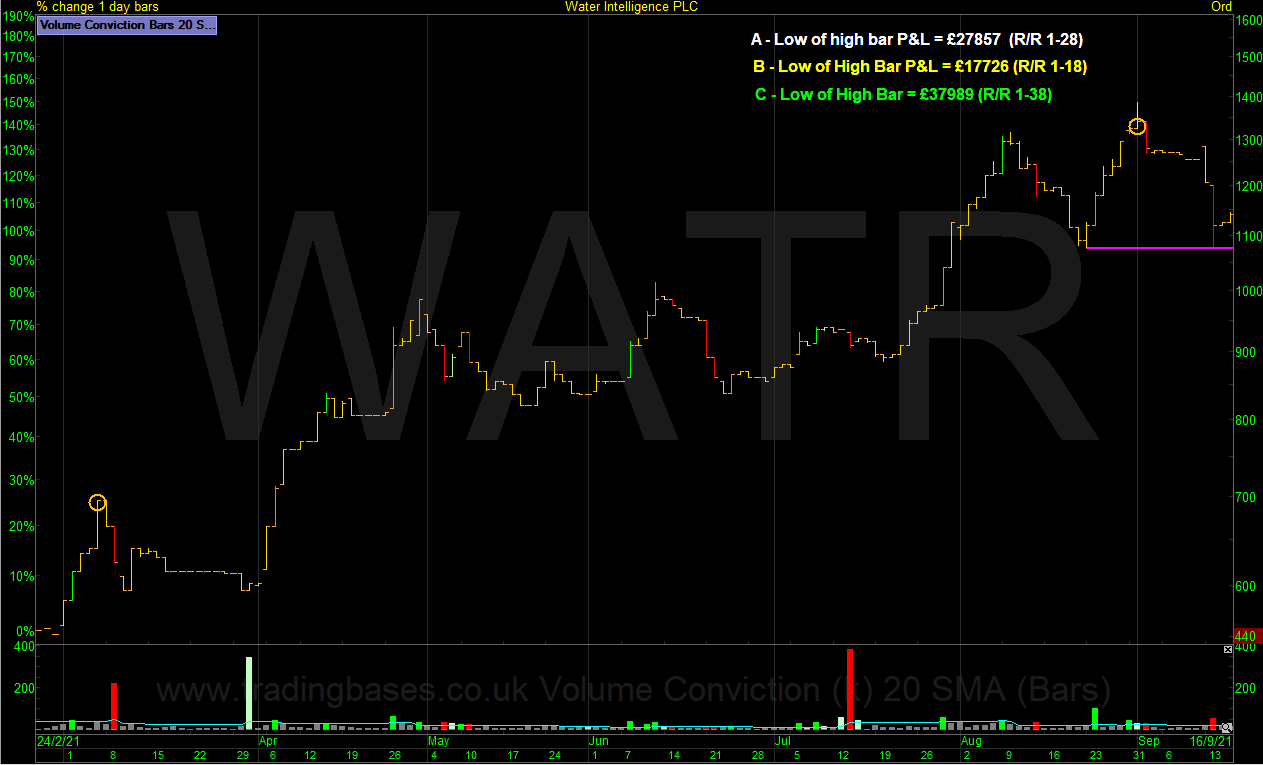
The Available Move
The next calculation involves the crystal ball again, if you were trying to sell into the highs of the move in real-time, but we do have a tool that can help us with the volatility of the big winner. It’s called Risk to Stop. When we trail a stop loss behind a position, we can calculate the risk to stop in pounds, percentages or “R” multiples. Before we stop out of the trade, we already know how much our exit will give back. If the trade starts to suffer from reward to-risk flip where the run-up in price has left the correct stop loss way below and let’s say you have 18R (18 times initial risk) on the table and the correct stop is giving back more than half of that amount, then maybe only Jerry Parker might have the steel to leave that thing alone and let it run its course. At the end of the day, the stubborn trend follower makes the most money. We’re all on a sliding scale of risk tolerance and I’m pretty stubborn with these things myself. Put it in lane and leave it to play out. I sold this one on my stop and I’m happy with that.
- A – Do Nothing. P&L = £27857 Risk to Reward = 1-28 (28R)
- B – Sell ¼. P&L = £17726 Risk to Reward = 1-18 (18R)
- C – Add ¼. P&L = £37989 Risk to Reward = 1-38 (38R)
The difference in these unrealised results is staggering. The buy and hold of A is returning a solid result. The defensive approach from B is actually a double-edged sword as small winners mean you need a higher win rate to outperform. Method C takes the low risk for high reward lane. Initial risk is 1R on all these positions. Reward is 38R, double the return of method B. This is where the money is made. Being concentrated in what is working. Think William O’Neil to Warren Buffett and everyone in between. They are concentrated in their best ideas that are working.
Water Intelligence – Available Move
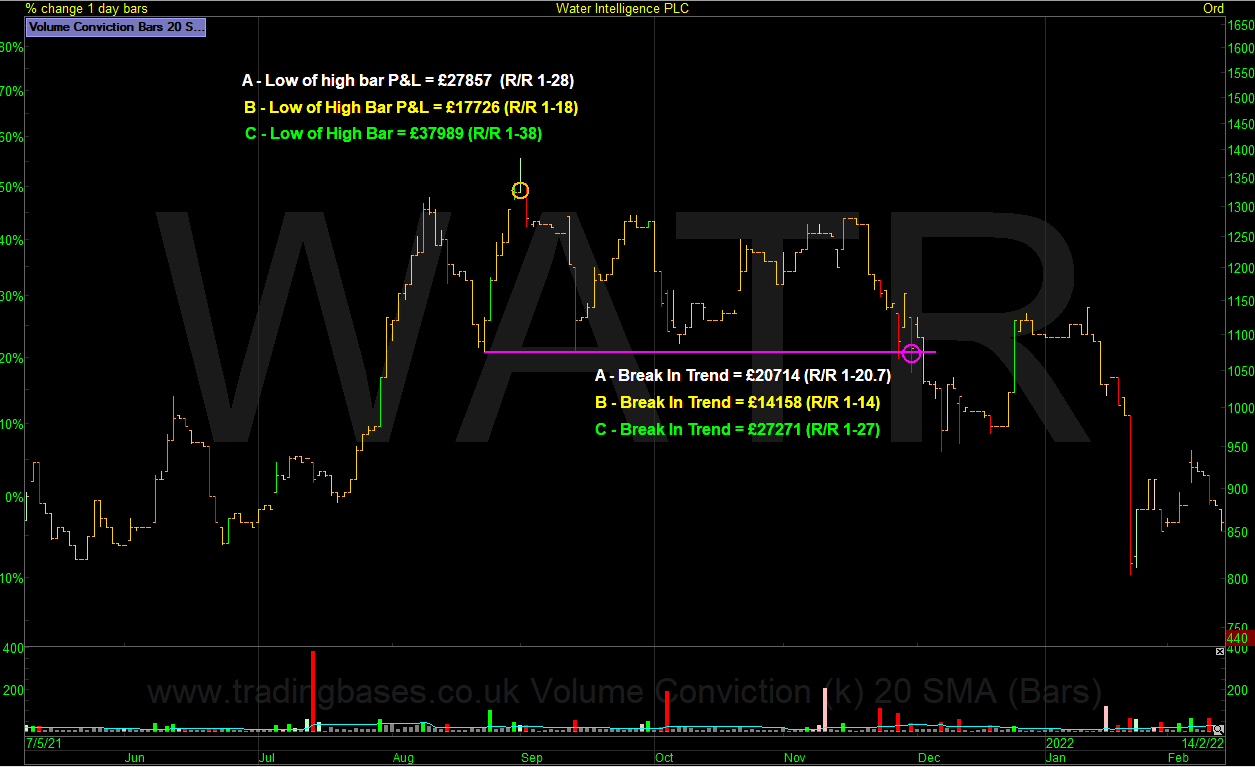
The Risk to Stop and a few thoughts on the total portfolio risk tolerance.
To calculate the current risk to stop for a position just subtract the unrealised profit from the stop loss profit calculation. If the current price is 38R and exit price is 27R as in the example for method C the risk to stop is 11R. You should do that for every position you hold and add them all together to get a total portfolio risk to stop calculation. This will give you valuable data that you can journal with a few notes on how you felt at different portfolio volatility levels. We all have a different volatility tolerance that is built up over time in the markets and the number one problem many new investors suffer from is trading too big and not knowing the risk to stop they are exposed to.
Water Intelligence – The Risk to Stop
Letting the Outliers be Outliers
To catch an outlier, we need to cast our net over a group of stocks and have the patience to let those potential outliers become outliers. Trends take time and many won’t make it but those that do will have a dominant effect on the P&L of the portfolio.
When we’re right we wish we owned more. When we’re wrong, we wish we owned less.
Trading truth.
Taken from the article Trading Psychology Pitfalls of a Systematic Approach.
Big winners are going to be volatile on the account. It’s the best problem to have. It means you rode an outlier. Vol targeting on big winners is not going to destroy your expectancy to the extent that selling or derisking a big trend early in its move would so if I’m going to tamper with a winner then tampering with a historically large winner for my results (an outlier) isn’t going to be a disaster.
No Favourites
Pure trend followers don’t get attached to the individual stock. They treat all stocks like it’s going to be the next big winner. No defending the laggards. No top slicing the leaders. The portion of my portfolio I use for catching the outliers is always focused on the next big trade. I won’t do anything that would affect the next outlier in a negative way. If I’m in a great stock and it’s trending smoothly higher the worst possible thing I could do to affect my long-term equity curve would be to adjust the position early in the move and thus discount the right-hand edge through fear. There will be many speed bumps and landmines on the journey, but more money is left on the table by cutting winner’s early period!
Flipping These Positions (averaging down)
What you do with those stocks that don’t work out will have a big effect on the portfolio so doing the right thing with losses is extremely important. I never want to give my losses the fuel to become large losses. The exact opposite of the winners. Having an exit and sizing for it means all losses are a maximum of -1R and adding to losses will expose the account to exponential losses, rather than the unrealised profit of your winners controlling the volatility of the portfolio it will be controlled by the unchecked losses that were added to. That has a very negative effect on our lives in and out of the market.
Water Intelligence – The Lifecycle of a Trend
Final Note
The methods used in this article are all used in conjunction with a trailing stop. This means that the risk of the position as the stock rises and the position is added to never goes above the initial risk of the position on entry.
Jason Needham
Got some thoughts on this week’s article from Jason? Share these in the SharePad chat. Login to SharePad – click on the chat icon in the top right – select or search for a specific share or the “Traders chat”.
This article is for educational purposes only. It is not a recommendation to buy or sell shares or other investments. Do your own research before buying or selling any investment or seek professional financial advice.


