
Since my last market update in February markets have been consolidating the move off the lows and more recently we have seen the Nasdaq and S&P take on the leadership of a potential new bull market by breaking out of those consolidation bases and onwards through 52 Week highs. The NASDAQ 100 led the charge posting a higher high on 30th March. The NASDAQ composite broke out of a beautiful 3-month base on the 10th of May closely followed by the S&P 500.
Thin Leadership
By the time we start to read about thin leadership the rotation in the markets is usually well under way. There was a 2 month period from the NASDAQ 100 moving out to the thin leadership stats becoming popular news and I don’t think I can recall any bear market ending without it. The wall of worry is the best markets to capture period. That being said I exist at the right-hand edge and trail my risk management behind me at a safe enough distance to limit drawdowns whilst capturing upside. I always have an exit.
Short Term Froth
The AI theme is hot right now. There’s always a theme. A technical look at the US focus stocks should be of interest.
24/1/23 $NVDA broke out of an St1 base. Now +120%
1/2/23 $AMD broke out of an St1 base.
2/2/23 $META posted pro gap.
2/2/23 $MSFT posted a price action reversal.
15/3/23 $META broke out above the pro gap.
20/3/23 $AAPL broke out of an St1 base.
10/5/23 $GOOG broke out of an St1 base.
It’s A Market Of Stocks
The lesson here is if you focus on the stocks from the low-risk pivots you will be existing where reward to risk is found. If you’re focusing on the AI theme now because it’s popular there could be a bumpy road ahead. This quarter’s winners left the station in Q1. Patience is needed for the stocks to setup new buyable pivots. Time or price. Time to build bases or price to give pullback entries. Yes, they could melt up further but my point is the last entries are behind us now.
Where Has the Action Been?
Large caps being higher in the risk fountain did find interest first though we have seen rotation out of those names, especially in the UK large caps. My own trend model has seen a sharp pullback in the UK 350 stocks. There’s a basket of UK small cap growth names starting to work well and trade very orderly and that’s my area so it’s good to see some interest flowing back into the risk assets but it’s early days. If the market can continue to behave the stocks will line up and emerge over time.
Short and medium-term timeframes are rising on most markets though longer primary trends are actually still falling on many. That will change through time if we hold the reversals.
Current 200-day (10 Month) Trends At Time Of Writing.
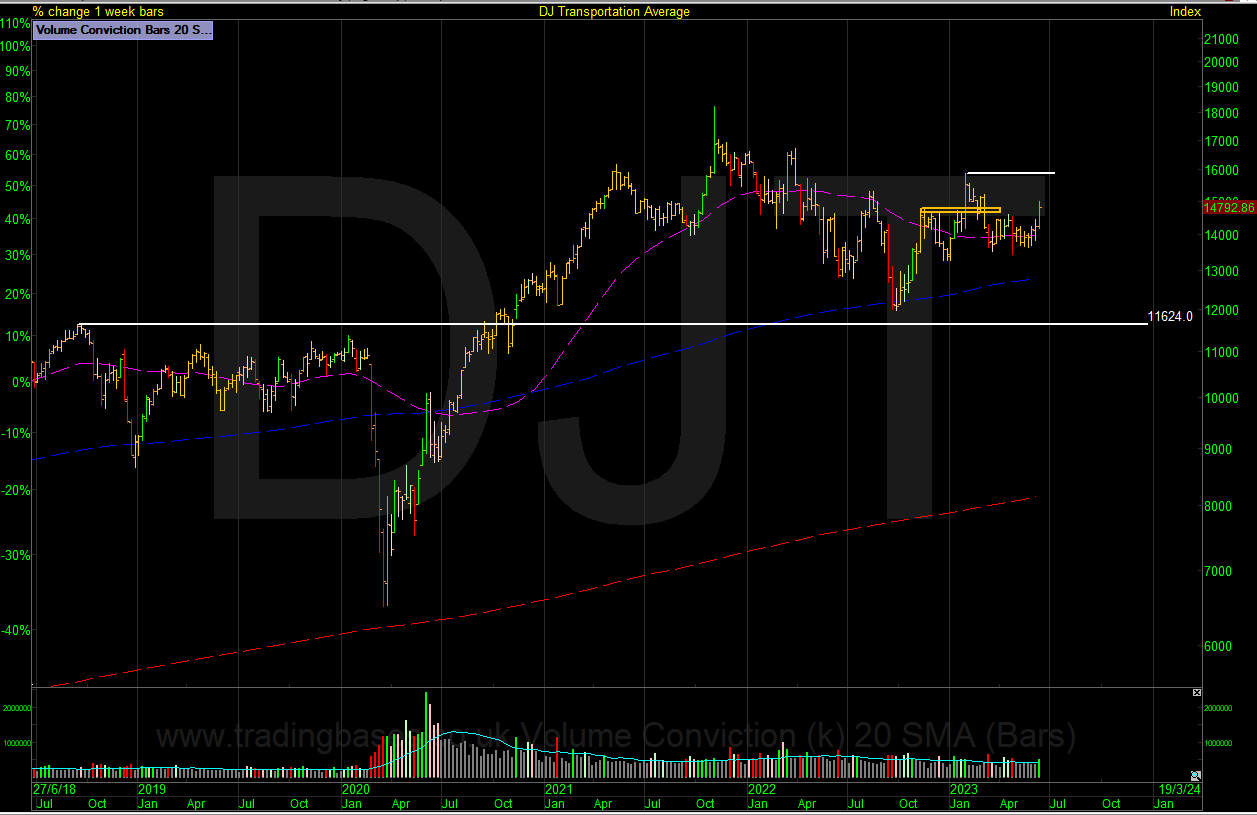
Transports – Rising
Dow – Rising
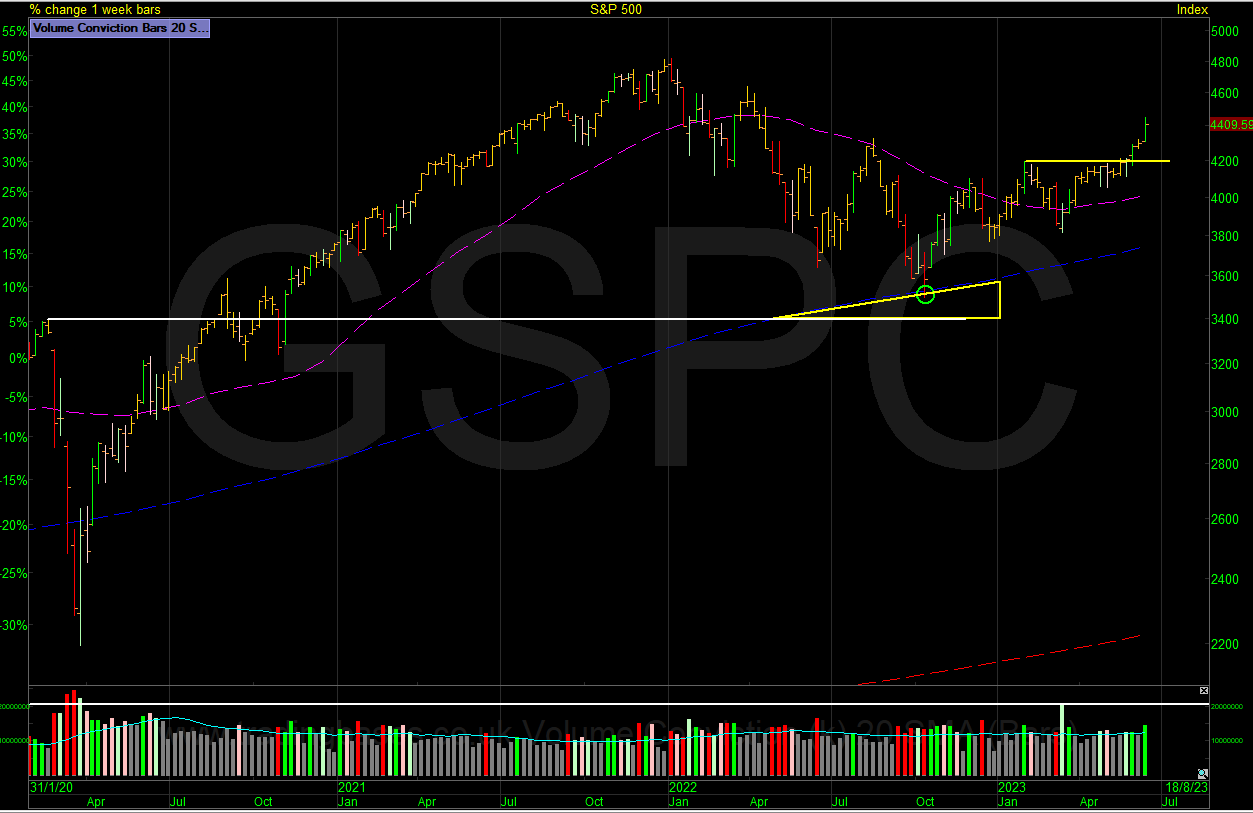
S&P – Rising
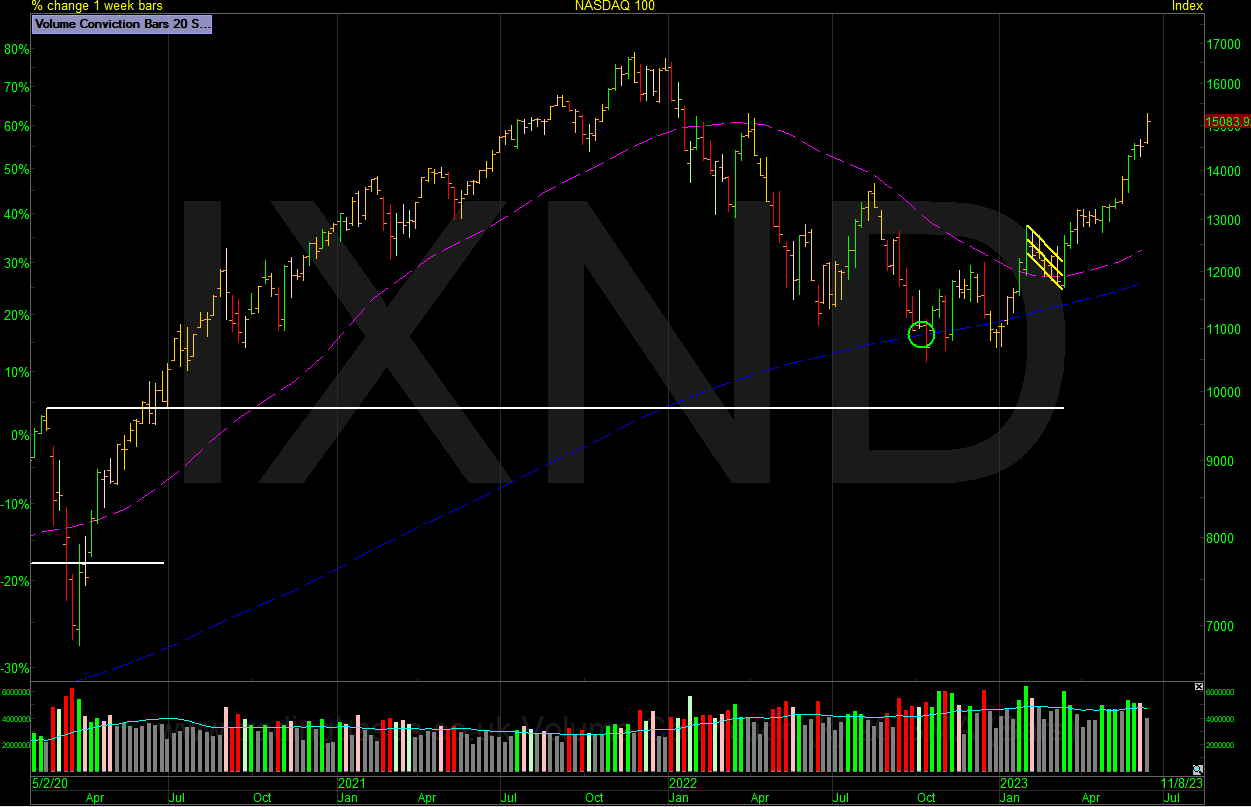
Nasdaq – Rising
Russell – Rising
Dax – Rising
FTSE 100 – Rising
FTSE 250 – Falling
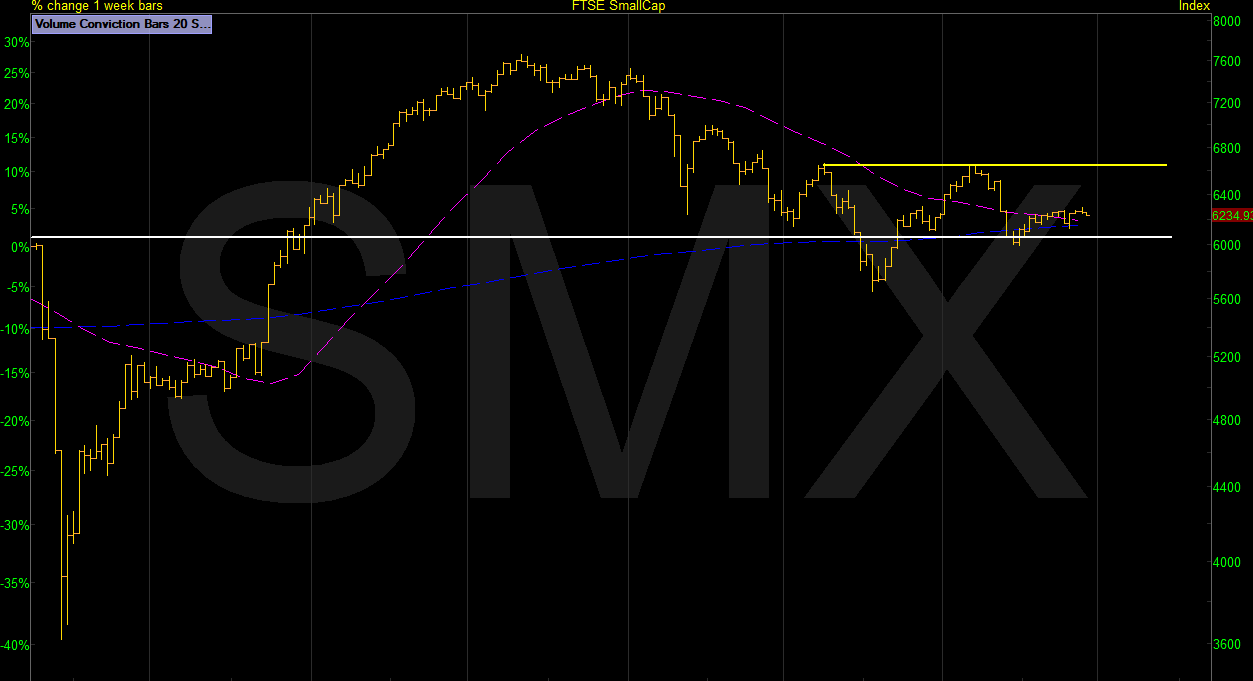
SMX – Falling
The US markets are all rising. The Russell being the last to regain the trend. Only the FTSE250 and the SMX UK Smallcaps are falling still. As I said its early days but we have green shoots in the small-caps and my job is to buy the low-risk pivot in the best stocks so the leaders should be visible before the market confirms.
Big Picture Levels Recap
The charts below have the 10-month moving average in purple, the 50-month moving average in blue and the 200-month moving average in red. Zoom those charts out to see the forest before the trees.
DJT Transports Still trading In Range
DJI Dow Jones has a nice base and is close to the breakout pivot.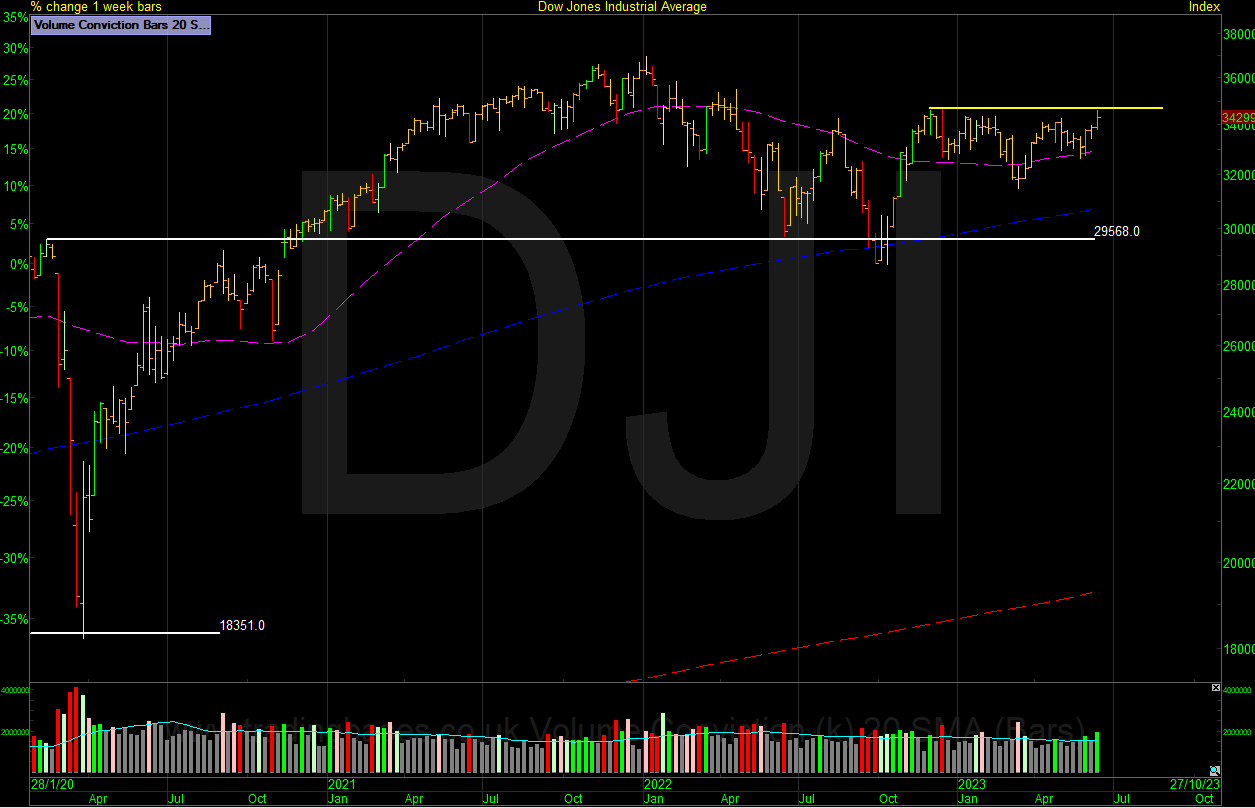
S&P 500 Base Breakout. A pullback would be normal at some point to the base or maybe to a dynamic trend. The 100-day moving average would be my first area.
IXND NSDAQ 100 Leading Higher. As with the S&P a normal pullback would be to the 100dma.
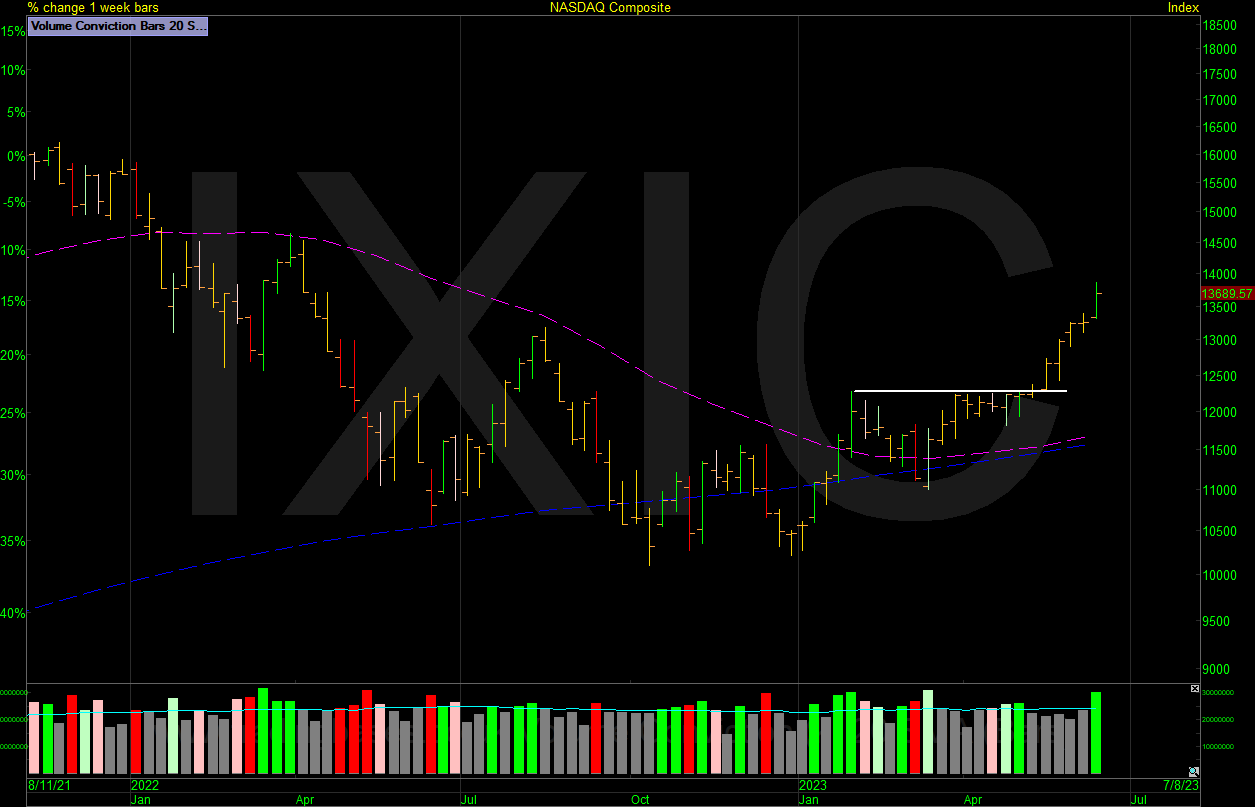
IXIC NASDAQ Composite Base Breakout & Trending Higher. Normar retrace area would be the 100dma. This is for the leading markets. Always focus on the leaders.
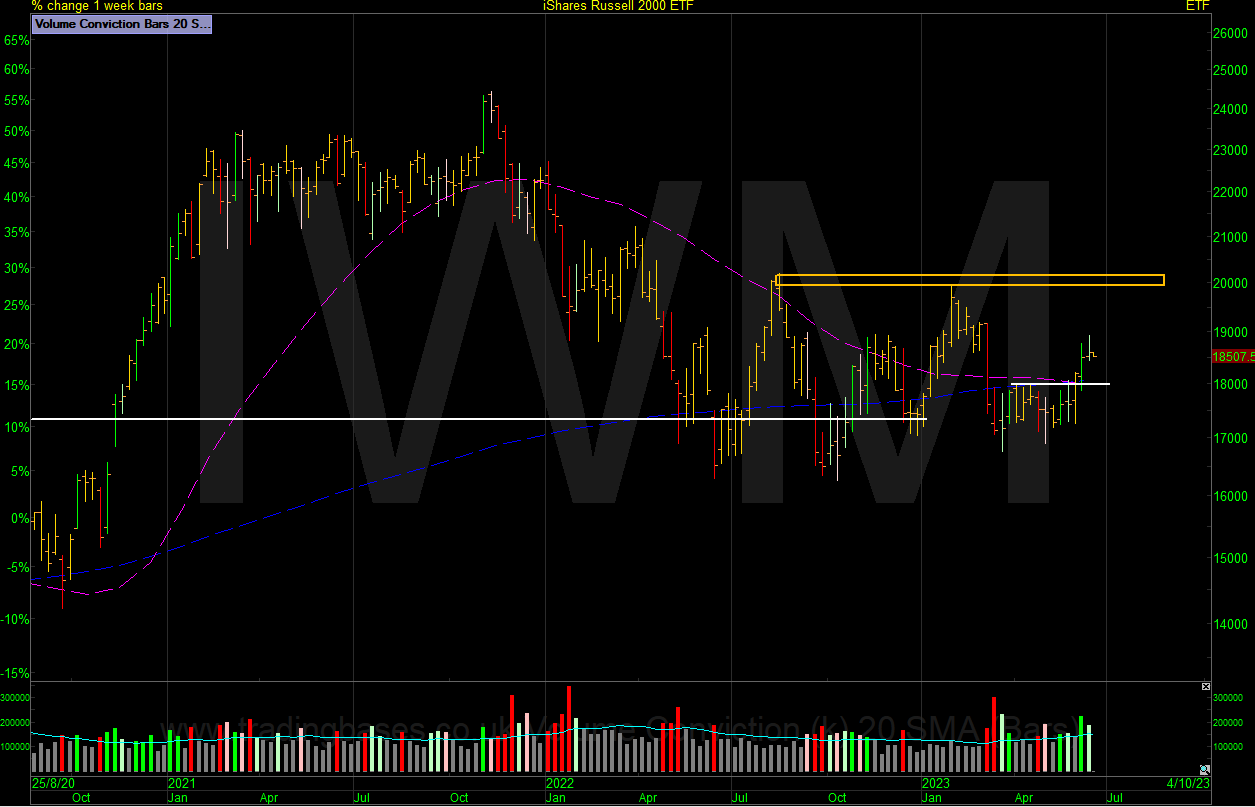
IWM RUSSELL 2000 Basing Out.
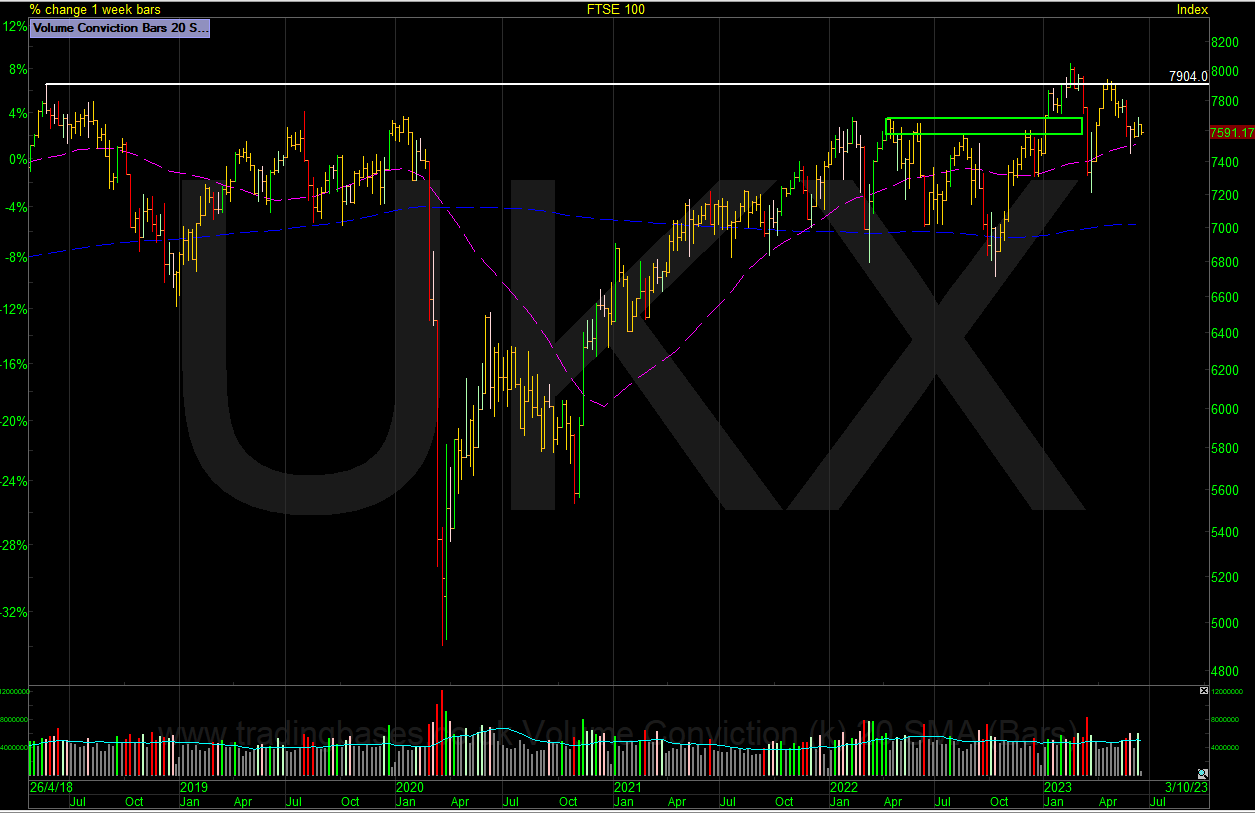
FTSE 100 Traded New Highs & Is Now In A New Range
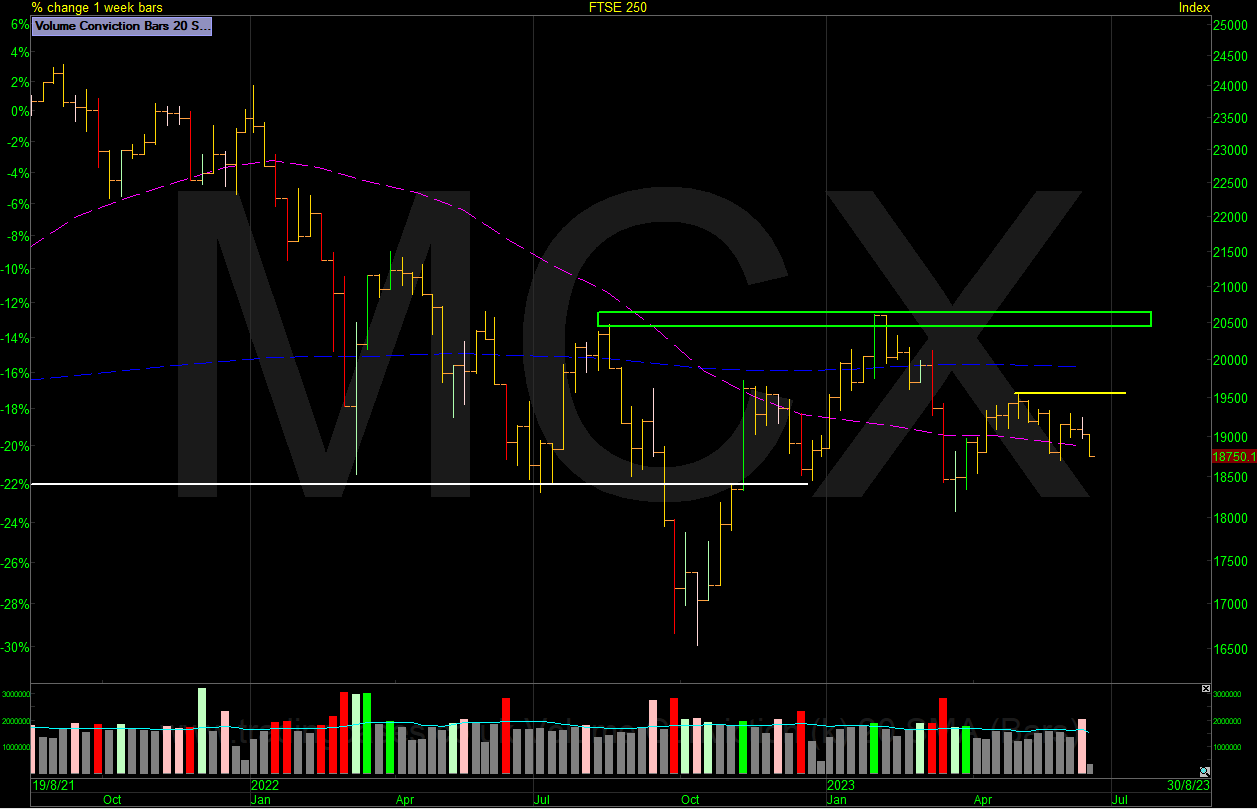
FTSE 250 Basing Out
FTSE Smallcaps Basing Out
Other Constructive Charts Of Interest
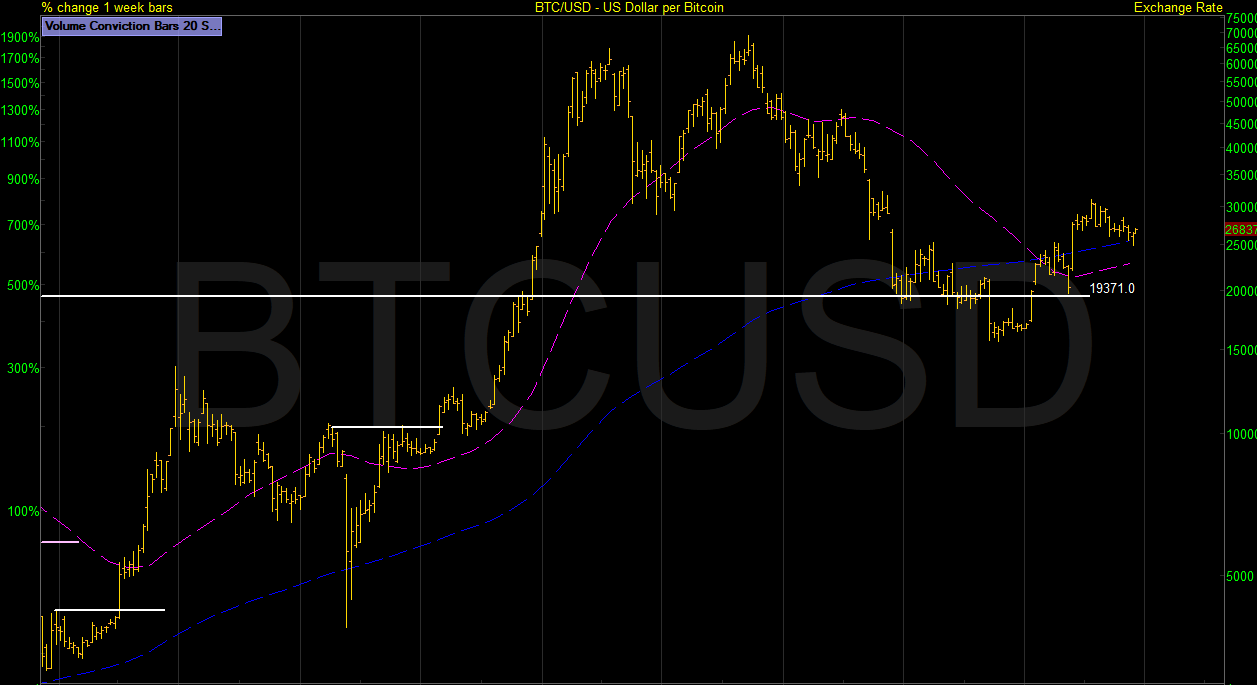
BTC/USD in a rising channel. Would prefer to see a base.
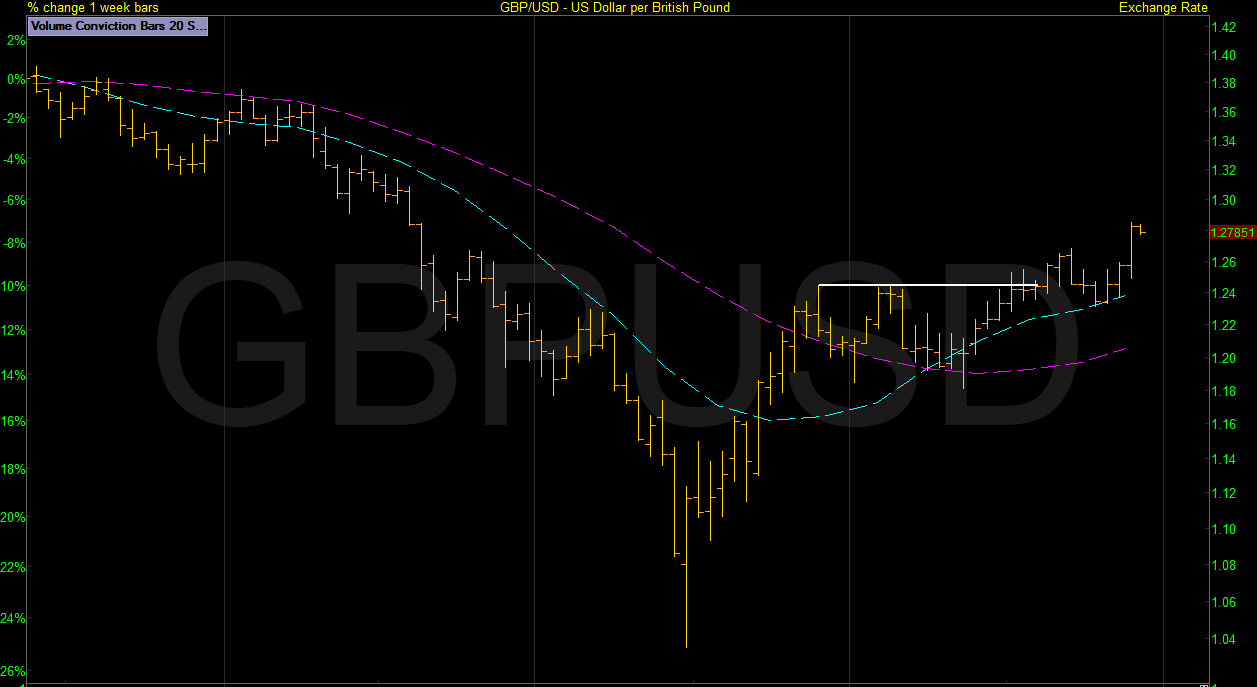
GBP/USD Emerging from an St1 Base
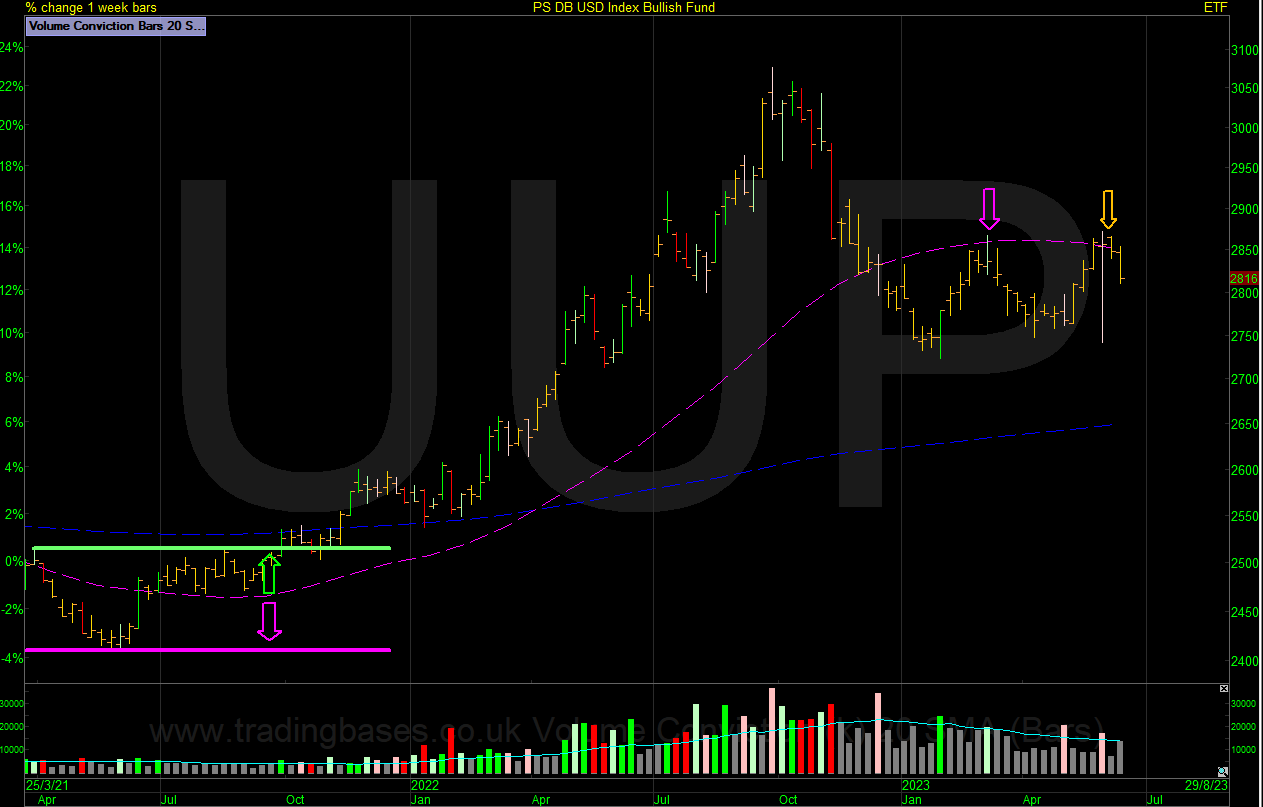
UUP Finding resistance at the falling 10 Month average.
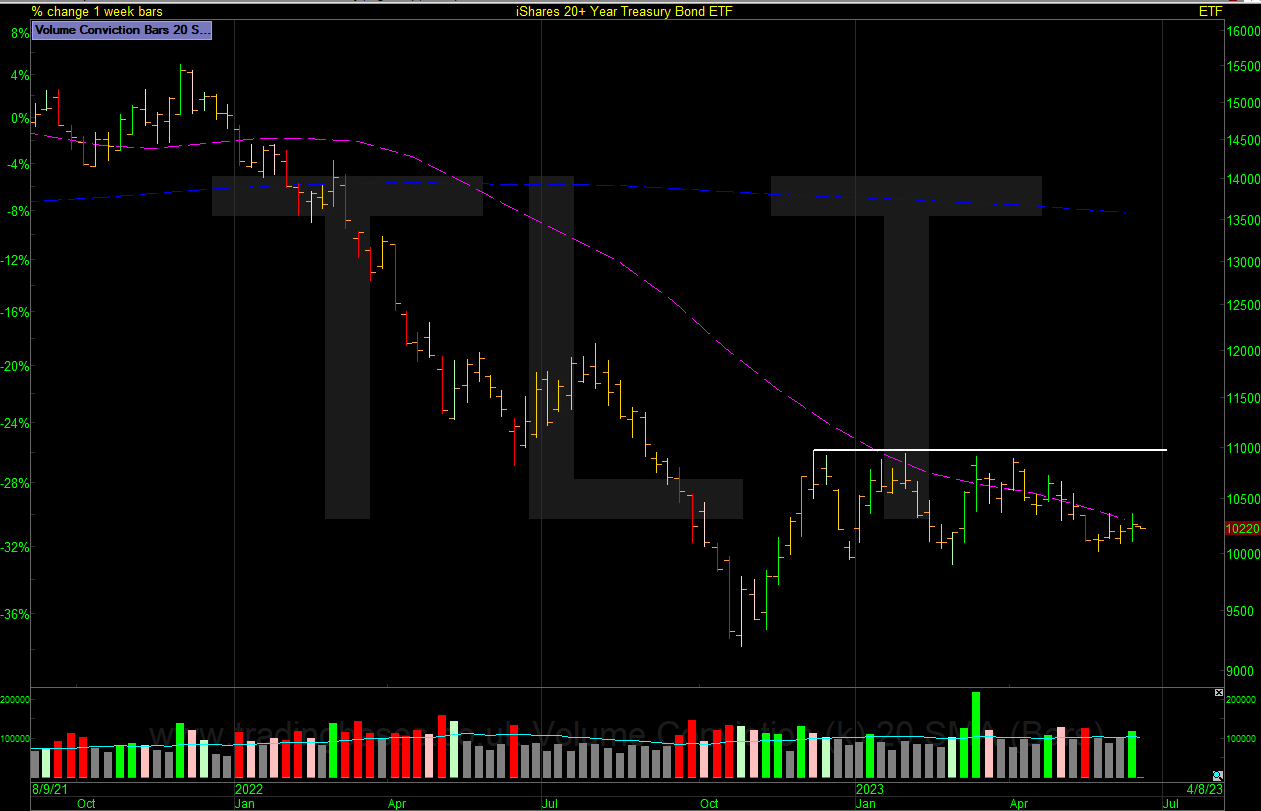
TLT 20 Still basing out.
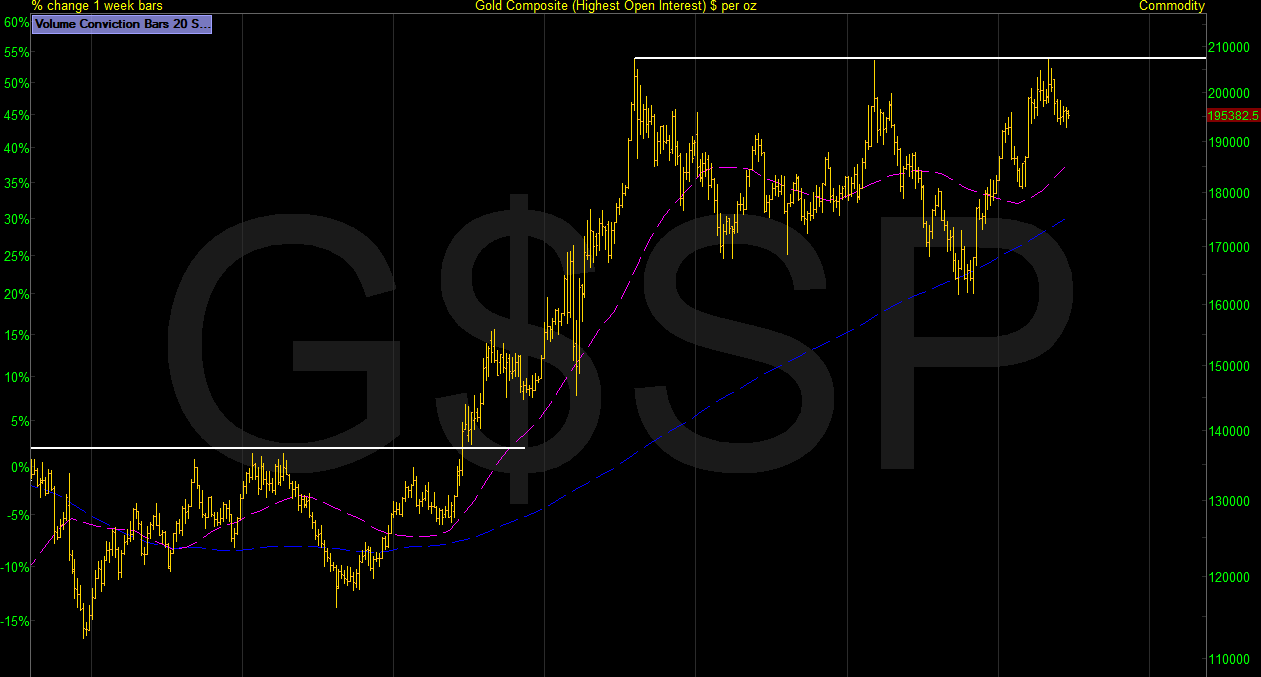
GOLD In a large base finding resistance at multi year high’s so look for higher lows.
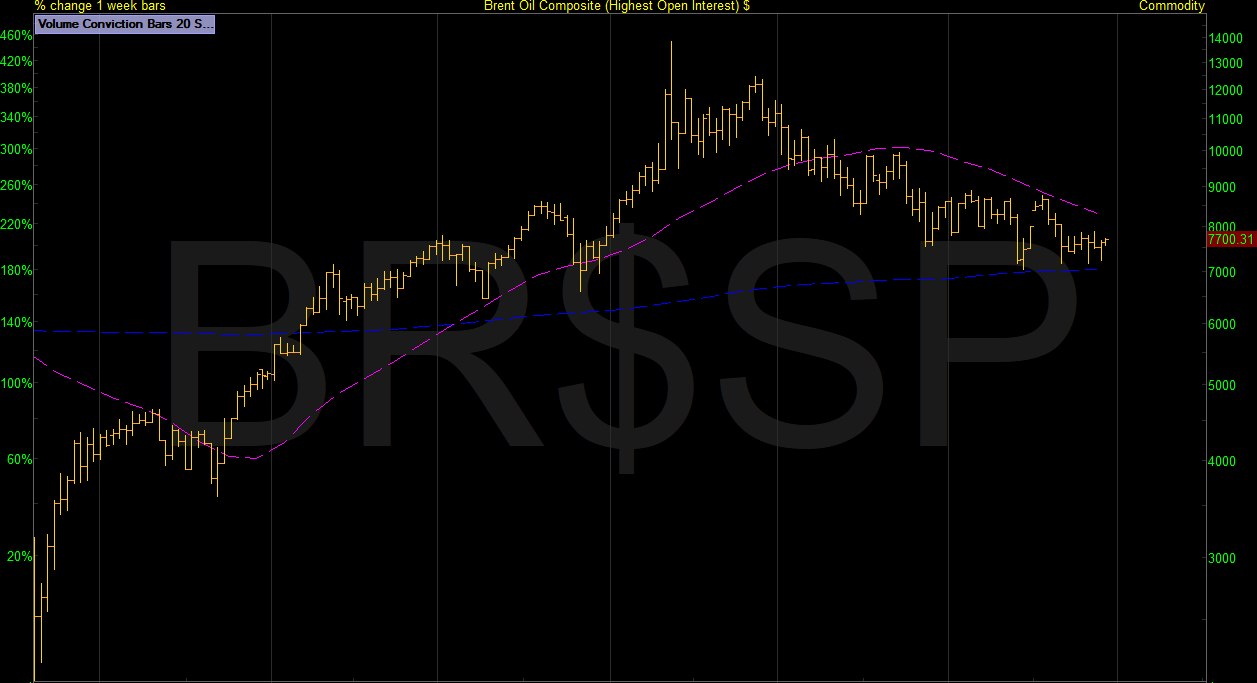
OIL BRENT on the ledge supported by the 50 Month.
Finally – Trade What You See.
The action for me is in growth stocks setting up. It’s clear which markets are in focus from these charts the end-of-day screening sessions I run daily also tell the same story. I’ve not seen oil or gold stocks in a long time even when the oil and gold prices popped. If it was in play I would see the stocks. That’s a lesson learnt over time. Always be one step ahead of the current theme and see what is moving into buyable uptrends with your own eyes. Trust your own eyes. They will see the next leader whether you believe it or not and a long time before it turns into theme.
Jase
Got some thoughts on this week’s article from Jason? Share these in the SharePad chat. Login to SharePad – click on the chat icon in the top right – select or search for a specific share or the “Traders chat”.
This article is for educational purposes only. It is not a recommendation to buy or sell shares or other investments. Do your own research before buying or selling any investment or seek professional financial advice.


