
It’s been around nine months since I did my last market update and in this article, I’m going to follow on from that last update and point out some interesting levels worth noting.
Many markets are sat above their 10-month moving averages [200 day] which is in itself good to see as we’ve had a strong move off the lows but I’m going to dig a little bit deeper into that move with the view to a possible consolidation ahead and what to expect.
Markets Consolidate Through Time or Price
A rising market needs to consolidate, this can happen through a volatile or drawn-out pullback or it can go the preferred route, trading sideways in a range. We have no guarantee that the bottom is actually in but by looking at multiple markets we’re able to build a case based on the primary trend and not get caught up in short-term secondary trend. Primary first, secondary later.
Where Has the Action Been?
Large caps being higher in the risk fountain usually find interest first and this has definitely been the case since the S&P landed in the zone we noted last year in Tuning Out The Noise, Big Picture Levels. The FTSE100 obviously benefits from sectors in play and has been the strongest market I follow throughout the bear leg. Smallcaps, where the best trends tend to be found, are lower on the risk fountain but there are enough to keep me happy until we get a clearer view of the overall primary trend.
The Primary Trend
When it comes to the primary trend of the stock market on my own personal time frame the 10-month [200 day] is actually a little fast for my own models but the key when using a moving average as measurements of trend is to determine if the average is rising or falling.
Current 200-day (10 Month) Trends At Time Of Writing.
Transports – Rising
Dow – Rising
S&P – Falling
Nasdaq – Falling
Russell – Rising
Dax – Rising
FTSE 100 – Rising
FTSE 250 – Falling
SMX – Falling
That simple check tells us into this strong move higher five markets are up on the 200-day timeframe. Any digestion of the move will result in deterioration of the trend. Price being above the 200-day average doesn’t give us that much confidence if the 200-day is falling. More time is needed and a clearer playing field will reveal itself when we finally see digestion through time or price.
Big Picture Levels Recap
The charts below have the 10-month moving average in purple, the 50-month moving average in blue and the 200-month moving average in red.
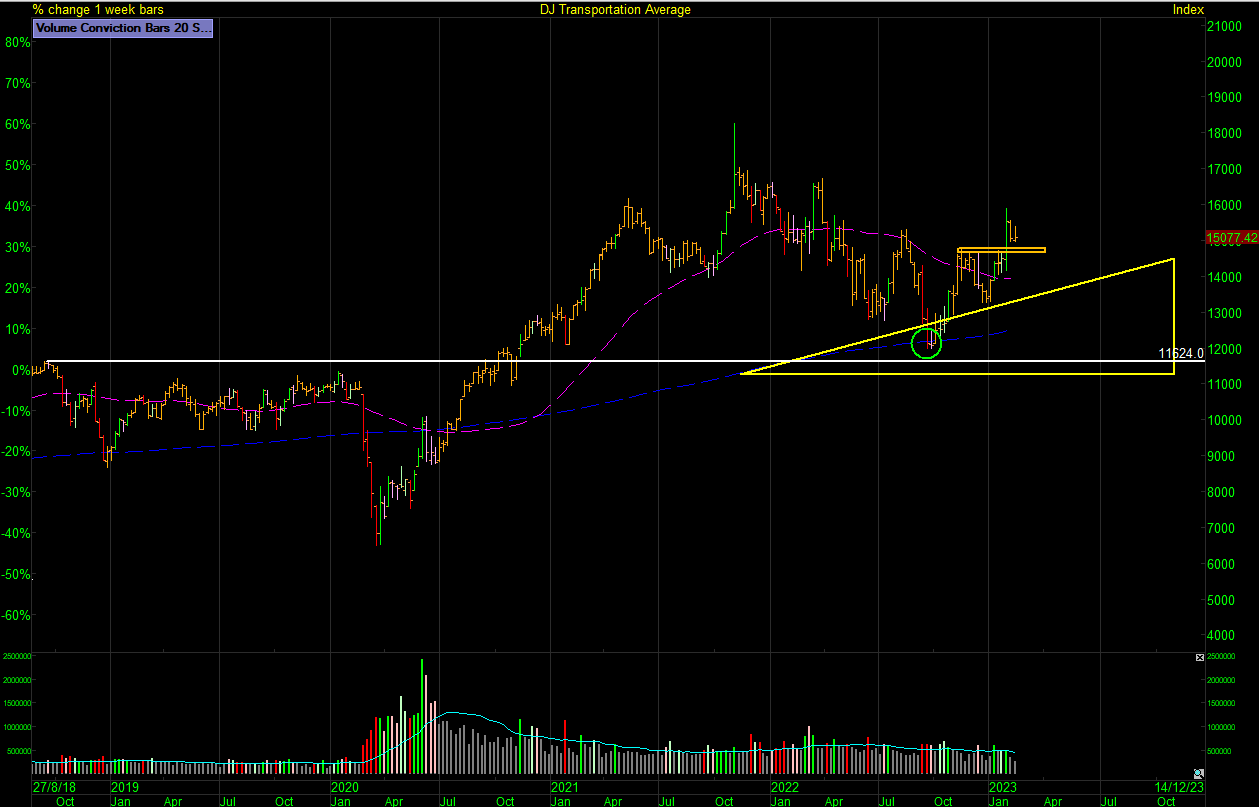
DJT Transports Level of Interest
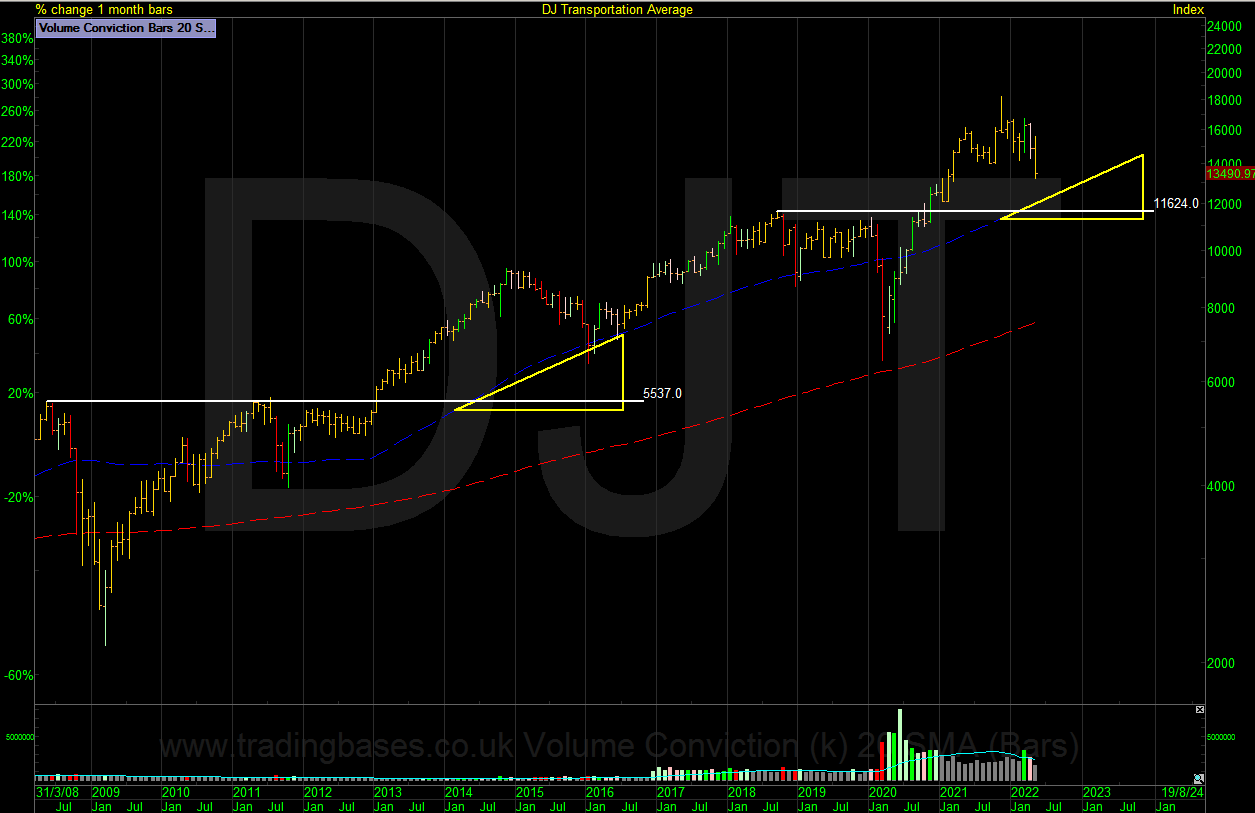
DJT Transports Visits Level of Interest 23-9-22
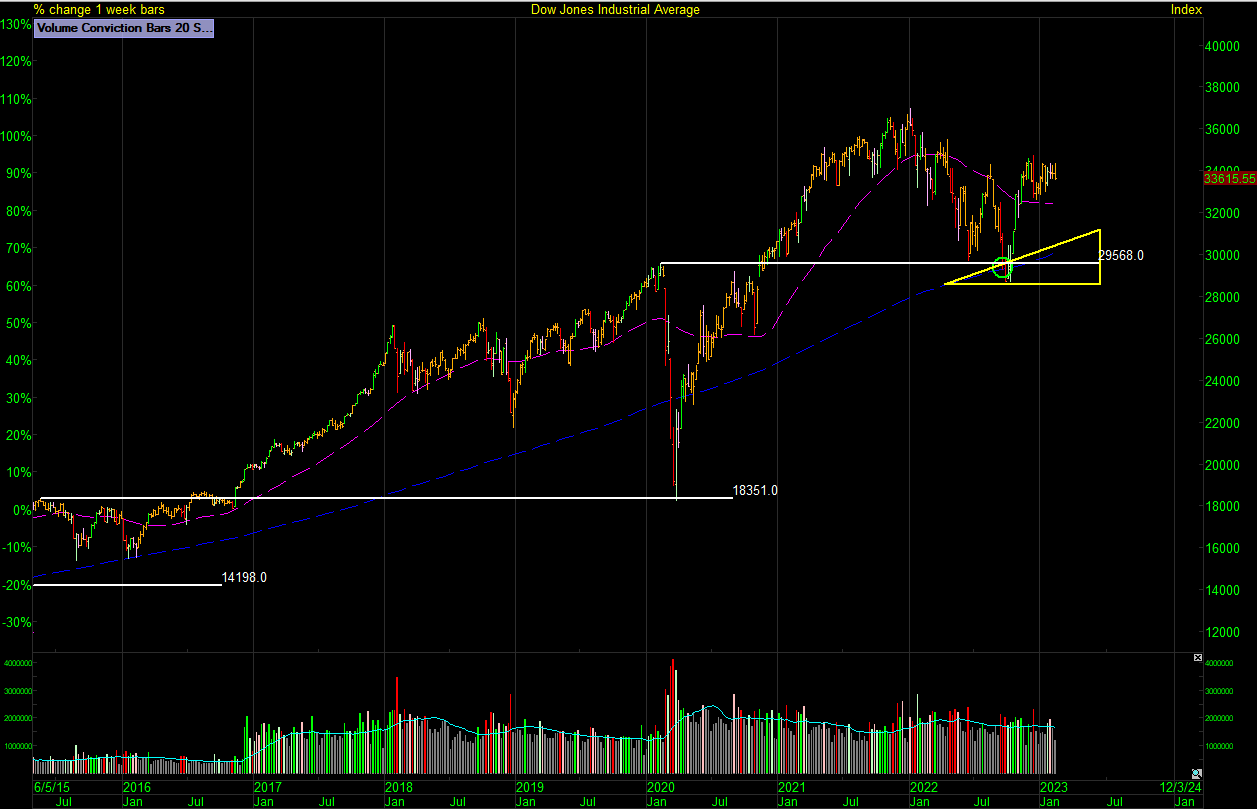
DJI Dow Jones

DJI Dow Jones Visits Level of Interest 23-9-22
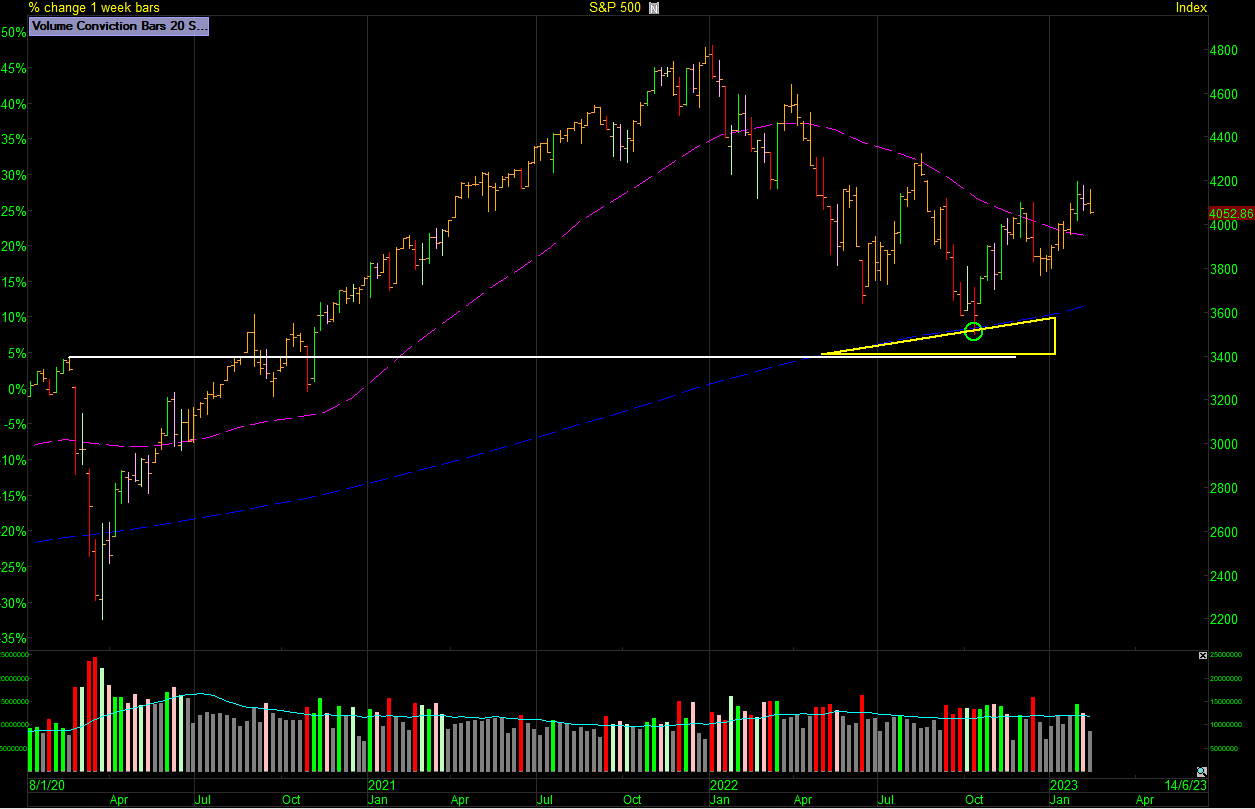
S&P 500
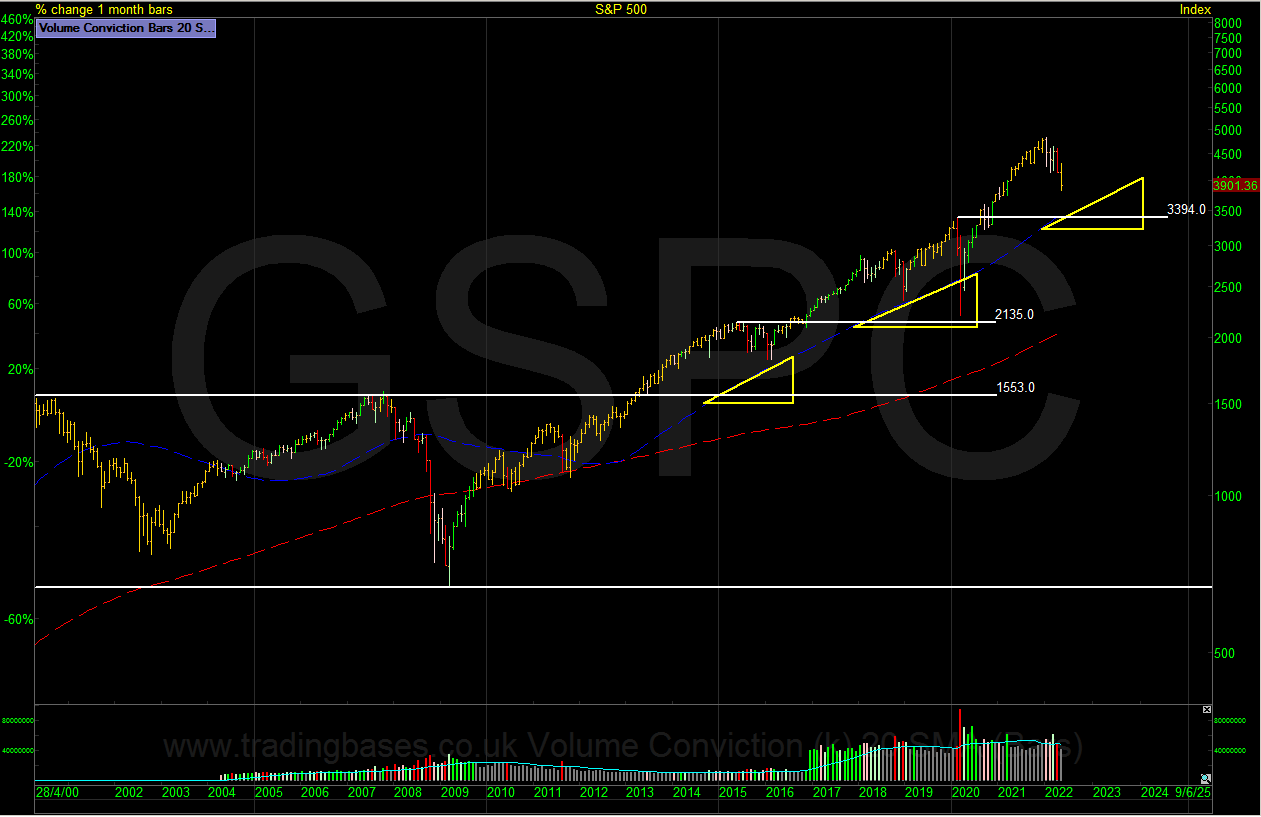
S&P 500 Visits Level of Interest 13-10-22
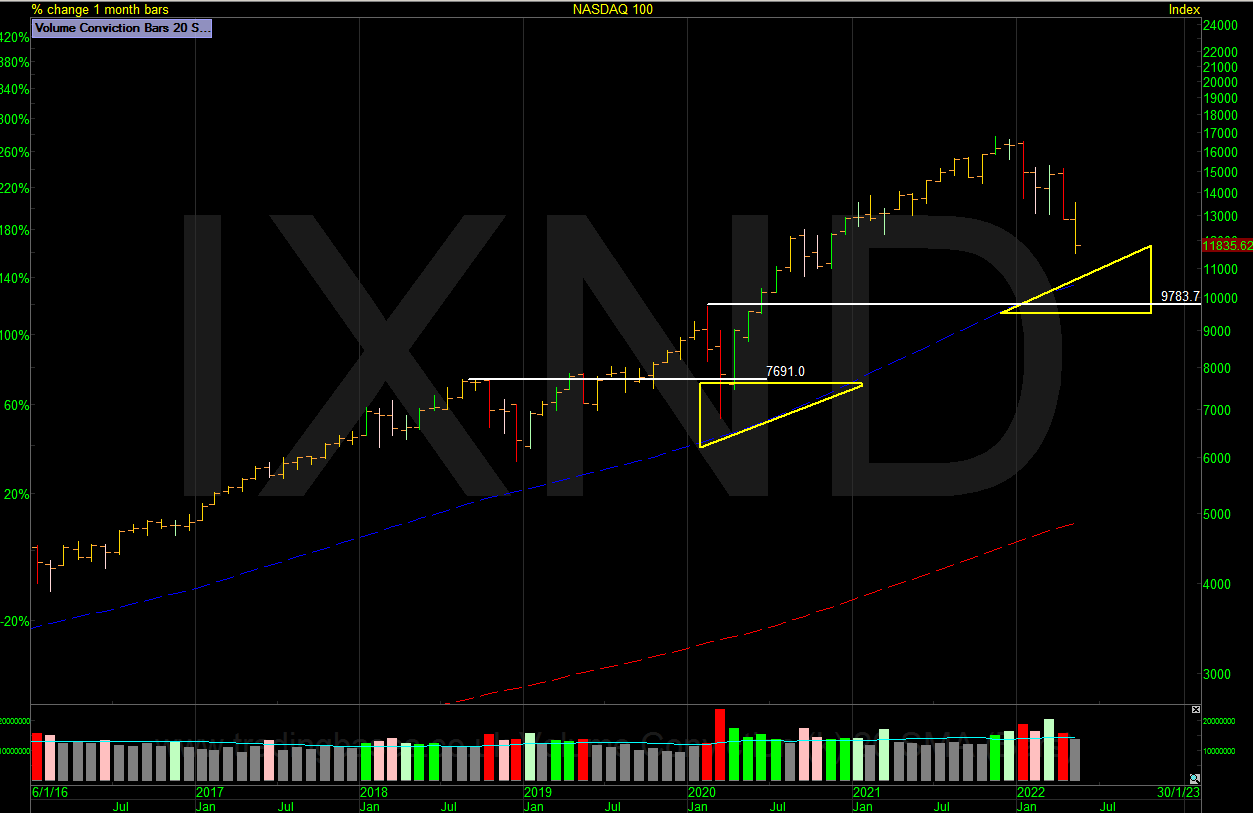
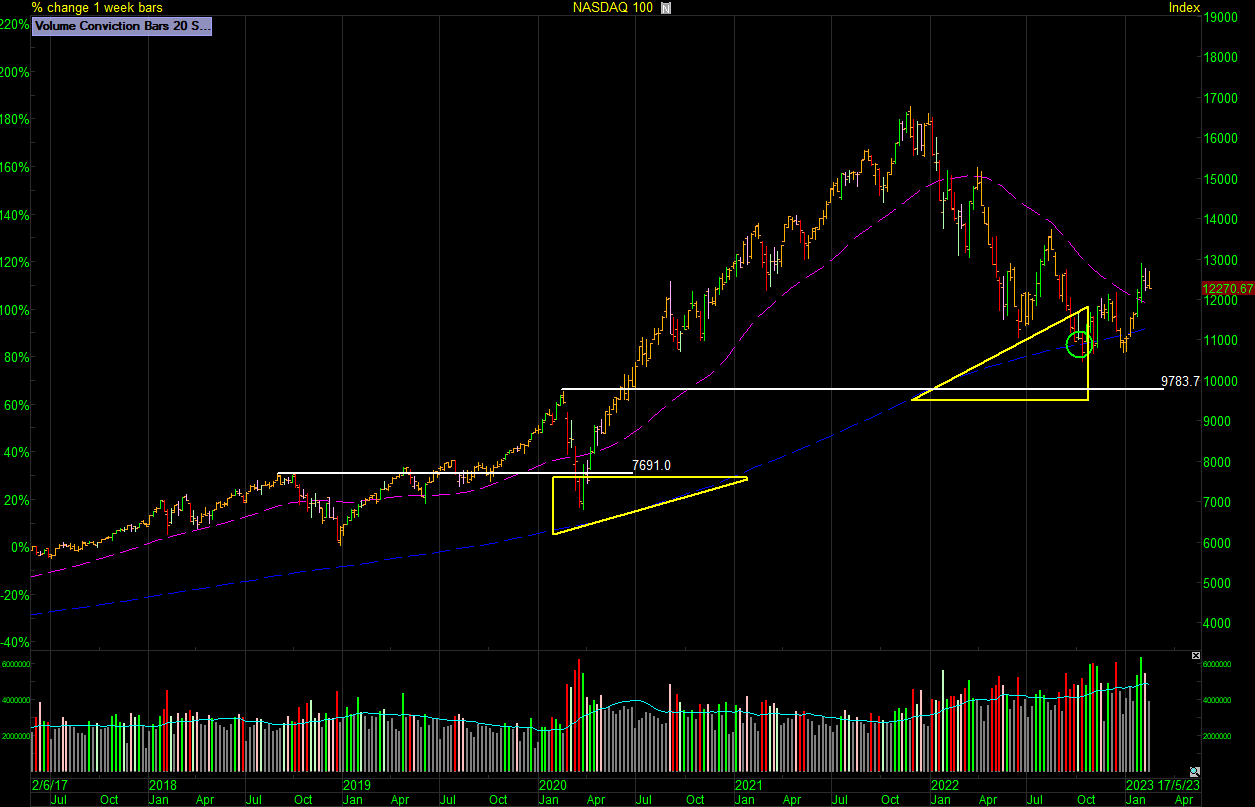
IXND NASDAQ 100 Visits Level of Interest 10-10-22
When The Leading Market Lands
As I noted in tuning out of the day-to-day noise big picture levels article usually the S&P or NASDAQ are the last to hit the pullback zones of interest. strongest markets should hold relative strength over weaker small-cap markets when the markets are in correction. This is not an exact science but as usual, the S&P 500 and the NASDAQ 100 hit the pullback areas last. You will also notice there was an aggressive bear rally prior to these leading markets coming down into those big picture levels this bear rally was on extremely low volume and had all the signs it would fizzle out. This was more visible on my daily volume leaders screen I run every morning. The current move off the lows was actually on good volume and added weight to the bull case.
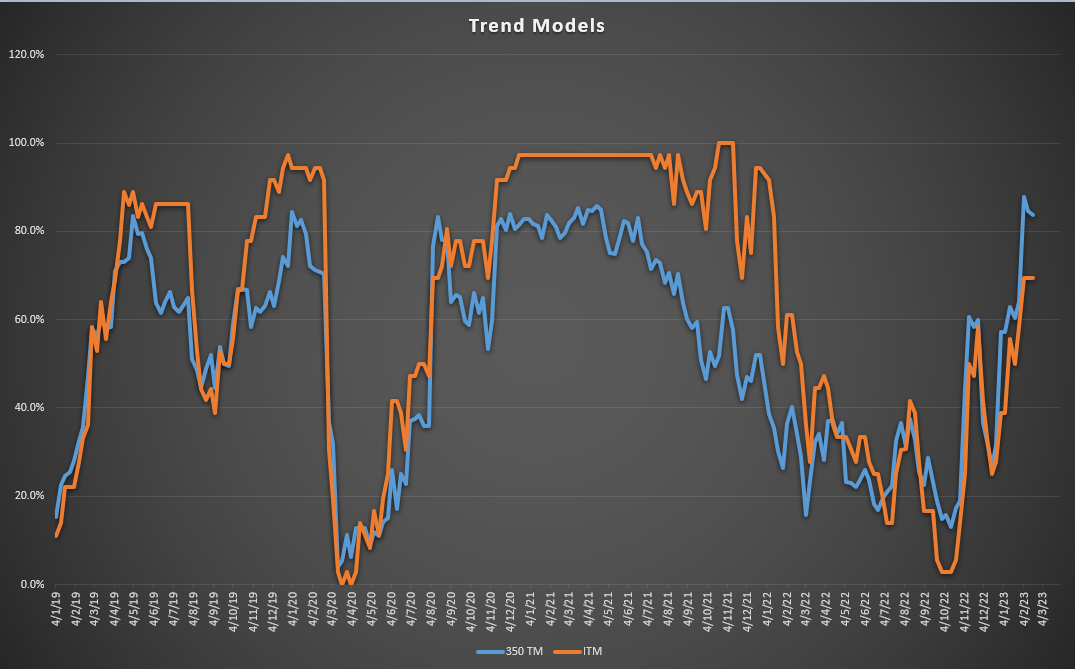
Trend Models
I have manually run my own personal trend models with the help of a couple of Sharescope screens for over a decade now and it makes for a good visual of the bear market action. The bear rally that started near the end of June rolled over in August and the current low was posted in October. There was a noticeable divergence with the ITM (Index Trend Model) posting lows last seen during the pandemic but the 350TM holding strong. You will also see the stocks leading the market into the bear leg in the summer of 21. It’s a market of stocks being my key point.
Where Next For The Markets?
Every day is one day closer to the next bull market and we’re a year into this bear leg so things are starting to get interesting. We know the market needs consolidation and how that plays out is my number one focus right now. Blinkers on and avoid the FOMO. Markets need to hold the lows though one market does not make a trend so we need to keep track of the leading markets and also look for constructive stock action. There are plenty of breakouts to monitor and we want to see how they act as they consolidate. For my own style, progressive exposure and only building on success is key during the coming months. The market will pull me in or it will crumble and the whole cycle will repeat again sometime in the future.
I’ve added a few other interesting charts below as they are showing constructive action compared to the relentless trends that have been in place. Hope this helps.
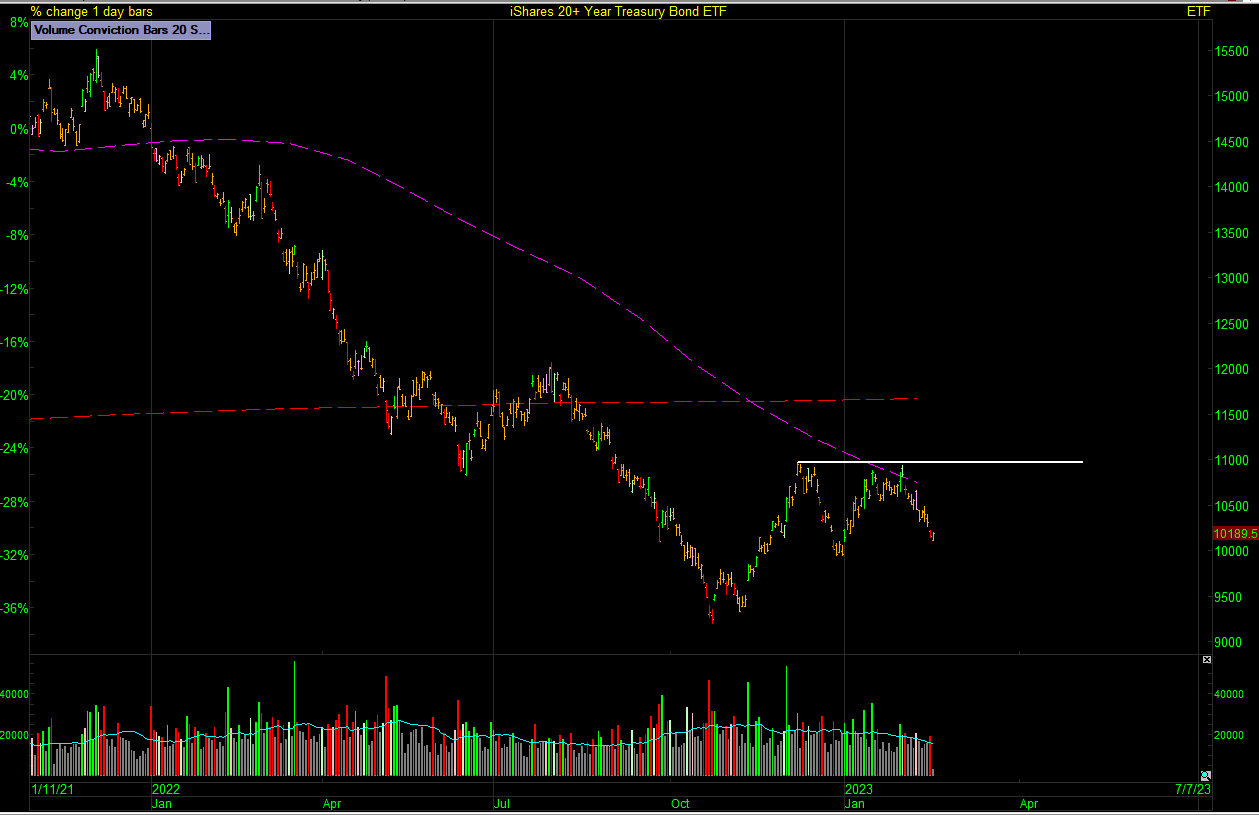
TLT 20 Year is trying to base
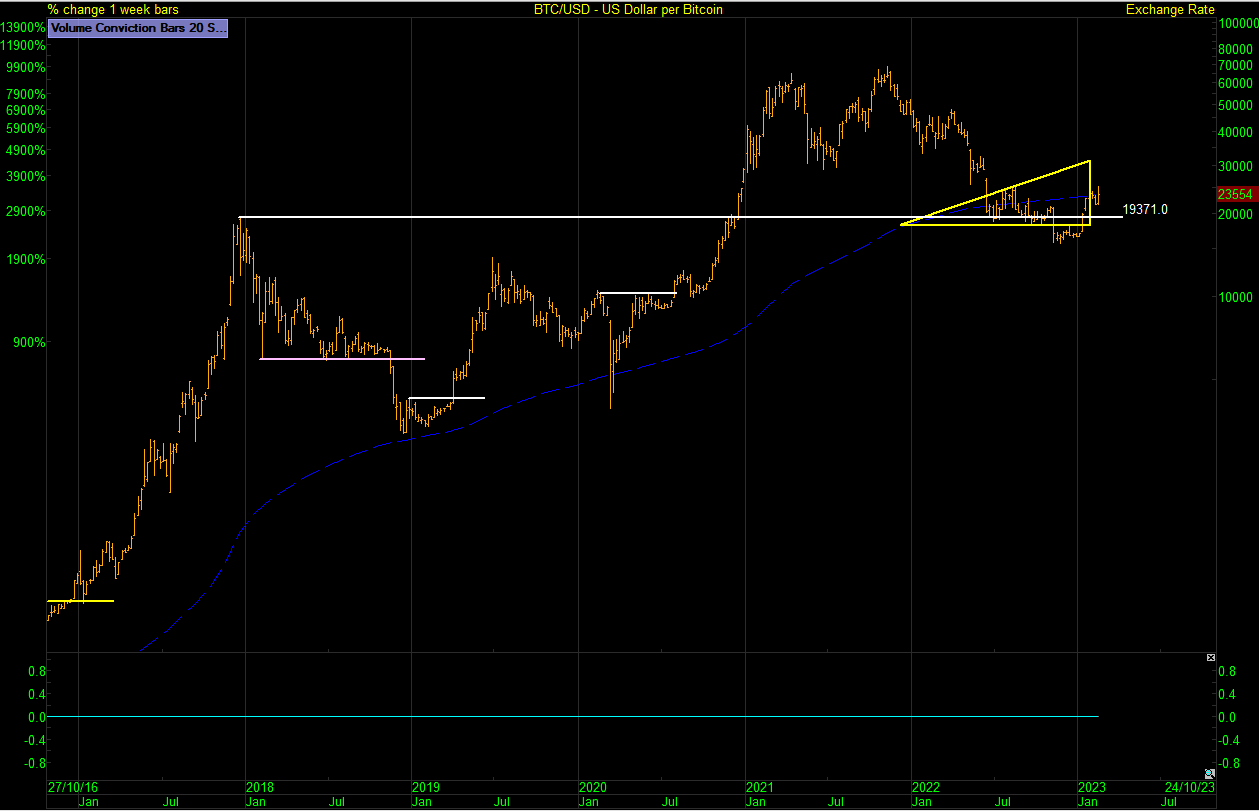
BTC/USD Bitcoin Levels Of Interest
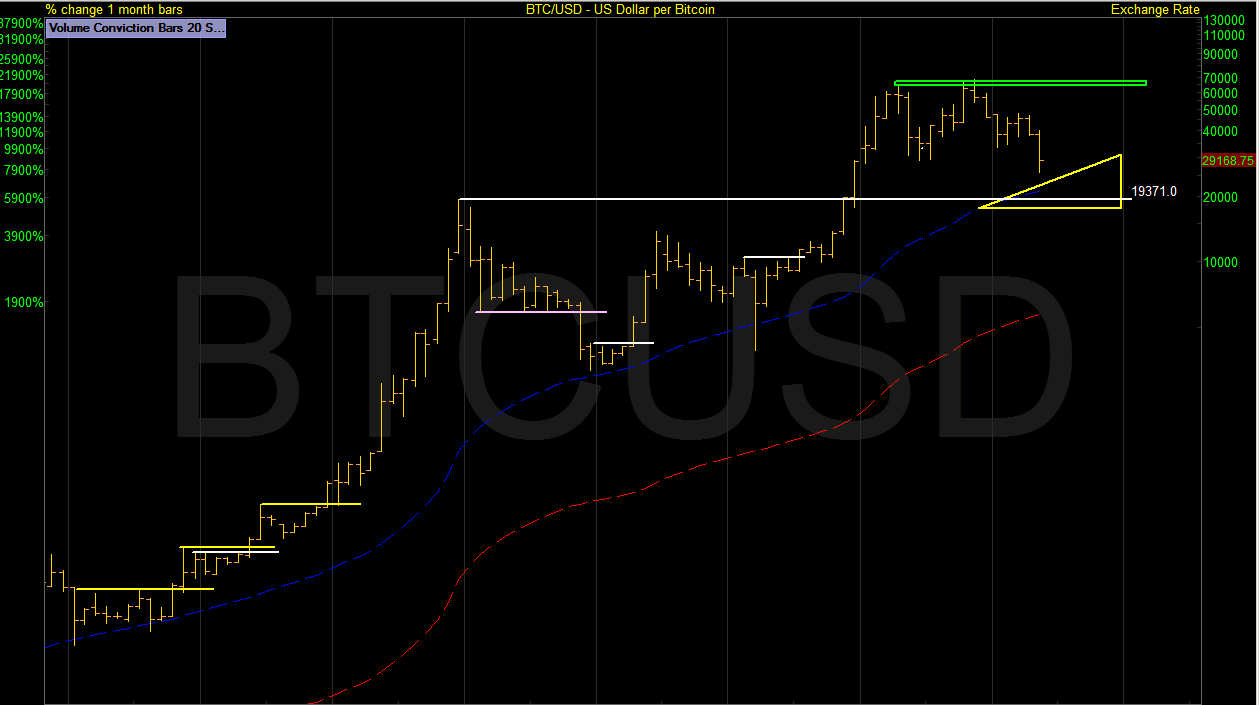
BTC/USD Bitcoin Visits Level of Interest – Basing Action Would Be Welcome
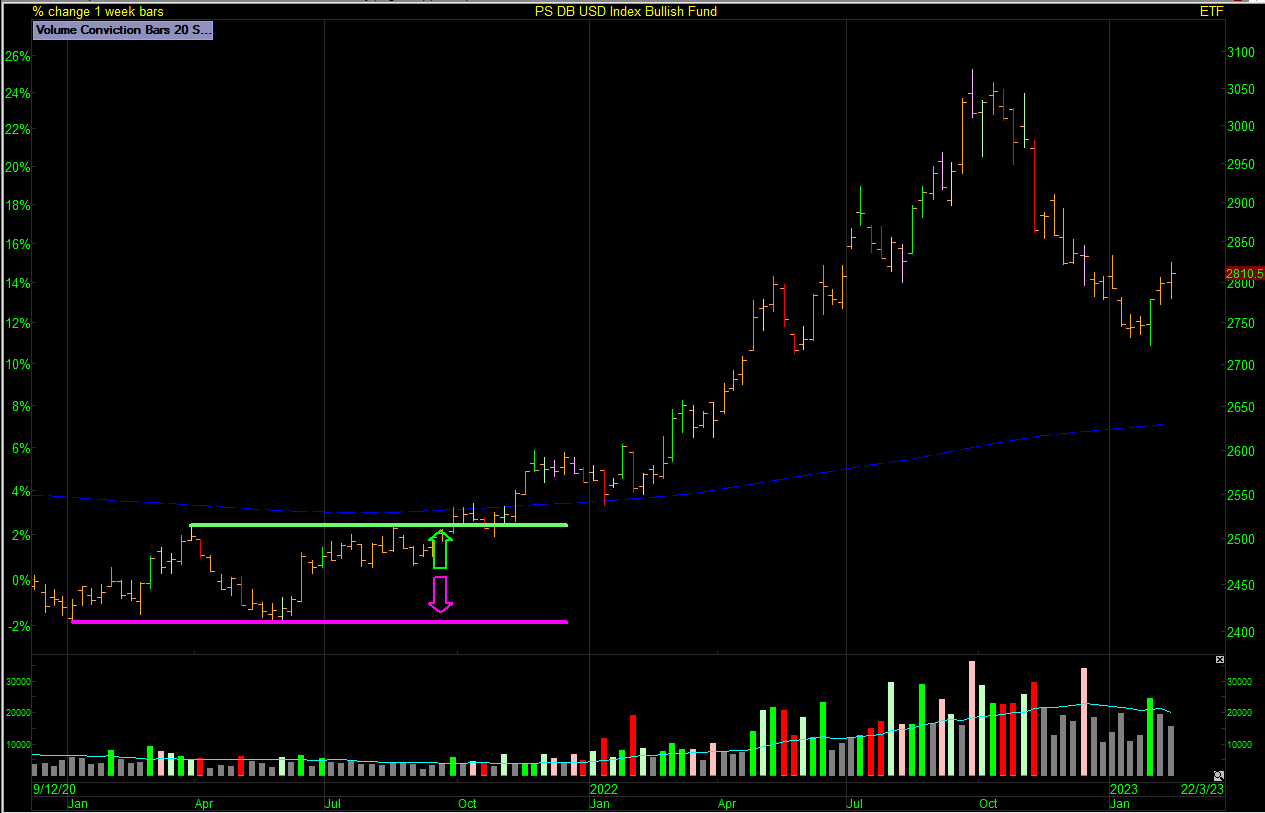
UUP – USD Index had a short rest then made two strong moves higher before rolling over.
Jason Needham
Got some thoughts on this week’s article from Jason? Share these in the SharePad chat. Login to SharePad – click on the chat icon in the top right – select or search for a specific share or the “Traders chat”.
This article is for educational purposes only. It is not a recommendation to buy or sell shares or other investments. Do your own research before buying or selling any investment or seek professional financial advice.


