Michael looks at three features of new market leaders that will show themselves in the new early bull market.
It’s goodbye Truss and hello Sunak. It was a success for the Daily Star’s lettuce and a brief rally with Sunak’s appointment.
Markets have been anything and with the third Prime Minister of the year (and hopefully the last?) some stability may now be seen by investors. Especially given that Sunak spent the summer telling everyone how Liz Truss’s policies would tank the market – and that’s exactly what they did.
But does that mean the downside is limited?
So far, the indices have rallied from the lows but they’re still well off their highs.
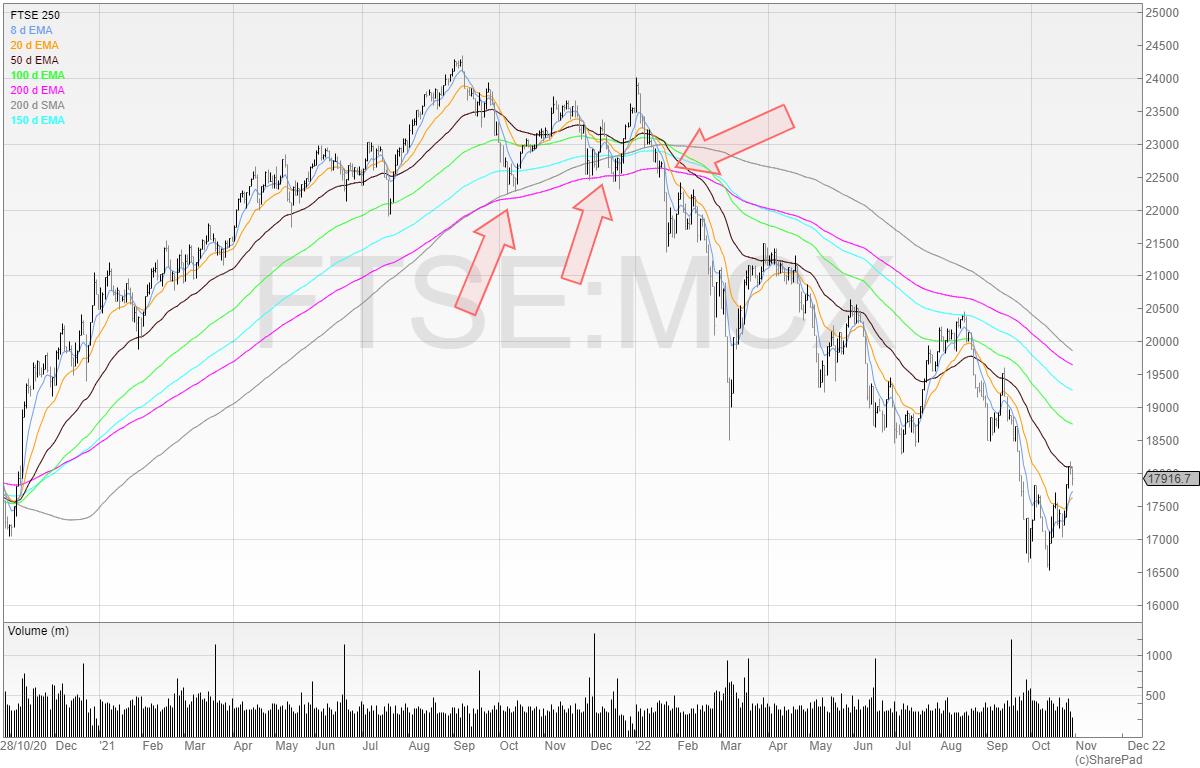
A quick look at the FTSE 250 shows that the pink line that was previously supported and now turned resistance is still far from being breached, needing another eight percent gain to test that resistance.

The FTSE 250 is the bellwether for the UK economy (the FTSE 100 is full of stuffy old economy stocks) as most stocks here are domestic small and midcaps.
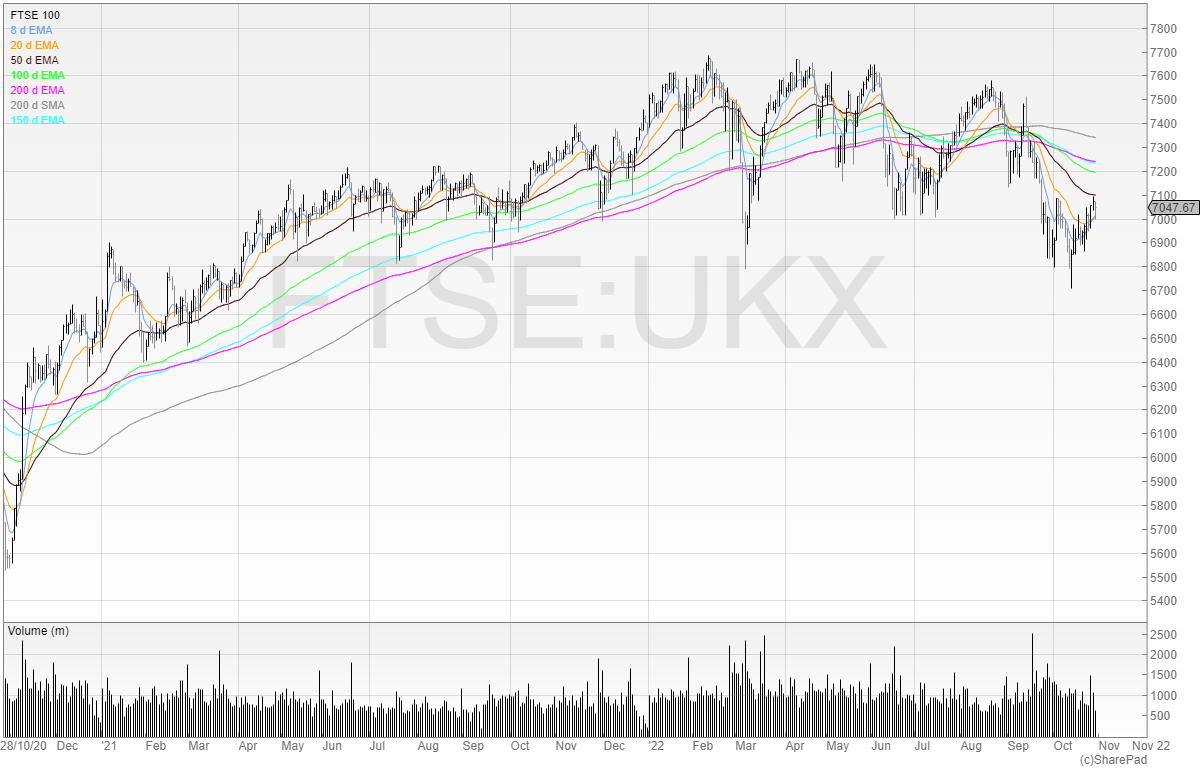
The FTSE 100 so far has been relatively unaffected. It’s not even in bear market territory yet.

It’s also one of the few times that you can say the FTSE 100 is outperforming the US.
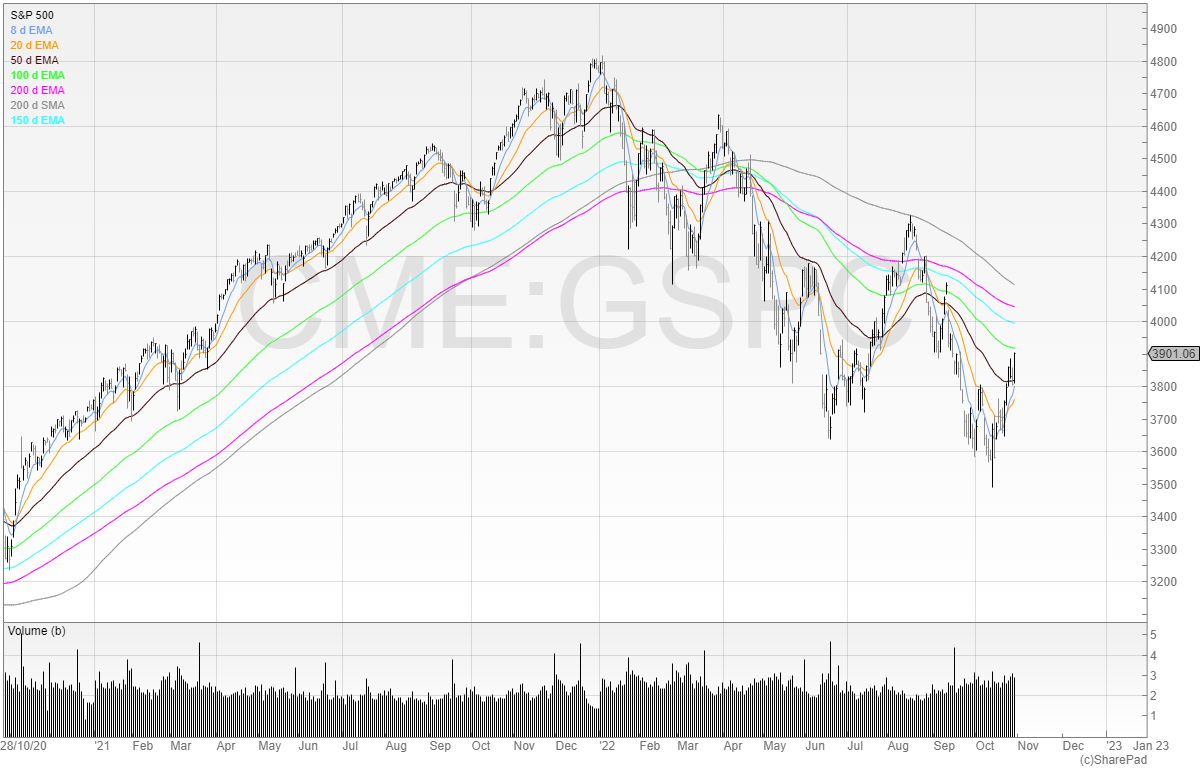
But the S&P 500 is taking a battering.

It’s not set a new high in over 10 months. The average bear market lasts around 289 days (or around 9.5 months).
But the stock didn’t hit bear market territory until mid-May. So using an average, we can expect February to be around the end of the bear market.
However, every bear market is different. We can’t assume that the average will play out. Maybe the market rallies sooner and maybe it rallies later.
What we do know is that bear markets have been getting shorter on average. The Covid-19 bear market lasted literally weeks, and whilst the GFC and Dotcom were brutal the market bounced back strongly both times after a healthy reset.
The longer the bear market, the bigger the reset.
The longer the bear market, the more people puke, and the bigger the rewards for those left standing.
We also know that the scene has now fundamentally shifted. There are entire trading teams who’ve grown up not knowing anything other than interest rates close to zero.
The cost of capital has been cheap their entire lives thus fuelling a credit-driven boom across all assets.
With inflation, that has now fundamentally changed. It’s likely interest rates will normalise at some point, but it may take some time (if at all) to go back to pre-Covid levels.
The geopolitical landscape has also now changed. Last year, it was unthinkable that Europe would see tanks rolling across countries, blowing things up and being blown up in return. We assumed the world was stable. Now we know it isn’t. Putin has taken the world into a new era with stability in Europe no longer assured. And nobody has truly forgotten about Taiwan and China.
Therefore, the illusion that the world will go back to normal has now well and truly been shattered. Cheap capital. Gone. Stability. Gone. Uncertainty? Here to stay.
What we do know, and what we can rely on, are stock price charts.
All we can do is follow the charts.
The new market leaders will have several things in common:
- They will zig whilst the market zags
- Volume will be high during accumulation
- They will be well bought up during price dips
New market leaders will zig whilst the market zags
Looking at the indices to see when the market has changed means you’ll forever be looking in the rear-view mirror.
Market leaders make their moves before the market because they’re leaders. Therefore, you need to be looking at individual stock setups rather than the overall market.
It’s true that during the Covid-19, the vast majority of stocks tanked then rallied in a V-shaped recovery. In a long and gruelling bear market, the market will repeatedly print new lows whilst the new market leaders will break ranks and start moving.
To find new market leaders I look for stocks that are within 10% of their 52-week highs.
This is because new market leaders will start putting in higher highs and moving north.
I also look for stocks that are at least 50% off their lows because I’m not interested in stocks that are trending downwards – only stocks that are showing signs of growth.
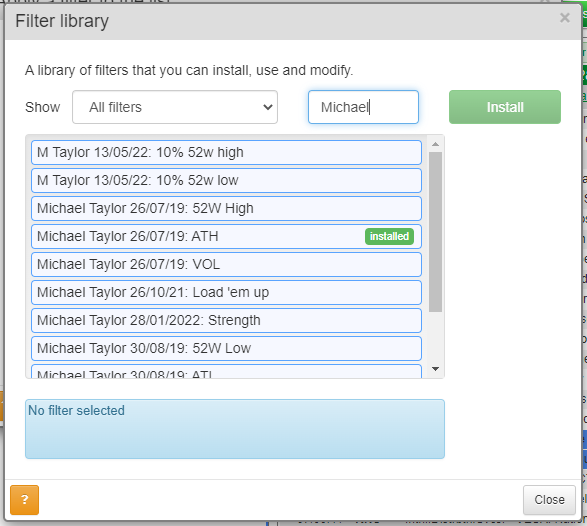
You can use my 10% within 52-week high filter to do so.
Search “Michael” on the filter library and it’ll come up.

New market leaders often have high volume during accumulation
Volume is a classic tell-tale of stocks that are being both distributed and accumulated.
By filtering for high volume, you can find stocks are seeing increased amounts of shares swapping hands and this can be a potential alert for a stock that should be on your watchlist.
If you see a stock print a bottom on high volume? You know then that at the lows there was increased activity in buying shares.
If it continues to rally on high volume? That interest has not subsided.
Again, you can use my volume filter to look at the previous or current day’s volume. Feel free to tinker around with the variables!
New market leaders get bought strongly in price dips
Strong support in price dips is a clear sign of interest in the stock.
If a stock rallies but pulls back sharply, then this tells us that interest in the stock is not that high (unless it was clearly heavily extended).
Ideally, we want stocks that are like tennis balls. When they fall, they bounce.
Look at individual stocks and not indices to find stock market winners
Don’t make the mistake of waiting for the indices to tell you we’re in a new early-stage bull market.
By then, it’ll be too late.
Do the work now and find the potential winners. Use appropriate filters and proper risk management and you’ll come out of the bear market a rare winner.
Michael Taylor
Buy the Breakout trading newsletter available at: www.shiftingshares.com/newsletter
Twitter: @shiftingshares
This article is for educational purposes only. It is not a recommendation to buy or sell shares or other investments. Do your own research before buying or selling any investment or seek professional financial advice.


