
Digging deep into stock market sensation Halma’s history, Richard gains clues about the kind of businesses long-term investors should think about owning in an economic blizzard.
I have never owned shares in Halma, in fact, I have never considered owning them even though the business has performed extraordinarily well.
Halma: Proof that roll-ups can grow really big
My interest in Halma has been academic. It is the arch-exponent of a roll-up strategy, in which companies buy highly profitable businesses in niche industries, grow them, and use their profits to buy more of the same kind of business.
I worry this strategy might become more difficult to execute, the bigger the mothership grows.
The larger a business is, the more sizable acquisitions must be if it is to grow at the same rate. Big companies are often more expensive than small companies, which slip under the radars of larger acquirers. They can also be complicated. Both of these factors make them more risky.
Scale can also bring efficiency though, as companies spread the cost of shared administrative functions like finance over more subsidiaries.
Halma is a trailblazer for UK roll-ups. It is the longest-lasting and biggest one I know, and a testbed for how well the strategy scales. The larger it grows, the more confident I feel about smaller roll-ups like Diploma, Judges Scientific, and SDI (in decreasing order of size).
I feel more comfortable with them (I own shares in Judges Scientific) because if there are limits to growth, these shares are less far along the journey and may be further from testing them.
Halma shows roll-ups can grow very big. It is a FTSE-100 company, in fact, it just squeaks into the 50 biggest companies listed on London’s main market. According to SharePad it is number 49 in the FTSE-100.
The consistency of its acquisition strategy is illustrated in this chart comparing free cash flow to acquisition spending:
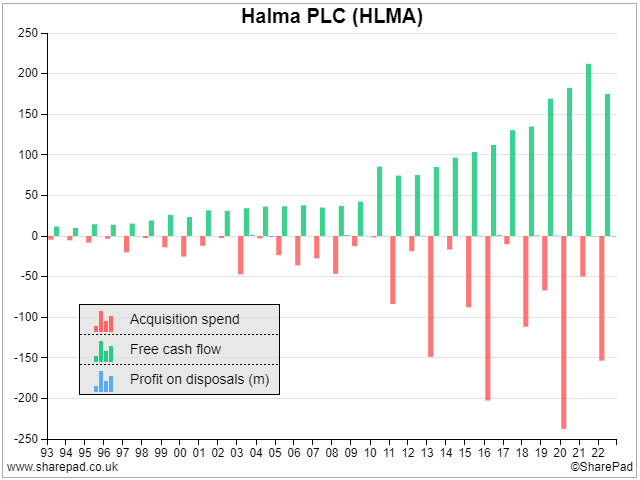
Free cash flow is the cash earned by the company in a year, after deducting the expenses of operating and maintaining the businesses it owns. Typically, companies use this cash to pay off debt, acquire other businesses, or pay money back to shareholders through dividends.
The chart shows that in most years Halma spent much of its free cash flow (green bars) on acquisitions (pink bars), but it was quite restrained. The years in which it spent more than it earned were rare, and they were usually preceded or followed by years in which it spent much less.
There’s another way a business can spend beyond its means though, and that is by being profligate with equity. Another chart can reassure us about that:
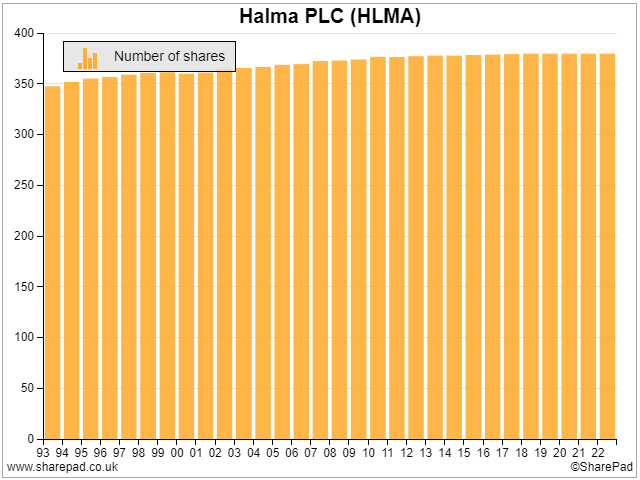
The company’s share count has risen very modestly, probably to fund share options for directors and other employees. In other words, it has not issued lots of shares at the expense of shareholders to fund acquisitions.
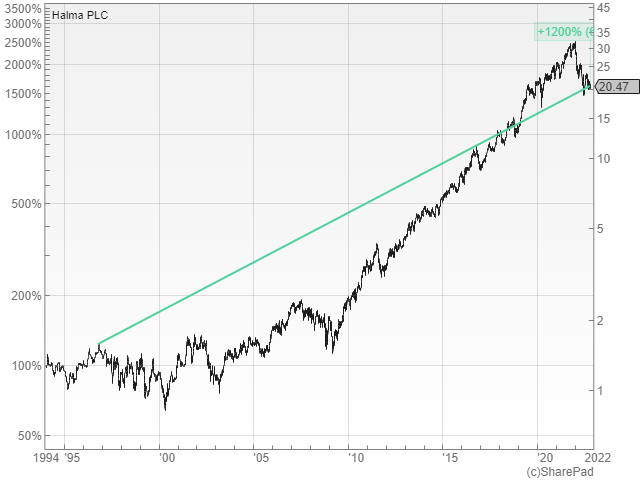
Shareholders have done very well out of Halma’s rise. Since the share price’s highest point in 1997, it has risen 1,200%, although, along with other highly-priced and high-quality shares, it has been pummelled this year. It has fallen 36% from its high at the end of 2021.
In 1997, Halma’s co-founder David Barber gave a speech in which he explained how the company had been one of the fastest-growing listed businesses over the preceding twenty years.
How Halma did it
The full text is available from Halma’s website. One part of the speech had a new resonance when I re-read it recently because Halma was born (in Barber’s words) during “a kind of economic blizzard”:
“There was a kind of economic blizzard which lasted about four years from 1973 to 1977. The Stock Market was in shock. We were producing a string of sensationally good results at Halma but at one stage our pe ratio was less than four. lnflation was running at 17% per annum and the banks couldn’t or didn’t want to lend money.”
Barber’s words arouse fear and hope in equal measure. The possibility of a pe ratio of 4 is very scary and perhaps incomprehensible to modern investors in high-quality businesses (certainly to me).
Despite its fall from grace, Halma shares are not cheap. The current pe ratio is 30, and the pe ratios of the smaller Halma-like companies I mentioned earlier range between 20 and 30. As investors continue to adjust their expectations, prices could continue to fall.
But for long-term investors, the history of Halma can tell us a bit about the kind of business we should be thinking about investing in, because Halma shows us that one way to beat inflation is to own companies that earn high returns on capital if we can buy them at a decent price.
To plough through the blizzard, Halma set some extraordinary targets:
“Against that background, we deliberately chose to develop a group which would be completely self-financing but which would also be able to sustain a growth in eps in the range of 20% – 30% compound per annum or, as we later defined it, 15% plus inflation. This latter target was our overriding corporate objective.
We determined that in order to achieve this in that very inflationary climate, we needed to be achieving an average Return on Capital Employed of 40%.”
Return on Capital Employed is a company’s internal rate of return. If Halma was earning a return of 40% on the money required to keep its factories and machines operating, fund working capital, and it could reinvest what was left of the money into businesses capable of earning similarly high returns, it believed it could grow profits 15% a year after inflation.
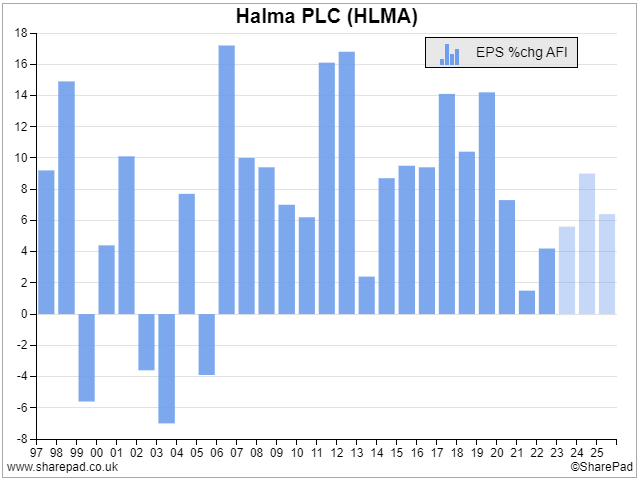
After the speech, Halma endured nearly a decade of quite mixed results and although it has rarely exceeded its 15% target since then, it has nevertheless grown strongly (the blue bars in this table show eps growth after inflation):
It probably achieved this by only investing in products and firms that met its requirements in terms of return on capital:
“The route we adopted at Halma as long-term operators was to focus on mix. In broad terms, simply doing less of anything that gave returns below the target level and doing more of what gave returns above this level. It sounds simplistic but given time, the cumulative effect of this can be massive, even in a large group. It does take time but it has the enormous virtue that it is virtually risk-free.
The analogy I have often used with analysts in discussing Halma is that it is like a centipede with very many little legs, but each leg moving a tiny step in the right direction. If every small move is positive and if every negative move is eliminated, then it is surprising how quickly one can move towards a defined objective. That is the long-term route.”
A rough proxy for ROCE as Halma might have originally defined it is SharePad’s ROCE measure excluding intangible assets. By that measure, Halma’s ROCE has been remarkably consistent::
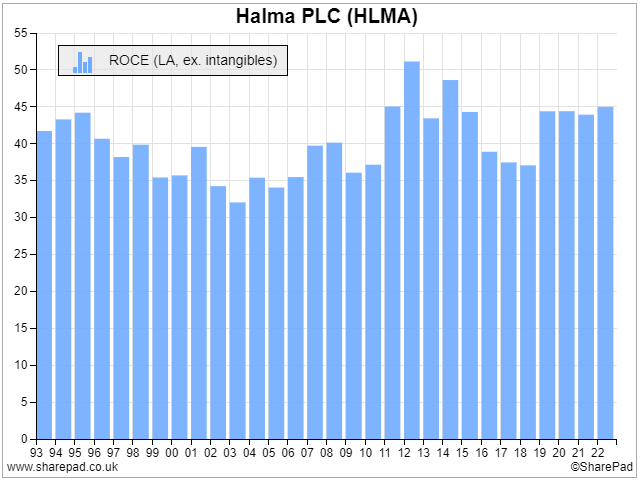
The early 2000s, when ROCE strayed towards 30% were difficult economic times, it was the period following the dot.com stockmarket crash, but I also wonder if Halma neglected a factor not mentioned in Mr. Barber’s speech.
Most of the intangible assets, excluded from the ROCE calculation, are the result of acquisitions. Then that would have been goodwill, but companies are required to recognise other acquired intangible assets, like brands, these days.
All of these intangible assets measure the premium paid for acquired businesses in addition to the value of the tangible assets (the factories, machines, vehicles, stock and so on).
In trying to establish how efficient a business is, we exclude the cost of acquired intangible assets, because they are sunk costs, created only at the time of acquisition.
Mr. Barber put efficiency, how well the acquired businesses could turn capital into profit in future, above everything else including the price it was prepared to pay for a business:
“For the longer-term operator, quality of earnings is paramount and there is no pe ratio high enough to compensate for or to allow for this. It’s an old saying but a true one that you can never pay enough for a good acquisition and never pay too little for a bad one.
Mr. Barber retired in 2003, and I wonder whether the companies Halma bought around the end of Mr. Barber’s time as chief executive, were so expensive that the cost of the acquisitions began to drag on growth.
This is speculation, the earliest annual report still available on Halma’s website is from 2008 so the numbers are lost to me, but valuations during the dot.com boom would no doubt have been much higher than during the blizzard Halma was born in.
The adoption of a measure of return on capital not mentioned in Mr. Barber’s speech may also be a sign Halma was paying more attention to the cost of acquisitions.
By 2008, it was monitoring Return on Total Invested Capital (ROTIC).
This measure adds the cost of goodwill and intangible assets at the original purchase price to the company’s operating capital. It is a fully loaded measure that tells us whether a company is making enough profit to justify the purchase cost of acquisitions as well as the ongoing funding required to run the businesses.
Inevitable the returns are much lower because the denominator, capital, is much higher and ROTIC is an after-tax measure:
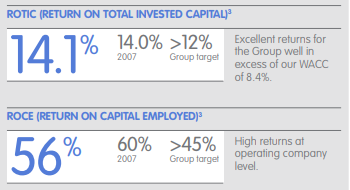
Source: Halma annual report 2008
In 2008, Halma reported a ROCE of 56% (the number differs somewhat from SharePad’s because of differences in the calculation), but a 14.1% ROTIC was still more than enough to justify prior acquisitions and power subsequent growth.
Halma was buying high-performing businesses, but it was also making sure it did not pay too much for them.
In the company’s latest annual report, ROCE plays second fiddle to ROTIC, echoing perhaps one of the other themes of Mr. Barber’s speech, that executives and investors should never rely on any single number.
The juggernaut is still performing. According to the company’s latest annual report, ROTIC in 2022 was 14.6%, still above its target of 12%, and marginally above what it achieved in 2008.
The smaller Halmas, Diploma, Judges Scientific, and SDI, use ROTIC too.
Diploma has a version it calls ROATCE (don’t ask) and SDI does not report the number but reassures investors it monitors ROTIC over the long-term.
Whether a company reports the number or not, it is a good idea to calculate it. I explained how to calculate SDI’s ROTIC in a previous article. The calculation is out of date now, but there is a link to a spreadsheet, which you can clone and put the latest data into, for any company.
I reckon Halma’s ROTIC is 13%, after tax.
Postscript
David Barber died in the first week of this year, but his legacy lives on, not just in the returns of Halma, but in the returns of all the companies (and investors) that have learned from it.
~
Contact Richard Beddard by email: richard@beddard.net or on Twitter: @RichardBeddard
This article is for educational purposes only. It is not a recommendation to buy or sell shares or other investments. Do your own research before buying or selling any investment or seek professional financial advice.


